0
2021
Metagenomics Sequencing Market

Metagenomics Sequencing Market

by Product & Service (Reagents & Consumables, Instruments, and Services), Technology (Shotgun Metagenomics Sequencing, 16S rRNA Sequencing, Whole Genome Sequencing & De Novo Assembly, and Metatranscriptomics), and Application (Ecological & Environmental Metagenomics, Clinical Diagnostics, Drug Discovery, Biofuel, and Industrial Application) Global Opportunity Analysis and Industry Forecast, 2021-2028

Report Code: A04697
Jun 2021 | Pages: 232
Tables: 113
Charts: 44
  • Formats*:

  • pdf

    Single User License, Five User
    License & Enterprise User License

  • xls

    Data Pack Excel License

  • ppt

    It comes with the additional cost
    of $2500.00 contact sales.


COVID-19

Pandemic disrupted the entire world and affected many industries.

Get detailed COVID-19 impact analysis on the Metagenomics Sequencing Market

Request Now !

Metagenomics Sequencing Market Overview:

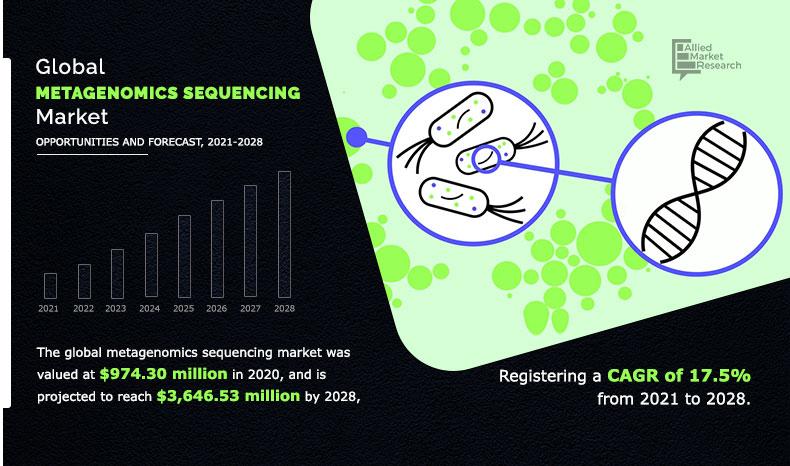
The global metagenomics sequencing market size was valued at $974.30 million in 2020, and is projected to reach $3,646.53 million by 2028, registering a CAGR of 17.5% from 2021 to 2028.

The overall impact of COVID-19 pandemic is likely to remain positive for the metagenomics sequencing market. As, throughout the COVID-19 pandemic, clinical diagnostics and testing is a critical component of the response and is on a rapid increase with the rise in number of cases, which enables rapid identification and isolation of infected individuals. The majority of this testing is PCR-based, detecting the presence of the SARS-CoV-2 virus; thereby, having a positive impact on the market.

Metagenomics is the study of genomes collectively in a microbial community. This process involves cloning and analyzing the genomes without culturing the organisms in the community. Metagenomics process has been responsible for substantial advances in microbial ecology, evolution, and diversity; this activity is mainly engaged in many research laboratories now. The global metagenomics sequencing market growth is largely driven by factors such as significant applications of metagenomics in various fields, various initiatives and funding from government & private bodies for large-scale sequencing projects, and decline in cost of sequencing. Increase in advancements regarding DNA sequencing and rise in expansion of metagenomics sequencing applications drive the growth of the global metagenomics sequencing market. Moreover, developing nations offer profitable opportunities for metagenomics sequencing product manufacturers.

Global-Metagenomics-Sequencing-Market,-2021-2028

The growth of the global metagenomics sequencing market is majorly driven by growth in demand for drug discovery, clinical diagnostics, and increase in prevalence of genetic disorder. In addition, metagenomic technologies enable the study of microbial communities as entire units without entailing the need of cultivating them. As uncultivability and genomic diversity serve as the two major roadblocks in the advancements of environmental and clinical microbiology, metagenomics has gained immense traction among the healthcare professionals and researchers. The advancement in metagenomics sequencing technologies is projected to increase the growth opportunities for the metagenomics sequencing market.

COVID-19 Impact

Coronavirus (COVID-19) was recognized in late December in Hubei province of Wuhan city in China. This highly contagious disease, caused by severe acute respiratory syndrome coronavirus 2 (SARS-CoV-2), is transmitted from humans to humans. The COVID-19 pandemic has resulted in nationwide lockdowns, thereby impacting every industry vertical. According to the report of the United Nations Human Rights, the COVID-19 pandemic has threatened all the members of the society. As a result, health care systems are affected, and the effective delivery of medical care and treatment to all patients has become a challenge worldwide. The overall impact of COVID-19 pandemic is likely to remain positive for the metagenomics sequencing market. As, throughout the COVID-19 pandemic, clinical diagnostics and testing is a critical component of the response and is on a rapid increase with the rise in number of cases, which enables rapid identification and isolation of infected individuals. The majority of this testing is PCR-based, detecting the presence of the SARS-CoV-2 virus only. Next-generation sequencing (NGS) and whole genome sequencing of the COVID-19 virus is providing metagenomics data of diagnostic test that is combined with clinical data to search for effective treatments.

Product & Service Segment Review

By product & service, the global metagenomics sequencing market is categorized into product & service type reagents & consumables, instruments, and services. The services segment is categorized in analysis & data interpretation solutions and metagenomics sequencing services. Reagents & consumables is anticipated to be the largest growing segment during the analysis period. Use of reagents & consumables ensures that the DNA utilized for metagenomics sequencing analysis is the representative of all cells present in the sample and ideal for generation of genomic libraries. In addition, the consumables used in pre-sequencing step ensure that the sample DNA that is subjected to sequencing is processed accurately to generate the desirable nucleotide sequence. There is an increase in the demand for metagenomics sequencing primarily due to rise in genetic disorders and increase in disease and metagenomics sequencing research projects which boosts the market growth.

Metagenomics Sequencing Market
By Product & Service

Your browser does not support the canvas element.

Services segment held a dominant position in 2020 and would continue to maintain the lead over the forecast period.

Get more information on this report : Request Sample Pages

Technology Segment Review

By technology, the global metagenomics sequencing market is segmented into shotgun metagenomics sequencing, 16S rRNA sequencing, whole genome sequencing & de novo assembly, and metatranscriptomics. The shotgun metagenomics sequencing segment is anticipated to be the largest growing segment during the analysis period, owing to the advantages offered by shotgun sequencing over other techniques of sequencing, and healthcare professionals, and the surge in number of metagenomics sequencing-based research activities. The rise in preference toward adoption of shotgun due to better advantages offered is anticipated to help the global metagenomics sequencing market gain traction. Since past few years, the usage of shotgun metagenomic sequencing has increased owing to the application where all the genomes in a DNA can be read with the help of shotgun metagenomic sequencing.

Metagenomics Sequencing Market
By Technology

Your browser does not support the canvas element.

16S rRNA sequencing segment is projected as one of the most lucrative segment.

Get more information on this report : Request Sample Pages

Application Segment Review

By application, the global metagenomics sequencing market is segmented into ecological & environmental metagenomics, clinical diagnostics, drug discovery, biofuel, industrial application. The drug discovery segment is anticipated to be the largest growing segment over the analysis period. Whereas, the clinical diagnostics segment is expected to register the highest growth rate from 2020 to 2028 owing to development of software packages and instruments utilized in the metagenomics studies. The rise in prevalence of pathogenic disease and viral disease have opened avenues for the growth of the global metagenomics sequencing market.

Metagenomics Sequencing Market
By Application

Your browser does not support the canvas element.

Drug discovery segment held a dominant position in 2020 and would continue to maintain the lead over the forecast period.

Get more information on this report : Request Sample Pages

Region segment review

North America is expected to maintain its dominance during the forecast period due to The three major countries of North America considered in the report include the U.S., Canada, and Mexico. North America is dominating the market of overall global metagenomics sequencing and expected to dominate throughout the forecast period. This is attributed to the increase in implementation of DNA sequencing across metagenomics applications in this region. In addition, rapid adoption of novel sequencing technologies in this region has contributed to its dominance. Increase in acquisition, product launch, and product approval by key players of this market operate in North America turn, fuels growth of the market.

Metagenomics Sequencing Market
By Region

2028
North America 
Europe
Asia-Pacific
LAMEA

North America was holding a dominant position in 2020 and would continue to maintain the lead over the analysis period.

Get more information on this report : Request Sample Pages

Major players that operate in this metagenomics sequencing market include BGI Genomics Co., Ltd., Eurofins Genomics, Illumina, Inc., Macrogen Inc., Oxford Nanopore Technologies Ltd, Pacific Biosciences of California, Inc., PerkinElmer Inc., QIAGEN N.V., Swift Biosciences Inc., and Thermo Fisher Scientific Inc.

Key Benefits For Stakeholders

  • This report provides a detailed quantitative analysis of the current global metagenomics sequencing market trends and forecast estimations from 2020 to 2028, which assists to identify the prevailing market opportunities. 
  • An in-depth metagenomics sequencing market analysis includes analysis of various regions, which is anticipated to provide a detailed understanding of the current trends to enable stakeholders formulate region-specific plans.
  • A comprehensive analysis of factors that drive and restrain the growth of the global is provided.
  • The projections in this report are made by analyzing the current trends and future market potential from 2021 to 2028, in terms of value.
  • An extensive analysis of various regions provides insights that are expected to allow companies to strategically plan their business moves.
  • Key market players within the global metagenomics sequencing market are profiled in this report and their strategies are analyzed thoroughly, which helps in understanding competitive outlook of the global metagenomics sequencing market.

Key Market Segments

By Product & Service

  • Reagents & Consumables
  • Instruments
  • Services
  • Analysis & Data Interpretation Solutions
  • Metagenomics Sequencing Services

By Technology

  • Shotgun Metagenomics Sequencing
  • 16S rRNA Sequencing 
  • Whole Genome Sequencing & De Novo Assembly 
  • Metatranscriptomics

By Application

  • Ecological & Environmental Metagenomics 
  • Clinical Diagnostics
  • Drug Discovery 
  • Biofuel
  • Industrial Applications 

By Region

  • North America
    • U.S.
    • Canada
    • Mexico
  • Europe
    • Germany
    • Italy 
    • France
    • UK
    • Rest of Europe
  • Asia-Pacific
    • Japan
    • China
    • India
    • Australia
    • Rest of Asia-Pacific
  • LAMEA
    • Brazil
    • Saudi Arabia
    • South Africa
    • Rest of LAMEA

Metagenomics Sequencing Market Report Highlights

Aspects Details
By PRODUCT & SERVICE
  • Reagents & consumables
  • Instruments
  • Services
    • Analysis & Data Interpretation Solutions
    • Metagenomic Sequencing Services
By TECHNOLOGY
  • Shotgun metagenomic sequencing
  • 16S rRNA sequencing
  • Whole genome sequencing & de novo assembly
  • Metatranscriptomics
By APPLICATION
  • Drug discovery
  • Ecological & environmental metagenomics
  • Clinical diagnostics
  • Biofuel
  • Industrial applications
By Region
  • North America  (U.S., Canada, Mexico)
  • Europe  (France, Germany, Italy, Spain, UK, Russia, Rest of Europe)
  • Asia-Pacific  (China, Japan, India, South Korea, Australia, Thailand, Malaysia, Indonesia, Rest of Asia-Pacific)
  • LAMEA  (Brazil, South Africa, Saudi Arabia, UAE, Argentina, Rest of LAMEA)
Key Market Players EUROFINS SCIENTIFIC SE (EUROFINS GENOMICS), THERMO FISHER SCIENTIFIC, INC., BGI GENOMICS CO LTD, OXFORD NANOPORE TECHNOLOGIES LTD., QIAGEN N.V., .MACROGEN INC., PACIFIC BIOSCIENCES OF CALIFORNIA, INC., PERKINELMER INC., SWIFT BIOSCIENCES INC., .ILLUMINA, INC.
 

CHAPTER 1:INTRODUCTION

1.1.Report description
1.2.Key benefits
1.3.Key market segments
1.4.Research methodology

1.4.1.Secondary research
1.4.2.Primary research
1.4.3.Analyst tools and models

CHAPTER 2:EXECUTIVE SUMMARY

2.1.Key findings of the study
2.2.CXO perspective

CHAPTER 3:MARKET OVERVIEW

3.1.Market definition and scope
3.2.Key findings

3.2.1.Top investment pockets
3.2.2.Top winning strategies

3.3.Porter’s five forces analysis
3.4.Top player positioning, 2020
3.5.Market dynamics

3.5.1.Drivers

3.5.1.1.Advancements in metagenomics sequencing
3.5.1.2.Significant applications of metagenomics in various fields
3.5.1.3.Initiatives and funding from government & private bodies for large-scale sequencing projects
3.5.1.4.Declining cost of sequencing

3.5.2.Restraints

3.5.2.1.End-user budget constraints in developing countries
3.5.2.2.Dearth of skilled professionals

3.5.3.Opportunities

3.5.3.1.Availability of cloud computing for data management

3.6.COVID-19 impact analysis on the global metagenomics sequencing market

CHAPTER 4:GLOBAL METAGENOMICS SEQUENCING MARKET, BY PRODUCT & SERVICE

4.1.Overview

4.1.1.Market size and forecast

4.2.Reagents & consumables

4.2.1.Key market trends, key growth factors and opportunities
4.2.2.Market size and forecast
4.2.3.Market analysis, by country

4.3.Instruments

4.3.1.Key market trends, key growth factors and opportunities
4.3.2.Market size and forecast, by region
4.3.3.Market analysis, by country

4.4.Services

4.4.1.Key market trends, key growth factors and opportunities
4.4.2.Market size and forecast, by region
4.4.3.Market analysis, by country
4.4.4.Market size and forecast
4.4.5.Analysis & Data Interpretation Solutions

4.4.5.1.Market size and forecast

4.4.6.Metagenomic Sequencing Services

4.4.6.1.Market size and forecast

CHAPTER 5:GLOBAL METAGENOMICS SEQUENCING MARKET, BY TECHNOLOGY

5.1.Overview

5.1.1.Market size and forecast

5.2.Shotgun metagenomic sequencing

5.2.1.Key market trends, key growth factors and opportunities
5.2.2.Market size and forecast
5.2.3.Market analysis, by country

5.3.16S rRNA sequencing

5.3.1.Key market trends, key growth factors and opportunities
5.3.2.Market size and forecast, by region
5.3.3.Market analysis, by country

5.4.Whole genome sequencing & de novo assembly

5.4.1.Key market trends, key growth factors and opportunities
5.4.2.Market size and forecast, by region
5.4.3.Market size and forecast, by country

5.5.Metatranscriptomics

5.5.1.Key market trends, key growth factors and opportunities
5.5.2.Market size and forecast, by region
5.5.3.Market analysis, by country

CHAPTER 6:GLOBAL METAGENOMICS SEQUENCING MARKET, BY APPLICATION

6.1.Overview

6.1.1.Market size and forecast

6.2.Drug discovery

6.2.1.Key market trends, key growth factors and opportunities
6.2.2.Market size and forecast
6.2.3.Market analysis, by country

6.3.Ecological & environmental metagenomics

6.3.1.Key market trends, key growth factors and opportunities
6.3.2.Market size and forecast, by region
6.3.3.Market analysis, by country

6.4.Clinical diagnostics

6.4.1.Key market trends, key growth factors and opportunities
6.4.2.Market size and forecast, by region
6.4.3.Market analysis, by country

6.5.Biofuel

6.5.1.Key market trends, key growth factors and opportunities
6.5.2.Market size and forecast, by region
6.5.3.Market analysis, by country

6.6.Industrial applications

6.6.1.Key market trends, key growth factors and opportunities
6.6.2.Market size and forecast, by region
6.6.3.Market analysis, by country

CHAPTER 7:GLOBAL METAGENOMICS SEQUENCING MARKET, BY REGION

7.1.Overview

7.1.1.Market size and forecast

7.2.North America

7.2.1.Key trends and opportunities
7.2.2.North America market size and forecast, by country

7.2.2.2.U.S.

7.2.2.2.1.U.S. market size and forecast, by product & service
7.2.2.2.2.U.S. market size and forecast, by technology
7.2.2.2.3.U.S. market size and forecast, by application

7.2.2.3.Canada

7.2.2.3.1.Canada market size and forecast, by product & service
7.2.2.3.2.Canada market size and forecast, by technology
7.2.2.3.3.Canada market size and forecast, by application

7.2.2.4.Mexico

7.2.2.4.1.Mexico market size and forecast, by product & service
7.2.2.4.2.Mexico market size and forecast, by technology
7.2.2.4.3.Mexico market size and forecast, by application

7.2.3.North America market size and forecast, by product & service
7.2.4.North America market size and forecast, by technology
7.2.5.North America market size and forecast, by application

7.3.Europe

7.3.1.Key trends and opportunities
7.3.2.Europe market size and forecast, by country

7.3.2.1.Germany

7.3.2.1.1.Germany market size and forecast, by product & service
7.3.2.1.2.Germany market size and forecast, by technology
7.3.2.1.3.Germany market size and forecast, by application

7.3.2.2.France

7.3.2.2.1.France market size and forecast, by product & service
7.3.2.2.2.France market size and forecast, by technology
7.3.2.2.3.France market size and forecast, by application

7.3.2.3.UK

7.3.2.3.1.UK market size and forecast, by product & service
7.3.2.3.2.UK market size and forecast, by technology
7.3.2.3.3.UK market size and forecast, by application

7.3.2.4.Italy

7.3.2.4.1.Italy market size and forecast, by product & service
7.3.2.4.2.Italy market size and forecast, by technology
7.3.2.4.3.Italy market size and forecast, by application

7.3.2.5.Rest of Europe

7.3.2.5.1.Rest of Europe market size and forecast, by product & service
7.3.2.5.2.Rest of Europe market size and forecast, by technology
7.3.2.5.3.Rest of Europe market size and forecast, by application

7.3.3.Europe market size and forecast, by product & service
7.3.4.Europe market size and forecast, by technology
7.3.5.Europe market size and forecast, by application

7.4.Asia-Pacific

7.4.1.Key trends and opportunities
7.4.2.Asia-Pacific market size and forecast, by country

7.4.2.2.Japan

7.4.2.2.1.Japan market size and forecast, by product & service
7.4.2.2.2.Japan market size and forecast, by technology
7.4.2.2.3.Japan market size and forecast, by application

7.4.2.3.China

7.4.2.3.1.China market size and forecast, by product & service
7.4.2.3.2.China market size and forecast, by technology
7.4.2.3.3.China market size and forecast, by application

7.4.2.4.Australia

7.4.2.4.1.Australia market size and forecast, by product & service
7.4.2.4.2.Australia market size and forecast, by technology
7.4.2.4.3.Australia market size and forecast, by application

7.4.2.5.India

7.4.2.5.1.India market size and forecast, by product & service
7.4.2.5.2.India market size and forecast, by technology
7.4.2.5.3.India market size and forecast, by application

7.4.2.6.Rest of Asia-Pacific

7.4.2.6.1.Rest of Asia-Pacific market size and forecast, by product & service
7.4.2.6.2.Rest of Asia-Pacific market size and forecast, by technology
7.4.2.6.3.Rest of Asia-Pacific market size and forecast, by application

7.4.3.Asia-Pacific market size and forecast, by product & service
7.4.4.Asia-Pacific market size and forecast, by technology
7.4.5.Asia-Pacific market size and forecast, by application

7.5.LAMEA

7.5.1.Key trends and opportunities
7.5.2.LAMEA market size and forecast, by country

7.5.2.1.Brazil

7.5.2.1.1.Brazil market size and forecast, by product & service
7.5.2.1.2.Brazil market size and forecast, by technology
7.5.2.1.3.Brazil market size and forecast, by application

7.5.2.2.Saudi Arabia

7.5.2.2.1.Saudi Arabia market size and forecast, by product & service
7.5.2.2.2.Saudi Arabia market size and forecast, by technology
7.5.2.2.3.Saudi Arabia market size and forecast, by application

7.5.2.3.South Africa

7.5.2.3.1.South Africa market size and forecast, by product & Service
7.5.2.3.2.South Africa market size and forecast, by technology
7.5.2.3.3.South Africa market size and forecast, by application

7.5.2.4.Rest of LAMEA

7.5.2.4.1.Rest of LAMEA market size and forecast, by product & service
7.5.2.4.2.Rest of LAMEA market size and forecast, by technology
7.5.2.4.3.Rest of LAMEA market size and forecast, by application

7.5.3.LAMEA market size and forecast, by product & service
7.5.4.LAMEA market size and forecast, by technology
7.5.5.LAMEA market size and forecast, by application

CHAPTER 8:COMPANY PROFILES

8.1.BGI GENOMICS CO LTD

8.1.1.Company overview
8.1.2.Company snapshot
8.1.3.Operating business segments
8.1.4.Product portfolio
8.1.5.Key strategic moves and developments

8.2.EUROFINS SCIENTIFIC SE (EUROFINS GENOMICS)

8.2.1.Company overview
8.2.2.Company snapshot
8.2.3.Operating business segments
8.2.4.Product portfolio
8.2.5.Business performance
8.2.6.Key strategic moves and developments

8.3.ILLUMINA, INC.

8.3.1.Company overview
8.3.2.Company snapshot
8.3.3.Operating business segments
8.3.4.Product portfolio
8.3.5.Business performance
8.3.6.Key strategic moves and developments

8.4.MACROGEN INC.

8.4.1.Company overview
8.4.2.Company snapshot
8.4.3.Operating business segments
8.4.4.Product portfolio
8.4.5.Business performance

8.5.OXFORD NANOPORE TECHNOLOGIES LTD.

8.5.1.Company overview
8.5.2.Company snapshot
8.5.3.Product portfolio

8.6.PACIFIC BIOSCIENCES OF CALIFORNIA, INC.

8.6.1.Company overview
8.6.2.Company snapshot
8.6.3.Operating business segments
8.6.4.Product portfolio
8.6.5.Business performance
8.6.6.Key strategic moves and developments

8.7.PERKINELMER INC.

8.7.1.Company overview
8.7.2.Company snapshot
8.7.3.Operating business segments
8.7.4.Product portfolio
8.7.5.Business performance

8.8.QIAGEN N.V.

8.8.1.Company overview
8.8.2.Company snapshot
8.8.3.Operating business segments
8.8.4.Product portfolio
8.8.5.Business performance
8.8.6.Key strategic moves and developments

8.9.SWIFT BIOSCIENCES INC.

8.9.1.Company overview
8.9.2.Company snapshot
8.9.3.Operating business segments
8.9.4.Product portfolio
8.9.5.Key strategic moves and developments

8.10.THERMO FISHER SCIENTIFIC, INC.

8.10.1.Company overview
8.10.2.Company snapshot
8.10.3.Operating business segments
8.10.4.Product portfolio
8.10.5.Business performance
8.10.6.Key strategic moves and developments

LIST OF TABLES

TABLE 01.METAGENOMICS SEQUENCING MARKET, BY PRODUCT & SERVICE ($MILLION), 2020-2028
TABLE 02.METAGENOMICS SEQUENCING MARKET FOR REAGENTS & CONSUMABLES, BY REGION, ($MILLION), 2020-2028
TABLE 03.METAGENOMICS SEQUENCING MARKET FOR INSTRUMENTS, BY REGION, ($MILLION), 2020-2028
TABLE 04.METAGENOMICS SEQUENCING MARKET FOR SERVICES, BY REGION, ($MILLION), 2021 & 2028
TABLE 05.METAGENOMICS SEQUENCING MARKET FOR SERVICES, ($MILLION), 2021-2028
TABLE 06.METAGENOMICS SEQUENCING MARKET, BY TECHNOLOGY ($MILLION), 2020-2028
TABLE 07.SHOTGUN METAGENOMICS SEQUENCING MARKET, BY REGION, ($MILLION), 2020-2028
TABLE 08.16S RRNA SEQUENCING MARKET, BY REGION, ($MILLION), 2020-2028
TABLE 09.WHOLE GENOME SEQUENCING & DE NOVO ASSEMBLY METAGENOMICS SEQUENCING MARKET, BY REGION, ($MILLION), 2021 & 2028
TABLE 10.METAGENOMICS SEQUENCING MARKET FOR METATRANSCRIPTOMICS, BY REGION, ($MILLION), 2020 & 2028
TABLE 11.METAGENOMICS SEQUENCING MARKET, BY APPLICATION ($MILLION), 2020-2028
TABLE 12.METAGENOMICS SEQUENCING MARKET FOR DRUG DISCOVERY, BY REGION, ($MILLION), 2020-2028
TABLE 13.METAGENOMICS SEQUENCING MARKET FOR ECOLOGICAL & ENVIRONMENTAL METAGENOMICS, BY REGION, ($MILLION), 2020-2028
TABLE 14.METAGENOMICS SEQUENCING MARKET FOR CLINICAL DIAGNOSTICS, BY REGION, ($MILLION), 2020-2028
TABLE 15.METAGENOMICS SEQUENCING MARKET FOR BIOFUEL, BY REGION, ($MILLION), 2020-2028
TABLE 16.METAGENOMICS SEQUENCING MARKET FOR INDUSTRIAL APPLICATIONS, BY REGION, ($MILLION), 2020-2028
TABLE 17.METAGENOMICS SEQUENCING MARKET, BY REGION, 2020–2028 ($MILLION)
TABLE 18.NORTH AMERICA METAGENOMICS SEQUENCING MARKET, BY COUNTRY, 2020-2028($MILLION)
TABLE 19.U.S. METAGENOMICS SEQUENCING MARKET, BY PRODUCT & SERVICE, 2020-2028($MILLION)
TABLE 20.U.S. METAGENOMICS SEQUENCING MARKET, BY TECHNOLOGY, 2020-2028($MILLION)
TABLE 21.U.S. METAGENOMICS MARKET, BY APPLICATION, 2020-2028($MILLION)
TABLE 22.CANADA METAGENOMICS SEQUENCING MARKET, BY PRODUCT & SERVICE, 2020-2028($MILLION)
TABLE 23.CANADA METAGENOMICS SEQUENCING MARKET, BY TECHNOLOGY, 2020-2028($MILLION)
TABLE 24.CANADA METAGENOMICS SEQUENCING MARKET, BY APPLICATION, 2020-2028($MILLION)
TABLE 25.MEXICO METAGENOMICS SEQUENCING MARKET, BY PRODUCT & SERVICE, 2020-2028($MILLION)
TABLE 26.MEXICO METAGENOMICS SEQUENCING MARKET, BY TECHNOLOGY, 2020-2028($MILLION)
TABLE 27.MEXICO METAGENOMICS SEQUENCING MARKET, BY APPLICATION, 2020-2028($MILLION)
TABLE 28.NORTH AMERICA METAGENOMICS SEQUENCING MARKET, BY PRODUCT & SERVICE, 2020-2028($MILLION)
TABLE 29.NORTH AMERICA METAGENOMICS SEQUENCING MARKET, BY TECHNOLOGY, 2020-2028($MILLION)
TABLE 30.NORTH AMERICA METAGENOMICS SEQUENCING MARKET, BY APPLICATION, 2020-2028($MILLION)
TABLE 31.EUROPE METAGENOMICS SEQUENCING MARKET, BY COUNTRY, 2020-2028($MILLION)
TABLE 32.GERMANY METAGENOMICS SEQUENCING MARKET, BY PRODUCT & SERVICE, 2020-2028($MILLION)
TABLE 33.GERMANY METAGENOMICS SEQUENCING MARKET, BY TECHNOLOGY, 2020-2028($MILLION)
TABLE 34.GERMANY METAGENOMICS SEQUENCING MARKET, BY APPLICATION, 2020-2028($MILLION)
TABLE 35.FRANCE METAGENOMICS SEQUENCING MARKET, BY PRODUCT & SERVICE, 2020-2028($MILLION)
TABLE 36.FRANCE METAGENOMICS SEQUENCING MARKET, BY TECHNOLOGY, 2020-2028($MILLION)
TABLE 37.FRANCE METAGENOMICS SEQUENCING MARKET, BY APPLICATION, 2020-2028($MILLION)
TABLE 38.UK METAGENOMICS SEQUENCING MARKET, BY PRODUCT & SERVICE, 2020-2028($MILLION)
TABLE 39.UK METAGENOMICS SEQUENCING MARKET, BY TECHNOLOGY, 2020-2028($MILLION)
TABLE 40.UK METAGENOMICS SEQUENCING MARKET, BY APPLICATION, 2020-2028($MILLION)
TABLE 41.ITALY METAGENOMICS MARKET, BY PRODUCT & SERVICE, 2020-2028($MILLION)
TABLE 42.ITALY METAGENOMICS SEQUENCING MARKET, BY TECHNOLOGY, 2020-2028($MILLION)
TABLE 43.ITALY METAGENOMICS SEQUENCING MARKET, BY APPLICATION, 2020-2028($MILLION)
TABLE 44.REST OF EUROPE METAGENOMICS MARKET, BY PRODUCT & SERVICE, 2020-2028($MILLION)
TABLE 45.REST OF EUROPE METAGENOMICS SEQUENCING MARKET, BY TECHNOLOGY, 2020-2028($MILLION)
TABLE 46.REST OF EUROPE METAGENOMICS SEQUENCING MARKET, BY APPLICATION, 2020-2028($MILLION)
TABLE 47.EUROPE METAGENOMICS MARKET, BY PRODUCT & SERVICE, 2020-2028($MILLION)
TABLE 48.EUROPE METAGENOMICS SEQUENCING MARKET, BY TECHNOLOGY, 2020-2028($MILLION)
TABLE 49.EUROPE METAGENOMICS SEQUENCING MARKET, BY APPLICATION, 2020-2028($MILLION)
TABLE 50.ASIA-PACIFIC METAGENOMICS SEQUENCING MARKET, BY COUNTRY, 2020-2028($MILLION)
TABLE 51.JAPAN METAGENOMICS SEQUENCING MARKET, BY PRODUCT & SERVICE, 2020-2028($MILLION)
TABLE 52.JAPAN METAGENOMICS SEQUENCING MARKET, BY TECHNOLOGY, 2020-2028($MILLION)
TABLE 53.JAPAN METAGENOMICS SEQUENCING MARKET, BY APPLICATION, 2020-2028($MILLION)
TABLE 54.CHINA METAGENOMICS SEQUENCING MARKET, BY PRODUCT & SERVICE, 2020-2028($MILLION)
TABLE 55.CHINA METAGENOMICS SEQUENCING MARKET, BY TECHNOLOGY, 2020-2028($MILLION)
TABLE 56.CHINA METAGENOMICS SEQUENCING MARKET, BY APPLICATION, 2020-2028($MILLION)
TABLE 57.AUSTRALIA METAGENOMICS SEQUENCING MARKET, BY PRODUCT & SERVICE, 2020-2028($MILLION)
TABLE 58.AUSTRALIA METAGENOMICS SEQUENCING MARKET, BY TECHNOLOGY, 2020-2028($MILLION)
TABLE 59.AUSTRALIA METAGENOMICS SEQUENCING MARKET, BY APPLICATION, 2020-2028($MILLION)
TABLE 60.INDIA METAGENOMICS SEQUENCING MARKET, BY PRODUCT & SERVICE, 2020-2028($MILLION)
TABLE 61.INDIA METAGENOMICS SEQUENCING MARKET, BY TECHNOLOGY, 2020-2028($MILLION)
TABLE 62.INDIA METAGENOMICS SEQUENCING MARKET, BY APPLICATION, 2020-2028($MILLION)
TABLE 63.REST OF ASIA-PACIFIC METAGENOMICS SEQUENCING MARKET, BY PRODUCT & SERVICE, 2020-2028($MILLION)
TABLE 64.REST OF ASIA-PACIFIC METAGENOMICS SEQUENCING MARKET, BY TECHNOLOGY, 2020-2028($MILLION)
TABLE 65.REST OF ASIA-PACIFIC METAGENOMICS SEQUENCING MARKET, BY APPLICATION, 2020-2028($MILLION)
TABLE 66.ASIA-PACIFIC METAGENOMICS SEQUENCING MARKET, BY PRODUCT & SERVICE, 2020-2028($MILLION)
TABLE 67.ASIA-PACIFIC METAGENOMICS SEQUENCING MARKET, BY TECHNOLGY, 2020-2028($MILLION)
TABLE 68.ASIA-PACIFIC METAGENOMICS SEQUENCING MARKET, BY APPLICATION, 2020-2028($MILLION)
TABLE 69.LAMEA METAGENOMICS SEQUENCING MARKET, BY COUNTRY, 2020-2028($MILLION)
TABLE 70.BRAZIL METAGENOMICS SEQUENCING MARKET, BY PRODUCT & SERVICE, 2020-2028($MILLION)
TABLE 71.BRAZIL METAGENOMICS SEQUENCING MARKET, BY TECHNOLOGY, 2020-2028($MILLION)
TABLE 72.BRAZIL METAGENOMICS SEQUENCING MARKET, BY APPLICATION, 2020-2028($MILLION)
TABLE 73.SAUDI ARABIA METAGENOMICS SEQUENCING MARKET, BY PRODUCT & SERVICE, 2020-2028($MILLION)
TABLE 74.SAUDI ARABIA METAGENOMICS SEQUENCING MARKET, BY TECHNOLOGY, 2020-2028($MILLION)
TABLE 75.SAUDI ARABIA METAGENOMICS SEQUENCING MARKET, BY APPLICATION, 2020-2028($MILLION)
TABLE 76.SOUTH AFRICA METAGENOMICS SEQUENCING MARKET, BY PRODUCT & SERVICE, 2020–2028 ($MILLION)
TABLE 77.SOUTH AFRICA METAGENOMICS SEQUENCING MARKET, BY TECHNOLOGY, 2020–2028 ($MILLION)
TABLE 78.SOUTH AFRICA METAGENOMICS SEQUENCING MARKET, BY APPLICATION, 2020–2028 ($MILLION)
TABLE 79.REST OF LAMEA METAGENOMICS SEQUENCING MARKET, BY PRODUCT & SERVICE, 2020–2028 ($MILLION)
TABLE 80.REST OF LAMEA METAGENOMICS SEQUENCING MARKET, BY TECHNOLOGY, 2020–2028 ($MILLION)
TABLE 81.REST OF LAMEA METAGENOMICS SEQUENCING MARKET, BY APPLICATION, 2020–2028 ($MILLION)
TABLE 82.LAMEA METAGENOMICS SEQUENCING MARKET, BY PRODUCT & SERVICE, 2020–2028 ($MILLION)
TABLE 83.LAMEA METAGENOMICS SEQUENCING MARKET, BY COUNTRY, 2020–2028 ($MILLION)
TABLE 84.LAMEA METAGENOMICS SEQUENCING MARKET, BY APPLICATION, 2020–2028 ($MILLION)
TABLE 85.BGI GENOMICS: COMPANY SNAPSHOT
TABLE 86.BGI GENOMICS: OPERATING SEGMENTS
TABLE 87.BGI GENOMICS: PRODUCT PORTFOLIO
TABLE 88.EUROFINS: COMPANY SNAPSHOT
TABLE 89.EUROFINS: OPERATING SEGMENTS
TABLE 90.EUROFINS: PRODUCT PORTFOLIO
TABLE 91.ILLUMINA: COMPANY SNAPSHOT
TABLE 92.ILLUMINA: OPERATING SEGMENTS
TABLE 93.ILLUMINA: PRODUCT PORTFOLIO
TABLE 94.MACROGEN: COMPANY SNAPSHOT
TABLE 95.MACROGEN: OPERATING SEGMENTS
TABLE 96.MACROGEN: PRODUCT PORTFOLIO
TABLE 97.OXFORD NANOPORE: COMPANY SNAPSHOT
TABLE 98.OXFORD NANOPORE: PRODUCT PORTFOLIO
TABLE 99.PACBIO: COMPANY SNAPSHOT
TABLE 100.PACBIO: OPERATING SEGMENTS
TABLE 101.PACBIO: PRODUCT PORTFOLIO
TABLE 102.PERKINELMER: COMPANY SNAPSHOT
TABLE 103.PERKINELMER: OPERATING SEGMENTS
TABLE 104.PERKINELMER: PRODUCT PORTFOLIO
TABLE 105.QIAGEN: COMPANY SNAPSHOT
TABLE 106.QIAGEN: OPERATING SEGMENTS
TABLE 107.QIAGEN: PRODUCT PORTFOLIO
TABLE 108.SWIFT BIOSCIENCES: COMPANY SNAPSHOT
TABLE 109.SWIFT BIOSCIENCES: OPERATING SEGMENTS
TABLE 110.SWIFT BIOSCIENCES: PRODUCT PORTFOLIO
TABLE 111.THERMO FISHER SCIENTIFIC: COMPANY SNAPSHOT
TABLE 112.THERMO FISHER SCIENTIFIC: OPERATING SEGMENTS
TABLE 113.THERMO FISHER SCIENTIFIC: PRODUCT PORTFOLIO

LIST OF FIGURES

FIGURE 01.GLOBAL METAGENOMICS SEQUENCING MARKET SEGMENTATION
FIGURE 02.TOP INVESTMENT POCKETS
FIGURE 03.TOP WINNING STRATEGIES PERCENTAGE DISTRIBUTION, 2018–2021
FIGURE 04.TOP WINNING STRATEGIES: BY DEVELOPMENT, 2018-2021 (%)
FIGURE 05.TOP WINNING STRATEGIES: BY COMPANY, 2018-2021 (%)
FIGURE 06.MODERATE BARGAINING POWER OF SUPPLIERS
FIGURE 07.HIGH BARGAINING POWER OF BUYERS
FIGURE 08.LOW THREAT OF SUBSTITUTION
FIGURE 09.MODERATE THREAT OF NEW ENTRANT
FIGURE 10.HIGH COMPETITIVE RIVALRY
FIGURE 11.TOP PLAYER POSITIONING, 2020
FIGURE 12.MARKET DYNAMICS
FIGURE 13.COMPARATIVE ANALYSIS OF METAGENOMICS SEQUENCING MARKET FOR REAGENTS & CONSUMABLES,  BY COUNTRY, 2020 & 2028 (%)
FIGURE 14.COMPARATIVE ANALYSIS OF METAGENOMICS SEQUENCING MARKET FOR INSTRUMENTS, BY COUNTRY,  2020-2028 (%)
FIGURE 15.COMPARATIVE ANALYSIS OF METAGENOMICS SEQUENCING MARKET FOR SERVICES, BY COUNTRY,  2020 & 2028 (%)
FIGURE 16.METAGENOMICS SEQUENCING MARKET FOR ANALYSIS & DATA INTERPRETATION SOLUTIONS, ($MILLION),  2020-2028
FIGURE 17.METAGENOMICS SEQUENCING MARKET FOR METAGENOMIC SEQUENCING SERVICES, 2020 & 2028 (%)
FIGURE 18.COMPARATIVE ANALYSIS OF SHOTGUN METAGENOMICS SEQUENCING MARKET, BY COUNTRY, 2020 & 2028 (%)
FIGURE 19.COMPARATIVE ANALYSIS OF 16S RRNA SEQUENCING MARKET, BY COUNTRY, 2020-2028 (%)
FIGURE 20.COMPARATIVE ANALYSIS OF WHOLE GENOME SEQUENCING & DE NOVO ASSEMBLY METAGENOMICS SEQUENCING MARKET, BY COUNTRY, 2020 & 2028 (%)
FIGURE 21.COMPARATIVE ANALYSIS OF METAGENOMICS SEQUENCING MARKET FOR METATRANSCRIPTOMICS, BY COUNTRY, 2020 & 2028 (%)
FIGURE 22.COMPARATIVE ANALYSIS OF METAGENOMICS SEQUENCING MARKET FOR DRUG DISCOVERY, BY COUNTRY,  2020 & 2028 (%)
FIGURE 23.COMPARATIVE ANALYSIS OF METAGENOMICS SEQUENCING MARKET FOR ECOLOGICAL & ENVIRONMENTAL METAGENOMICS, BY COUNTRY, 2020 &2028 (%)
FIGURE 24.COMPARATIVE ANALYSIS OF METAGENOMICS SEQUENCING MARKET FOR CLINICAL DIAGNOSTICS,  BY COUNTRY, 2020 & 2028 (%)
FIGURE 25.COMPARATIVE ANALYSIS OF METAGENOMICS SEQUENCING MARKET FOR BIOFUEL, BY COUNTRY,  2020 & 2028 (%)
FIGURE 26.COMPARATIVE ANALYSIS OF METAGENOMICS SEQUENCING MARKET FOR INDUSTRIAL APPLICATIONS, BY COUNTRY, 2020 & 2028 (%)
FIGURE 27.EUROFINS: NET SALES, 2018–2020 ($MILLION)
FIGURE 28.EUROFINS REVENUE SHARE BY REGION, 2020 (%)
FIGURE 29.ILLUMINA: NET SALES, 2018–2020 ($MILLION)
FIGURE 30.ILLUMINA: REVENUE SHARE BY SEGMENT, 2020 (%)
FIGURE 31.ILLUMINA: REVENUE SHARE BY GEOGRAPHY, 2020 (%)
FIGURE 32.MACROGEN: NET SALES, 2018–2020 ($MILLION)
FIGURE 33.PACBIO: NET SALES, 2018–2020 ($MILLION)
FIGURE 34.PACBIO: REVENUE SHARE BY SEGMENT, 2020 (%)
FIGURE 35.PACBIO: REVENUE SHARE BY REGION, 2020 (%)
FIGURE 36.PERKINELMER: NET SALES, 2018–2020 ($MILLION)
FIGURE 37.PERKINELMER: REVENUE SHARE BY SEGMENT, 2020 (%)
FIGURE 38.PERKINELMER: REVENUE SHARE BY REGION, 2020 (%)
FIGURE 39.QIAGEN: NET SALES, 2018–2020 ($MILLION)
FIGURE 40.QIAGEN: REVENUE SHARE BY SEGMENT, 2020 (%)
FIGURE 41.QIAGEN: REVENUE SHARE BY REGION, 2020 (%)
FIGURE 42.THERMO FISHER SCIENTIFIC: REVENUE, 2018–2020 ($MILLION)
FIGURE 43.THERMO FISHER SCIENTIFIC: REVENUE SHARE BY SEGMENT, 2020 (%)
FIGURE 44.THERMO FISHER SCIENTIFIC: REVENUE SHARE BY GEOGRAPHY, 2020 (%)


This section provides opinions of the top-level CXOs in the clinical area of the global metagenomics sequencing market. In accordance with several interviews conducted, the utilization of global metagenomics sequencing is expected to witness a significant growth in the forecast period due to increase in prevalence of genetic disorders, and rise in applications of metagenomics sequencing in clinical diagnostic and drug discovery. Increase in interest of healthcare providers and biofuel owing to several benefits offered by metagenomics sequencing is boosting the market. Metagenomics involves direct genetic analysis and it gives information about relative abundance of different organisms and the community structure. While the market is growing at a steady rate in developed nations, the Asia-Pacific and LAMEA regions are expected to offer high growth opportunities to the key players. 

According to the perspectives of CXOs, rise in advancements regarding DNA sequencing and surge in expansion of metagenomics applications drive the market growth. In addition, increase in metagenomics sequencing, advancements in medical technology leading to developments in metagenomics sequencing, significant applications of metagenomics in various fields, initiatives, and funding from government & private bodies for large-scale sequencing projects, and decline in cost of sequencing are the key factors that contribute toward the growth of the market worldwide. The major restraints of this market are ethical issues related to bone grafting and high cost of surgeries. Emerging markets are gaining more importance for majority of the manufacturers and distributors in the global metagenomics sequencing market. The need for improved healthcare services in emerging nations has resulted in a significant growth in shipment of these techniques, and this is expected to offset the challenging conditions in mature markets such as North America and Europe. As per the CXOs, North America dominated the market in 2020, followed by Europe.

PURCHASE OPTIONS

Call or Email us

U.S.-Canada Toll-free: +1-800-792-5285
Int'l : +1-503-894-6022
Europe : +44-845-528-1300
Email : help@alliedmarketresearch.com
 
FREQUENTLY ASKED QUESTIONS?

A. The total market value of global metagenomics sequencing Market is $974.3 million in 2020

A. The forecast period in the report is from 2021 to 2028

A. The market value of global metagenomics sequencing Market in 2020 was $974.3 Million

A. Yes, global metagenomics sequencing companies are profiled in the report

A. The top companies that hold the market share in global metagenomics sequencing Market are BGI Genomics Co., Ltd., Eurofins Genomics, Illumina, Inc., Macrogen Inc., Oxford Nanopore Technologies Ltd, Pacific Biosciences of California, Inc., PerkinElmer Inc., QIAGEN N.V., Swift Biosciences Inc., and Thermo Fisher Scientific Inc.

A. The key trends in the global metagenomics sequencing Market are increase in drug discovery, clinical diagnostics and shotgun sequencing technique in research projects.

Looking for Customization?

 Customization Request

Have a Question?

 Speak with Analyst

Any Confusion?

 Inquire Before Buying

Have a glance of the Report

  Request Sample
RELATED TAGS

Purchase Full Report of
Metagenomics Sequencing Market

Start reading instantly.
This Report and over 68,075+ more Reports, Available with Avenue Library. T&C*.

  • Online Only
  • $3,456
  • Online cloud access only
  • Restricted print, copy, paste & download
  • Read only
  • Free industry update
    (Within 180 days)
  • Free report update in next update cycle
    (Jun 2022 - Jun 2023)
  • Data Pack
  • $3,840
  • Restricted to one authorized user
  • One print only
  • Available in
    Excel
  • Free industry update
    (Within 180 days)
  •   Free report update in next update cycle
    (Jun 2022 - Jun 2023)
  • Single User
  • $5,769
  • Restricted to one authorized user
  • One print only
  • Available in
    PDF
  • Free industry update
    (Within 180 days)
  •   Free report update in next update cycle
    (Jun 2022 - Jun 2023)
  • Five Users
  • $6,450
  • Limited to five authorized users
  • Print upto five copies
  • Available in
    PDF
  • Free industry update
    (Within 180 days)
  •   Free report update in next update cycle
    (Jun 2022 - Jun 2023)
  • Enterprise
    License/PDF

  • $10,995
  • Unlimited
    within
    company/enterprise
  • Available in Excel & PDF
  • Free industry update
    (Within 180 days)
  •   Free report update in next update cycle
    (Jun 2022 - Jun 2023)
  • Library
    Membership

  • $999 $ 1,175
    Per User/ Per month/ Billed annually
  • Published Content
    E-access
  • Company Profiles
    E-access
  • Newly Added Content Access
  • 10 PDF
    Downloads
  • 5 Excel Data
    Pack Downloads
  • 250 Company Profiles PDF Downloads
  • Buy Now

*Taxes/Fees, if applicable will be added during checkout. All prices in USD

RELATED REPORTS
 

Why Allied Market Research?


Infallible Methodology

To ensure high-level data integrity, accurate analysis, and impeccable forecasts

Analyst Support

For complete satisfaction

Customization

On-demand customization of scope of the report to exactly meet your needs

TARGETED MARKET VIEW

Targeted market view to provide pertinent information and save time of readers

Get fresh content delivered

Get insights on topics that are crucial for your business. Stay abreast of your interest areas.

Get Industry Data Alerts

Why Allied Market Research?

Infallible Methodology

To ensure high-level data integrity, accurate analysis, and impeccable forecasts

Analyst Support

For complete satisfaction

Customization

On-demand customization of scope of the report to exactly meet your needs

TARGETED MARKET VIEW

Targeted market view to provide pertinent information and save time of readers