0
2022
Green Data Center Market

Green Data Center Market

by Component (Solution, Services), by Enterprise Size (Large Enterprises, Small and Medium-sized Enterprises), by Industry Vertical (BFSI, IT and Telecom, Media and Entertainment, Healthcare, Government and Defense, Retail, Manufacturing, Others): Global Opportunity Analysis and Industry Forecast, 2021-2031

Report Code: A02150
Oct 2022 | Pages: 345
Tables: 244
Charts: 68
  • Formats*:

  • pdf

    Single User License, Five User
    License & Enterprise User License

  • xls

    Data Pack Excel License

  • ppt

    It comes with the additional cost
    of $2500.00 contact sales.


Green Data Center Market Research, 2031

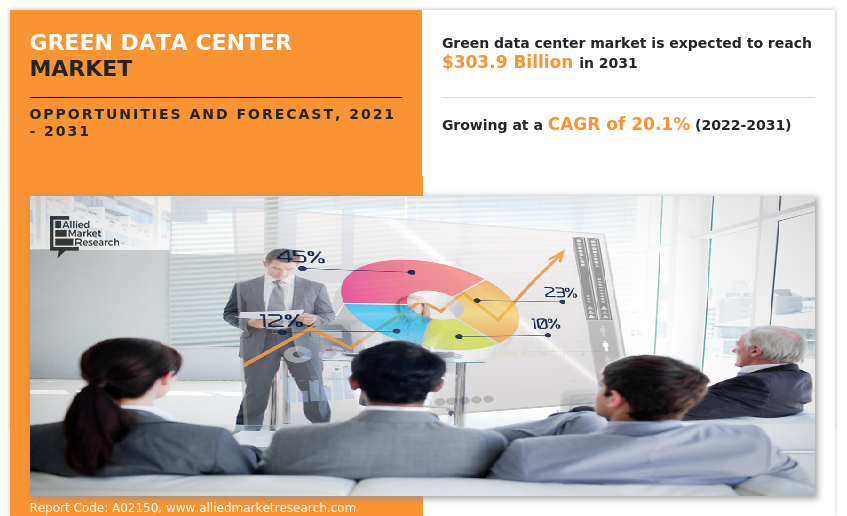
The global green data center market size was valued at $49.7 billion in 2021, and is projected to reach $303.9 billion by 2031, growing at a CAGR of 20.1% from 2022 to 2031.

The green data center market was neutral during COVID-19 pandemic due to shutdown of many businesses and showcased a positive growth rate during the 2021, due to rapid digitalization, in addition to the growing focus on sustainability.

Green Data Centers can be elaborated as data repositories for systems designed for maximizing energy efficiency and minimizing environmental impact. Green data centers used advanced technologies for data storage, management, and operations on the data.

Factors such as surge in penetration of high-end cloud computing in enterprise, rise in green data center complexities due to scalability and surge in the expenditure on green data center technology are key factors driving the Green Data Center market growth. However, rise in concerns related to data privacy and growing demand for managed services hamper market growth. Furthermore, rise in adoption of multi-cloud and network upgrade to support 5G technology provide ample growth opportunities for the green data center industry growth.
Green Data Center Market

The green data center market is segmented into Component, Industry Vertical and Enterprise Size.

Segment review

The green data center market is segmented based on component, enterprise size and industry vertical. On the basis of component, the market is bifurcated into solution and services. By solutions, the market is segmented into power systems, monitoring and management system, networking system, cooling system and others. Depending on services, the market is divided into professional services and managed services. Depending on professional services, the market is further classified into training & education, integration & deployment, and support & maintenance. By organization size, it is categorized into large enterprises and SMEs. By industry vertical, the market is fragmented into BFSI, healthcare, retail, manufacturing, IT & telecom, media & entertainment, government & defense, and others. Region wise, it is analyzed across North America, Europe, Asia-Pacific, and LAMEA.

Some of the major players in the market are ABB LTD, Cyber Power Systems, Dell Technologies Inc., Delta Electronics, Inc., Digital Realty Trust, Inc., Eaton Corporation, Hewlett-Packard, Huawei Technologies, IBM Corporation, NEC Corporation, Nortek Air Solutions, NTT Corporation, Schneider Electric and ZutaCore. These players have adopted various strategies to increase their market penetration and strengthen their position in the industry.

Green Data Center Market

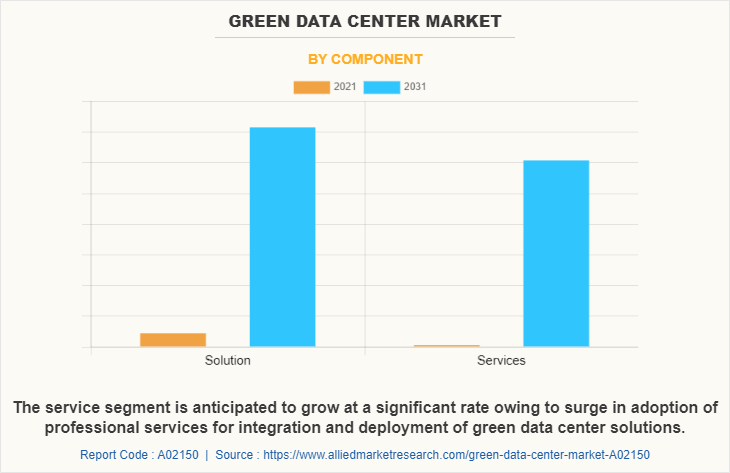
By component, the solutions segment dominated growth of the green data center market in 2021, and is expected to maintain its dominance in the upcoming years due to adoption of various green initiative’s solutions such as power systems and cooling system. However, the services segment is expected to witness highest growth rate during the forecast period due to adoption of green data center services among end users as they ensure effective functioning of solutions and platforms throughout the process.
Green Data Center Market

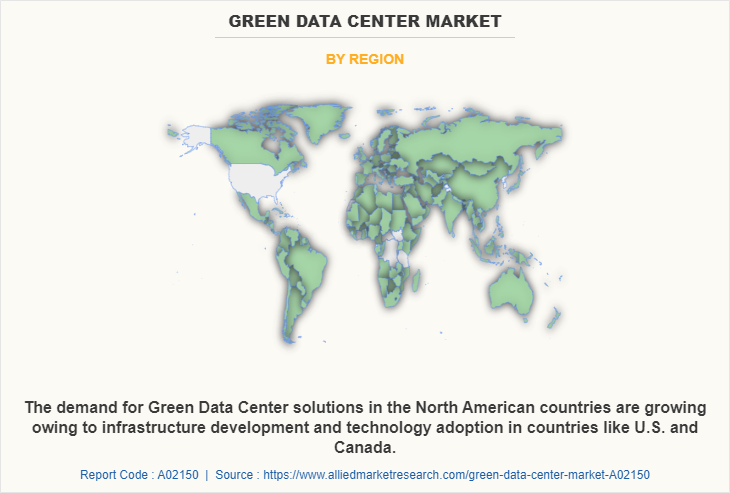
North America dominates the green data center industry. Growth of the market in this region is attributed to several factors such as increase in digitalization and adoption of green data center solutions by the various sectors such as manufacturing, BFSI, and governments. Moreover, presence of key players provides ample growth opportunities for market growth. However, Asia-Pacific is expected to witness highest growth rate during the forecast period due to presence of many SMEs and rise in digital infrastructure in the region.
The report focuses on growth prospects, restraints, and analysis of the global green data center market trends. The study provides Porter’s five forces analysis to understand the impact of various factors, such as bargaining power of suppliers, competitive intensity of competitors, threat of new entrants, threat of substitutes, and bargaining power of buyers on the global green data center market share.

COVID-19 Impact Analysis

The global green data center market has been significantly impacted by the COVID-19 outbreak. Production and manufacturing facilities across the globe have been shut down, owing to the outbreak of the global health crisis and unavailability of workforce. This has further impacted the global economy, and is causing economic hardship for business and communities, globally. Countries across the globe have suffered major loss in terms business and revenue, owing to lockdown and lack of availability of raw material across the world. Production, BFSI, and manufacturing sectors globally have been heavily impacted by the outbreak of the COVID-19 disease, which, in turn, led to economic downfall, thereby declining the growth of the green data center market in 2021.

COVID-19 has enforced the global green data center industry to make short-term decisions with long-term implications. However, the negative impact caused by COVID-19 on global green data center is expected to continue for a short period. Conversely, by mid-2021, the market is anticipated to witness robust recovery due to extensive demand for consumer electronics. In addition, the ongoing pandemic is expected to escalate the need for high-end cloud computing services, which is expected to drive the need for green data center solution

Top Impacting Factors

Rise in green data center complexities due to scalability

Hyperscale green data center solution is based on the concept of distrusted systems and on-demand provision of IT resources, which is intended for organizations to achieve superior performance across IT infrastructure. Modern green data centers are identical with high-speed computational capabilities such as automation, cloud computing capabilities, data storage at scale, and high-end security, which is expected to offer high scalability in addition to flexibility. Moreover, hyper-scale is based on the concept of distributed systems and on-demand provisions of the IT resources designed to operate a large number of servers simultaneously with high speed.

In addition, industries, such as manufacturing, utility, social media, automotive, and retail, have been employing green data center solutions for the rising security data transfer, which forecasts to offer to enhance scalability across green data centers.

Surge in the expenditure on green data center technology

Cloud computing solution has gained high traction across small & medium enterprises and large enterprises, which has led to increase in the adoption of green data center application, as the demand for high-end secure storage solutions is increasing across the globe. For instance, in July 22, 2021, Merlin, a leading entertainment company, announced to invest over $118 billion to develop a 24 MW green data center in Barcelona, Spain. The strategic investment in cloud computing solutions is expected to drive the need for green data center solutions. Further, rise in investment in the green data center is anticipated to act as a prime driver of the market. In addition, the emergence of hybrid cloud technology coupled with state-of-the-art infrastructure is driving the need for reliable private green data center servers. These factors are expected to drive the growth of the global green data center market during the forecast period.

Key Benefits For Stakeholders

  • This report provides a quantitative analysis of the Green Data Center Market Forecast, current trends, estimations, and dynamics of the green data center market analysis from 2021 to 2031 to identify the prevailing green data center market opportunities.
  • The market research is offered along with information related to key drivers, restraints, and opportunities.
  • Porter's five forces analysis highlights the potency of buyers and suppliers to enable stakeholders make profit-oriented business decisions and strengthen their supplier-buyer network.
  • In-depth analysis of the green data center market segmentation assists to determine the prevailing market opportunities.
  • Major countries in each region are mapped according to their revenue contribution to the global market.
  • Market player positioning facilitates benchmarking and provides a clear understanding of the present position of the market players.
  • The report includes the analysis of the regional as well as global green data center market trends, key players, market segments, application areas, and market growth strategies.

Green Data Center Market Report Highlights

Aspects Details
Market Size By 2031 USD 303.9 billion
Growth Rate CAGR of 20.1%
Forecast period 2021 - 2031
Report Pages 345
By Component
  • Solution
    • Solution Type
      • Power Systems
      • Monitoring and Management System
      • Networking System
      • Cooling System
      • Others
  • Services
    • Service Type
      • Professional Service
      • Managed Service
By Industry Vertical
  • BFSI
  • IT and Telecom
  • Media and Entertainment
  • Healthcare
  • Government and Defense
  • Retail
  • Manufacturing
  • Others
By Enterprise Size
  • Large Enterprises
  • Small and Medium-sized Enterprises
By Region
  • North America  (U.S., Canada)
  • Europe  (UK, Germany, France, Italy, Spain, Netherlands, Rest Of Europe)
  • Asia-Pacific  (China, Japan, India, Australia, South Korea, Rest Of Asia-Pacific)
  • LAMEA  (Latin America, Middle East, Africa)
Key Market Players NTT Communications, Schneider Electric, Digital Realty Trust, NEC Corporation, Super Micro, Cyber Power Systems, Cisco, Dell Technologies, Midas Green Technologies, ZutaCore, Huawei Technologies Co. Ltd, ABB Ltd., Delta Electronics, Nortek Air Solutions, Hewlett Packard Enterprise, Eaton Corporation, IBM Corporation
 
  • CHAPTER 1:INTRODUCTION

    • 1.1.Report description

    • 1.2.Key market segments

    • 1.3.Key benefits to the stakeholders

    • 1.4.Research Methodology

      • 1.4.1.Secondary research

      • 1.4.2.Primary research

      • 1.4.3.Analyst tools and models

  • CHAPTER 2:EXECUTIVE SUMMARY

    • 2.1.Key findings of the study

    • 2.2.CXO Perspective

  • CHAPTER 3:MARKET OVERVIEW

    • 3.1.Market definition and scope

    • 3.2.Key findings

      • 3.2.1.Top investment pockets

    • 3.3.Porter’s five forces analysis

    • 3.4.Top player positioning

    • 3.5.Market dynamics

      • 3.5.1.Drivers

      • 3.5.2.Restraints

      • 3.5.3.Opportunities

    • 3.6.COVID-19 Impact Analysis on the market

  • CHAPTER 4: GREEN DATA CENTER MARKET, BY COMPONENT

    • 4.1 Overview

      • 4.1.1 Market size and forecast

    • 4.2 Solution

      • 4.2.1 Key market trends, growth factors and opportunities

      • 4.2.2 Market size and forecast, by region

      • 4.2.3 Market analysis by country

      • 4.2.4 Solution Green Data Center Market by Solution Type

        • 4.2.4.1 Power Systems Market size and forecast, by region
        • 4.2.4.2 Power Systems Market size and forecast, by country
        • 4.2.4.3 Monitoring and Management System Market size and forecast, by region
        • 4.2.4.4 Monitoring and Management System Market size and forecast, by country
        • 4.2.4.5 Networking System Market size and forecast, by region
        • 4.2.4.6 Networking System Market size and forecast, by country
        • 4.2.4.7 Cooling System Market size and forecast, by region
        • 4.2.4.8 Cooling System Market size and forecast, by country
        • 4.2.4.9 Others Market size and forecast, by region
        • 4.2.4.10 Others Market size and forecast, by country
    • 4.3 Services

      • 4.3.1 Key market trends, growth factors and opportunities

      • 4.3.2 Market size and forecast, by region

      • 4.3.3 Market analysis by country

      • 4.3.4 Services Green Data Center Market by Service Type

        • 4.3.4.1 Professional Service Market size and forecast, by region
        • 4.3.4.2 Professional Service Market size and forecast, by country
        • 4.3.4.3 Managed Service Market size and forecast, by region
        • 4.3.4.4 Managed Service Market size and forecast, by country
  • CHAPTER 5: GREEN DATA CENTER MARKET, BY ENTERPRISE SIZE

    • 5.1 Overview

      • 5.1.1 Market size and forecast

    • 5.2 Large Enterprises

      • 5.2.1 Key market trends, growth factors and opportunities

      • 5.2.2 Market size and forecast, by region

      • 5.2.3 Market analysis by country

    • 5.3 Small and Medium-sized Enterprises

      • 5.3.1 Key market trends, growth factors and opportunities

      • 5.3.2 Market size and forecast, by region

      • 5.3.3 Market analysis by country

  • CHAPTER 6: GREEN DATA CENTER MARKET, BY INDUSTRY VERTICAL

    • 6.1 Overview

      • 6.1.1 Market size and forecast

    • 6.2 BFSI

      • 6.2.1 Key market trends, growth factors and opportunities

      • 6.2.2 Market size and forecast, by region

      • 6.2.3 Market analysis by country

    • 6.3 IT and Telecom

      • 6.3.1 Key market trends, growth factors and opportunities

      • 6.3.2 Market size and forecast, by region

      • 6.3.3 Market analysis by country

    • 6.4 Media and Entertainment

      • 6.4.1 Key market trends, growth factors and opportunities

      • 6.4.2 Market size and forecast, by region

      • 6.4.3 Market analysis by country

    • 6.5 Healthcare

      • 6.5.1 Key market trends, growth factors and opportunities

      • 6.5.2 Market size and forecast, by region

      • 6.5.3 Market analysis by country

    • 6.6 Government and Defense

      • 6.6.1 Key market trends, growth factors and opportunities

      • 6.6.2 Market size and forecast, by region

      • 6.6.3 Market analysis by country

    • 6.7 Retail

      • 6.7.1 Key market trends, growth factors and opportunities

      • 6.7.2 Market size and forecast, by region

      • 6.7.3 Market analysis by country

    • 6.8 Manufacturing

      • 6.8.1 Key market trends, growth factors and opportunities

      • 6.8.2 Market size and forecast, by region

      • 6.8.3 Market analysis by country

    • 6.9 Others

      • 6.9.1 Key market trends, growth factors and opportunities

      • 6.9.2 Market size and forecast, by region

      • 6.9.3 Market analysis by country

  • CHAPTER 7: GREEN DATA CENTER MARKET, BY REGION

    • 7.1 Overview

      • 7.1.1 Market size and forecast

    • 7.2 North America

      • 7.2.1 Key trends and opportunities

      • 7.2.2 North America Market size and forecast, by Component

        • 7.2.2.1 North America Solution Green Data Center Market by Solution Type
        • 7.2.2.2 North America Services Green Data Center Market by Service Type
      • 7.2.3 North America Market size and forecast, by Enterprise Size

      • 7.2.4 North America Market size and forecast, by Industry Vertical

      • 7.2.5 North America Market size and forecast, by country

        • 7.2.5.1 U.S.
          • 7.2.5.1.1 Market size and forecast, by Component
            • 7.2.5.1.1.1 U.S. Solution Green Data Center Market by Solution Type
            • 7.2.5.1.1.2 U.S. Services Green Data Center Market by Service Type
          • 7.2.5.1.2 Market size and forecast, by Enterprise Size
          • 7.2.5.1.3 Market size and forecast, by Industry Vertical
        • 7.2.5.2 Canada
          • 7.2.5.2.1 Market size and forecast, by Component
            • 7.2.5.2.1.1 Canada Solution Green Data Center Market by Solution Type
            • 7.2.5.2.1.2 Canada Services Green Data Center Market by Service Type
          • 7.2.5.2.2 Market size and forecast, by Enterprise Size
          • 7.2.5.2.3 Market size and forecast, by Industry Vertical
    • 7.3 Europe

      • 7.3.1 Key trends and opportunities

      • 7.3.2 Europe Market size and forecast, by Component

        • 7.3.2.1 Europe Solution Green Data Center Market by Solution Type
        • 7.3.2.2 Europe Services Green Data Center Market by Service Type
      • 7.3.3 Europe Market size and forecast, by Enterprise Size

      • 7.3.4 Europe Market size and forecast, by Industry Vertical

      • 7.3.5 Europe Market size and forecast, by country

        • 7.3.5.1 UK
          • 7.3.5.1.1 Market size and forecast, by Component
            • 7.3.5.1.1.1 UK Solution Green Data Center Market by Solution Type
            • 7.3.5.1.1.2 UK Services Green Data Center Market by Service Type
          • 7.3.5.1.2 Market size and forecast, by Enterprise Size
          • 7.3.5.1.3 Market size and forecast, by Industry Vertical
        • 7.3.5.2 Germany
          • 7.3.5.2.1 Market size and forecast, by Component
            • 7.3.5.2.1.1 Germany Solution Green Data Center Market by Solution Type
            • 7.3.5.2.1.2 Germany Services Green Data Center Market by Service Type
          • 7.3.5.2.2 Market size and forecast, by Enterprise Size
          • 7.3.5.2.3 Market size and forecast, by Industry Vertical
        • 7.3.5.3 France
          • 7.3.5.3.1 Market size and forecast, by Component
            • 7.3.5.3.1.1 France Solution Green Data Center Market by Solution Type
            • 7.3.5.3.1.2 France Services Green Data Center Market by Service Type
          • 7.3.5.3.2 Market size and forecast, by Enterprise Size
          • 7.3.5.3.3 Market size and forecast, by Industry Vertical
        • 7.3.5.4 Italy
          • 7.3.5.4.1 Market size and forecast, by Component
            • 7.3.5.4.1.1 Italy Solution Green Data Center Market by Solution Type
            • 7.3.5.4.1.2 Italy Services Green Data Center Market by Service Type
          • 7.3.5.4.2 Market size and forecast, by Enterprise Size
          • 7.3.5.4.3 Market size and forecast, by Industry Vertical
        • 7.3.5.5 Spain
          • 7.3.5.5.1 Market size and forecast, by Component
            • 7.3.5.5.1.1 Spain Solution Green Data Center Market by Solution Type
            • 7.3.5.5.1.2 Spain Services Green Data Center Market by Service Type
          • 7.3.5.5.2 Market size and forecast, by Enterprise Size
          • 7.3.5.5.3 Market size and forecast, by Industry Vertical
        • 7.3.5.6 Netherlands
          • 7.3.5.6.1 Market size and forecast, by Component
            • 7.3.5.6.1.1 Netherlands Solution Green Data Center Market by Solution Type
            • 7.3.5.6.1.2 Netherlands Services Green Data Center Market by Service Type
          • 7.3.5.6.2 Market size and forecast, by Enterprise Size
          • 7.3.5.6.3 Market size and forecast, by Industry Vertical
        • 7.3.5.7 Rest of Europe
          • 7.3.5.7.1 Market size and forecast, by Component
            • 7.3.5.7.1.1 Rest of Europe Solution Green Data Center Market by Solution Type
            • 7.3.5.7.1.2 Rest of Europe Services Green Data Center Market by Service Type
          • 7.3.5.7.2 Market size and forecast, by Enterprise Size
          • 7.3.5.7.3 Market size and forecast, by Industry Vertical
    • 7.4 Asia-Pacific

      • 7.4.1 Key trends and opportunities

      • 7.4.2 Asia-Pacific Market size and forecast, by Component

        • 7.4.2.1 Asia-Pacific Solution Green Data Center Market by Solution Type
        • 7.4.2.2 Asia-Pacific Services Green Data Center Market by Service Type
      • 7.4.3 Asia-Pacific Market size and forecast, by Enterprise Size

      • 7.4.4 Asia-Pacific Market size and forecast, by Industry Vertical

      • 7.4.5 Asia-Pacific Market size and forecast, by country

        • 7.4.5.1 China
          • 7.4.5.1.1 Market size and forecast, by Component
            • 7.4.5.1.1.1 China Solution Green Data Center Market by Solution Type
            • 7.4.5.1.1.2 China Services Green Data Center Market by Service Type
          • 7.4.5.1.2 Market size and forecast, by Enterprise Size
          • 7.4.5.1.3 Market size and forecast, by Industry Vertical
        • 7.4.5.2 Japan
          • 7.4.5.2.1 Market size and forecast, by Component
            • 7.4.5.2.1.1 Japan Solution Green Data Center Market by Solution Type
            • 7.4.5.2.1.2 Japan Services Green Data Center Market by Service Type
          • 7.4.5.2.2 Market size and forecast, by Enterprise Size
          • 7.4.5.2.3 Market size and forecast, by Industry Vertical
        • 7.4.5.3 India
          • 7.4.5.3.1 Market size and forecast, by Component
            • 7.4.5.3.1.1 India Solution Green Data Center Market by Solution Type
            • 7.4.5.3.1.2 India Services Green Data Center Market by Service Type
          • 7.4.5.3.2 Market size and forecast, by Enterprise Size
          • 7.4.5.3.3 Market size and forecast, by Industry Vertical
        • 7.4.5.4 Australia
          • 7.4.5.4.1 Market size and forecast, by Component
            • 7.4.5.4.1.1 Australia Solution Green Data Center Market by Solution Type
            • 7.4.5.4.1.2 Australia Services Green Data Center Market by Service Type
          • 7.4.5.4.2 Market size and forecast, by Enterprise Size
          • 7.4.5.4.3 Market size and forecast, by Industry Vertical
        • 7.4.5.5 South Korea
          • 7.4.5.5.1 Market size and forecast, by Component
            • 7.4.5.5.1.1 South Korea Solution Green Data Center Market by Solution Type
            • 7.4.5.5.1.2 South Korea Services Green Data Center Market by Service Type
          • 7.4.5.5.2 Market size and forecast, by Enterprise Size
          • 7.4.5.5.3 Market size and forecast, by Industry Vertical
        • 7.4.5.6 Rest of Asia-Pacific
          • 7.4.5.6.1 Market size and forecast, by Component
            • 7.4.5.6.1.1 Rest of Asia-Pacific Solution Green Data Center Market by Solution Type
            • 7.4.5.6.1.2 Rest of Asia-Pacific Services Green Data Center Market by Service Type
          • 7.4.5.6.2 Market size and forecast, by Enterprise Size
          • 7.4.5.6.3 Market size and forecast, by Industry Vertical
    • 7.5 LAMEA

      • 7.5.1 Key trends and opportunities

      • 7.5.2 LAMEA Market size and forecast, by Component

        • 7.5.2.1 LAMEA Solution Green Data Center Market by Solution Type
        • 7.5.2.2 LAMEA Services Green Data Center Market by Service Type
      • 7.5.3 LAMEA Market size and forecast, by Enterprise Size

      • 7.5.4 LAMEA Market size and forecast, by Industry Vertical

      • 7.5.5 LAMEA Market size and forecast, by country

        • 7.5.5.1 Latin America
          • 7.5.5.1.1 Market size and forecast, by Component
            • 7.5.5.1.1.1 Latin America Solution Green Data Center Market by Solution Type
            • 7.5.5.1.1.2 Latin America Services Green Data Center Market by Service Type
          • 7.5.5.1.2 Market size and forecast, by Enterprise Size
          • 7.5.5.1.3 Market size and forecast, by Industry Vertical
        • 7.5.5.2 Middle East
          • 7.5.5.2.1 Market size and forecast, by Component
            • 7.5.5.2.1.1 Middle East Solution Green Data Center Market by Solution Type
            • 7.5.5.2.1.2 Middle East Services Green Data Center Market by Service Type
          • 7.5.5.2.2 Market size and forecast, by Enterprise Size
          • 7.5.5.2.3 Market size and forecast, by Industry Vertical
        • 7.5.5.3 Africa
          • 7.5.5.3.1 Market size and forecast, by Component
            • 7.5.5.3.1.1 Africa Solution Green Data Center Market by Solution Type
            • 7.5.5.3.1.2 Africa Services Green Data Center Market by Service Type
          • 7.5.5.3.2 Market size and forecast, by Enterprise Size
          • 7.5.5.3.3 Market size and forecast, by Industry Vertical
  • CHAPTER 8: COMPANY LANDSCAPE

    • 8.1. Introduction

    • 8.2. Top winning strategies

    • 8.3. Product Mapping of Top 10 Player

    • 8.4. Competitive Dashboard

    • 8.5. Competitive Heatmap

    • 8.6. Key developments

  • CHAPTER 9: COMPANY PROFILES

    • 9.1 ABB Ltd.

      • 9.1.1 Company overview

      • 9.1.2 Company snapshot

      • 9.1.3 Operating business segments

      • 9.1.4 Product portfolio

      • 9.1.5 Business performance

      • 9.1.6 Key strategic moves and developments

    • 9.2 Cisco

      • 9.2.1 Company overview

      • 9.2.2 Company snapshot

      • 9.2.3 Operating business segments

      • 9.2.4 Product portfolio

      • 9.2.5 Business performance

      • 9.2.6 Key strategic moves and developments

    • 9.3 Cyber Power Systems

      • 9.3.1 Company overview

      • 9.3.2 Company snapshot

      • 9.3.3 Operating business segments

      • 9.3.4 Product portfolio

      • 9.3.5 Business performance

      • 9.3.6 Key strategic moves and developments

    • 9.4 Dell Technologies

      • 9.4.1 Company overview

      • 9.4.2 Company snapshot

      • 9.4.3 Operating business segments

      • 9.4.4 Product portfolio

      • 9.4.5 Business performance

      • 9.4.6 Key strategic moves and developments

    • 9.5 Delta Electronics

      • 9.5.1 Company overview

      • 9.5.2 Company snapshot

      • 9.5.3 Operating business segments

      • 9.5.4 Product portfolio

      • 9.5.5 Business performance

      • 9.5.6 Key strategic moves and developments

    • 9.6 Digital Realty Trust

      • 9.6.1 Company overview

      • 9.6.2 Company snapshot

      • 9.6.3 Operating business segments

      • 9.6.4 Product portfolio

      • 9.6.5 Business performance

      • 9.6.6 Key strategic moves and developments

    • 9.7 Eaton Corporation

      • 9.7.1 Company overview

      • 9.7.2 Company snapshot

      • 9.7.3 Operating business segments

      • 9.7.4 Product portfolio

      • 9.7.5 Business performance

      • 9.7.6 Key strategic moves and developments

    • 9.8 Hewlett Packard Enterprise

      • 9.8.1 Company overview

      • 9.8.2 Company snapshot

      • 9.8.3 Operating business segments

      • 9.8.4 Product portfolio

      • 9.8.5 Business performance

      • 9.8.6 Key strategic moves and developments

    • 9.9 Huawei Technologies Co. Ltd

      • 9.9.1 Company overview

      • 9.9.2 Company snapshot

      • 9.9.3 Operating business segments

      • 9.9.4 Product portfolio

      • 9.9.5 Business performance

      • 9.9.6 Key strategic moves and developments

    • 9.10 IBM Corporation

      • 9.10.1 Company overview

      • 9.10.2 Company snapshot

      • 9.10.3 Operating business segments

      • 9.10.4 Product portfolio

      • 9.10.5 Business performance

      • 9.10.6 Key strategic moves and developments

    • 9.11 Midas Green Technologies

      • 9.11.1 Company overview

      • 9.11.2 Company snapshot

      • 9.11.3 Operating business segments

      • 9.11.4 Product portfolio

      • 9.11.5 Business performance

      • 9.11.6 Key strategic moves and developments

    • 9.12 NEC Corporation

      • 9.12.1 Company overview

      • 9.12.2 Company snapshot

      • 9.12.3 Operating business segments

      • 9.12.4 Product portfolio

      • 9.12.5 Business performance

      • 9.12.6 Key strategic moves and developments

    • 9.13 Nortek Air Solutions

      • 9.13.1 Company overview

      • 9.13.2 Company snapshot

      • 9.13.3 Operating business segments

      • 9.13.4 Product portfolio

      • 9.13.5 Business performance

      • 9.13.6 Key strategic moves and developments

    • 9.14 NTT Communications

      • 9.14.1 Company overview

      • 9.14.2 Company snapshot

      • 9.14.3 Operating business segments

      • 9.14.4 Product portfolio

      • 9.14.5 Business performance

      • 9.14.6 Key strategic moves and developments

    • 9.15 Schneider Electric

      • 9.15.1 Company overview

      • 9.15.2 Company snapshot

      • 9.15.3 Operating business segments

      • 9.15.4 Product portfolio

      • 9.15.5 Business performance

      • 9.15.6 Key strategic moves and developments

    • 9.16 Super Micro

      • 9.16.1 Company overview

      • 9.16.2 Company snapshot

      • 9.16.3 Operating business segments

      • 9.16.4 Product portfolio

      • 9.16.5 Business performance

      • 9.16.6 Key strategic moves and developments

    • 9.17 ZutaCore

      • 9.17.1 Company overview

      • 9.17.2 Company snapshot

      • 9.17.3 Operating business segments

      • 9.17.4 Product portfolio

      • 9.17.5 Business performance

      • 9.17.6 Key strategic moves and developments

  • LIST OF TABLES

  • TABLE 1. GLOBAL GREEN DATA CENTER MARKET, BY COMPONENT, 2021-2031 ($MILLION)
    TABLE 2. GREEN DATA CENTER MARKET, FOR SOLUTION, BY REGION, 2021-2031 ($MILLION)
    TABLE 3. GREEN DATA CENTER MARKET FOR SOLUTION, BY COUNTRY, 2021-2031 ($MILLION)
    TABLE 4. GLOBAL SOLUTION GREEN DATA CENTER MARKET, BY SOLUTION TYPE, 2021-2031 ($MILLION)
    TABLE 5. GREEN DATA CENTER MARKET, FOR POWER SYSTEMS, BY REGION, 2021-2031 ($MILLION)
    TABLE 6. GREEN DATA CENTER MARKET, FOR POWER SYSTEMS, BY COUNTRY, 2021-2031 ($MILLION)
    TABLE 7. GREEN DATA CENTER MARKET, FOR MONITORING AND MANAGEMENT SYSTEM, BY REGION, 2021-2031 ($MILLION)
    TABLE 8. GREEN DATA CENTER MARKET, FOR MONITORING AND MANAGEMENT SYSTEM, BY COUNTRY, 2021-2031 ($MILLION)
    TABLE 9. GREEN DATA CENTER MARKET, FOR NETWORKING SYSTEM, BY REGION, 2021-2031 ($MILLION)
    TABLE 10. GREEN DATA CENTER MARKET, FOR NETWORKING SYSTEM, BY COUNTRY, 2021-2031 ($MILLION)
    TABLE 11. GREEN DATA CENTER MARKET, FOR COOLING SYSTEM, BY REGION, 2021-2031 ($MILLION)
    TABLE 12. GREEN DATA CENTER MARKET, FOR COOLING SYSTEM, BY COUNTRY, 2021-2031 ($MILLION)
    TABLE 13. GREEN DATA CENTER MARKET, FOR OTHERS, BY REGION, 2021-2031 ($MILLION)
    TABLE 14. GREEN DATA CENTER MARKET, FOR OTHERS, BY COUNTRY, 2021-2031 ($MILLION)
    TABLE 15. GREEN DATA CENTER MARKET, FOR SERVICES, BY REGION, 2021-2031 ($MILLION)
    TABLE 16. GREEN DATA CENTER MARKET FOR SERVICES, BY COUNTRY, 2021-2031 ($MILLION)
    TABLE 17. GLOBAL SERVICES GREEN DATA CENTER MARKET, BY SERVICE TYPE, 2021-2031 ($MILLION)
    TABLE 18. GREEN DATA CENTER MARKET, FOR PROFESSIONAL SERVICE, BY REGION, 2021-2031 ($MILLION)
    TABLE 19. GREEN DATA CENTER MARKET, FOR PROFESSIONAL SERVICE, BY COUNTRY, 2021-2031 ($MILLION)
    TABLE 20. GREEN DATA CENTER MARKET, FOR MANAGED SERVICE, BY REGION, 2021-2031 ($MILLION)
    TABLE 21. GREEN DATA CENTER MARKET, FOR MANAGED SERVICE, BY COUNTRY, 2021-2031 ($MILLION)
    TABLE 22. GLOBAL GREEN DATA CENTER MARKET, BY ENTERPRISE SIZE, 2021-2031 ($MILLION)
    TABLE 23. GREEN DATA CENTER MARKET, FOR LARGE ENTERPRISES, BY REGION, 2021-2031 ($MILLION)
    TABLE 24. GREEN DATA CENTER MARKET FOR LARGE ENTERPRISES, BY COUNTRY, 2021-2031 ($MILLION)
    TABLE 25. GREEN DATA CENTER MARKET, FOR SMALL AND MEDIUM-SIZED ENTERPRISES, BY REGION, 2021-2031 ($MILLION)
    TABLE 26. GREEN DATA CENTER MARKET FOR SMALL AND MEDIUM-SIZED ENTERPRISES, BY COUNTRY, 2021-2031 ($MILLION)
    TABLE 27. GLOBAL GREEN DATA CENTER MARKET, BY INDUSTRY VERTICAL, 2021-2031 ($MILLION)
    TABLE 28. GREEN DATA CENTER MARKET, FOR BFSI, BY REGION, 2021-2031 ($MILLION)
    TABLE 29. GREEN DATA CENTER MARKET FOR BFSI, BY COUNTRY, 2021-2031 ($MILLION)
    TABLE 30. GREEN DATA CENTER MARKET, FOR IT AND TELECOM, BY REGION, 2021-2031 ($MILLION)
    TABLE 31. GREEN DATA CENTER MARKET FOR IT AND TELECOM, BY COUNTRY, 2021-2031 ($MILLION)
    TABLE 32. GREEN DATA CENTER MARKET, FOR MEDIA AND ENTERTAINMENT, BY REGION, 2021-2031 ($MILLION)
    TABLE 33. GREEN DATA CENTER MARKET FOR MEDIA AND ENTERTAINMENT, BY COUNTRY, 2021-2031 ($MILLION)
    TABLE 34. GREEN DATA CENTER MARKET, FOR HEALTHCARE, BY REGION, 2021-2031 ($MILLION)
    TABLE 35. GREEN DATA CENTER MARKET FOR HEALTHCARE, BY COUNTRY, 2021-2031 ($MILLION)
    TABLE 36. GREEN DATA CENTER MARKET, FOR GOVERNMENT AND DEFENSE, BY REGION, 2021-2031 ($MILLION)
    TABLE 37. GREEN DATA CENTER MARKET FOR GOVERNMENT AND DEFENSE, BY COUNTRY, 2021-2031 ($MILLION)
    TABLE 38. GREEN DATA CENTER MARKET, FOR RETAIL, BY REGION, 2021-2031 ($MILLION)
    TABLE 39. GREEN DATA CENTER MARKET FOR RETAIL, BY COUNTRY, 2021-2031 ($MILLION)
    TABLE 40. GREEN DATA CENTER MARKET, FOR MANUFACTURING, BY REGION, 2021-2031 ($MILLION)
    TABLE 41. GREEN DATA CENTER MARKET FOR MANUFACTURING, BY COUNTRY, 2021-2031 ($MILLION)
    TABLE 42. GREEN DATA CENTER MARKET, FOR OTHERS, BY REGION, 2021-2031 ($MILLION)
    TABLE 43. GREEN DATA CENTER MARKET FOR OTHERS, BY COUNTRY, 2021-2031 ($MILLION)
    TABLE 44. GREEN DATA CENTER MARKET, BY REGION, 2021-2031 ($MILLION)
    TABLE 45. NORTH AMERICA GREEN DATA CENTER MARKET, BY COMPONENT, 2021-2031 ($MILLION)
    TABLE 46. NORTH AMERICA SOLUTION GREEN DATA CENTER MARKET, BY SOLUTION TYPE, 2021-2031 ($MILLION)
    TABLE 47. NORTH AMERICA SERVICES GREEN DATA CENTER MARKET, BY SERVICE TYPE, 2021-2031 ($MILLION)
    TABLE 48. NORTH AMERICA GREEN DATA CENTER MARKET, BY ENTERPRISE SIZE, 2021-2031 ($MILLION)
    TABLE 49. NORTH AMERICA GREEN DATA CENTER MARKET, BY INDUSTRY VERTICAL, 2021-2031 ($MILLION)
    TABLE 50. NORTH AMERICA GREEN DATA CENTER MARKET, BY COUNTRY, 2021-2031 ($MILLION)
    TABLE 51. U.S. GREEN DATA CENTER MARKET, BY COMPONENT, 2021-2031 ($MILLION)
    TABLE 52. U.S. SOLUTION GREEN DATA CENTER MARKET, BY SOLUTION TYPE, 2021-2031 ($MILLION)
    TABLE 53. U.S. SERVICES GREEN DATA CENTER MARKET, BY SERVICE TYPE, 2021-2031 ($MILLION)
    TABLE 54. U.S. GREEN DATA CENTER MARKET, BY ENTERPRISE SIZE, 2021-2031 ($MILLION)
    TABLE 55. U.S. GREEN DATA CENTER MARKET, BY INDUSTRY VERTICAL, 2021-2031 ($MILLION)
    TABLE 56. CANADA GREEN DATA CENTER MARKET, BY COMPONENT, 2021-2031 ($MILLION)
    TABLE 57. CANADA SOLUTION GREEN DATA CENTER MARKET, BY SOLUTION TYPE, 2021-2031 ($MILLION)
    TABLE 58. CANADA SERVICES GREEN DATA CENTER MARKET, BY SERVICE TYPE, 2021-2031 ($MILLION)
    TABLE 59. CANADA GREEN DATA CENTER MARKET, BY ENTERPRISE SIZE, 2021-2031 ($MILLION)
    TABLE 60. CANADA GREEN DATA CENTER MARKET, BY INDUSTRY VERTICAL, 2021-2031 ($MILLION)
    TABLE 61. EUROPE GREEN DATA CENTER MARKET, BY COMPONENT, 2021-2031 ($MILLION)
    TABLE 62. EUROPE SOLUTION GREEN DATA CENTER MARKET, BY SOLUTION TYPE, 2021-2031 ($MILLION)
    TABLE 63. EUROPE SERVICES GREEN DATA CENTER MARKET, BY SERVICE TYPE, 2021-2031 ($MILLION)
    TABLE 64. EUROPE GREEN DATA CENTER MARKET, BY ENTERPRISE SIZE, 2021-2031 ($MILLION)
    TABLE 65. EUROPE GREEN DATA CENTER MARKET, BY INDUSTRY VERTICAL, 2021-2031 ($MILLION)
    TABLE 66. EUROPE GREEN DATA CENTER MARKET, BY COUNTRY, 2021-2031 ($MILLION)
    TABLE 67. UK GREEN DATA CENTER MARKET, BY COMPONENT, 2021-2031 ($MILLION)
    TABLE 68. UK SOLUTION GREEN DATA CENTER MARKET, BY SOLUTION TYPE, 2021-2031 ($MILLION)
    TABLE 69. UK SERVICES GREEN DATA CENTER MARKET, BY SERVICE TYPE, 2021-2031 ($MILLION)
    TABLE 70. UK GREEN DATA CENTER MARKET, BY ENTERPRISE SIZE, 2021-2031 ($MILLION)
    TABLE 71. UK GREEN DATA CENTER MARKET, BY INDUSTRY VERTICAL, 2021-2031 ($MILLION)
    TABLE 72. GERMANY GREEN DATA CENTER MARKET, BY COMPONENT, 2021-2031 ($MILLION)
    TABLE 73. GERMANY SOLUTION GREEN DATA CENTER MARKET, BY SOLUTION TYPE, 2021-2031 ($MILLION)
    TABLE 74. GERMANY SERVICES GREEN DATA CENTER MARKET, BY SERVICE TYPE, 2021-2031 ($MILLION)
    TABLE 75. GERMANY GREEN DATA CENTER MARKET, BY ENTERPRISE SIZE, 2021-2031 ($MILLION)
    TABLE 76. GERMANY GREEN DATA CENTER MARKET, BY INDUSTRY VERTICAL, 2021-2031 ($MILLION)
    TABLE 77. FRANCE GREEN DATA CENTER MARKET, BY COMPONENT, 2021-2031 ($MILLION)
    TABLE 78. FRANCE SOLUTION GREEN DATA CENTER MARKET, BY SOLUTION TYPE, 2021-2031 ($MILLION)
    TABLE 79. FRANCE SERVICES GREEN DATA CENTER MARKET, BY SERVICE TYPE, 2021-2031 ($MILLION)
    TABLE 80. FRANCE GREEN DATA CENTER MARKET, BY ENTERPRISE SIZE, 2021-2031 ($MILLION)
    TABLE 81. FRANCE GREEN DATA CENTER MARKET, BY INDUSTRY VERTICAL, 2021-2031 ($MILLION)
    TABLE 82. ITALY GREEN DATA CENTER MARKET, BY COMPONENT, 2021-2031 ($MILLION)
    TABLE 83. ITALY SOLUTION GREEN DATA CENTER MARKET, BY SOLUTION TYPE, 2021-2031 ($MILLION)
    TABLE 84. ITALY SERVICES GREEN DATA CENTER MARKET, BY SERVICE TYPE, 2021-2031 ($MILLION)
    TABLE 85. ITALY GREEN DATA CENTER MARKET, BY ENTERPRISE SIZE, 2021-2031 ($MILLION)
    TABLE 86. ITALY GREEN DATA CENTER MARKET, BY INDUSTRY VERTICAL, 2021-2031 ($MILLION)
    TABLE 87. SPAIN GREEN DATA CENTER MARKET, BY COMPONENT, 2021-2031 ($MILLION)
    TABLE 88. SPAIN SOLUTION GREEN DATA CENTER MARKET, BY SOLUTION TYPE, 2021-2031 ($MILLION)
    TABLE 89. SPAIN SERVICES GREEN DATA CENTER MARKET, BY SERVICE TYPE, 2021-2031 ($MILLION)
    TABLE 90. SPAIN GREEN DATA CENTER MARKET, BY ENTERPRISE SIZE, 2021-2031 ($MILLION)
    TABLE 91. SPAIN GREEN DATA CENTER MARKET, BY INDUSTRY VERTICAL, 2021-2031 ($MILLION)
    TABLE 92. NETHERLANDS GREEN DATA CENTER MARKET, BY COMPONENT, 2021-2031 ($MILLION)
    TABLE 93. NETHERLANDS SOLUTION GREEN DATA CENTER MARKET, BY SOLUTION TYPE, 2021-2031 ($MILLION)
    TABLE 94. NETHERLANDS SERVICES GREEN DATA CENTER MARKET, BY SERVICE TYPE, 2021-2031 ($MILLION)
    TABLE 95. NETHERLANDS GREEN DATA CENTER MARKET, BY ENTERPRISE SIZE, 2021-2031 ($MILLION)
    TABLE 96. NETHERLANDS GREEN DATA CENTER MARKET, BY INDUSTRY VERTICAL, 2021-2031 ($MILLION)
    TABLE 97. REST OF EUROPE GREEN DATA CENTER MARKET, BY COMPONENT, 2021-2031 ($MILLION)
    TABLE 98. REST OF EUROPE SOLUTION GREEN DATA CENTER MARKET, BY SOLUTION TYPE, 2021-2031 ($MILLION)
    TABLE 99. REST OF EUROPE SERVICES GREEN DATA CENTER MARKET, BY SERVICE TYPE, 2021-2031 ($MILLION)
    TABLE 100. REST OF EUROPE GREEN DATA CENTER MARKET, BY ENTERPRISE SIZE, 2021-2031 ($MILLION)
    TABLE 101. REST OF EUROPE GREEN DATA CENTER MARKET, BY INDUSTRY VERTICAL, 2021-2031 ($MILLION)
    TABLE 102. ASIA-PACIFIC GREEN DATA CENTER MARKET, BY COMPONENT, 2021-2031 ($MILLION)
    TABLE 103. ASIA-PACIFIC SOLUTION GREEN DATA CENTER MARKET, BY SOLUTION TYPE, 2021-2031 ($MILLION)
    TABLE 104. ASIA-PACIFIC SERVICES GREEN DATA CENTER MARKET, BY SERVICE TYPE, 2021-2031 ($MILLION)
    TABLE 105. ASIA-PACIFIC GREEN DATA CENTER MARKET, BY ENTERPRISE SIZE, 2021-2031 ($MILLION)
    TABLE 106. ASIA-PACIFIC GREEN DATA CENTER MARKET, BY INDUSTRY VERTICAL, 2021-2031 ($MILLION)
    TABLE 107. ASIA-PACIFIC GREEN DATA CENTER MARKET, BY COUNTRY, 2021-2031 ($MILLION)
    TABLE 108. CHINA GREEN DATA CENTER MARKET, BY COMPONENT, 2021-2031 ($MILLION)
    TABLE 109. CHINA SOLUTION GREEN DATA CENTER MARKET, BY SOLUTION TYPE, 2021-2031 ($MILLION)
    TABLE 110. CHINA SERVICES GREEN DATA CENTER MARKET, BY SERVICE TYPE, 2021-2031 ($MILLION)
    TABLE 111. CHINA GREEN DATA CENTER MARKET, BY ENTERPRISE SIZE, 2021-2031 ($MILLION)
    TABLE 112. CHINA GREEN DATA CENTER MARKET, BY INDUSTRY VERTICAL, 2021-2031 ($MILLION)
    TABLE 113. JAPAN GREEN DATA CENTER MARKET, BY COMPONENT, 2021-2031 ($MILLION)
    TABLE 114. JAPAN SOLUTION GREEN DATA CENTER MARKET, BY SOLUTION TYPE, 2021-2031 ($MILLION)
    TABLE 115. JAPAN SERVICES GREEN DATA CENTER MARKET, BY SERVICE TYPE, 2021-2031 ($MILLION)
    TABLE 116. JAPAN GREEN DATA CENTER MARKET, BY ENTERPRISE SIZE, 2021-2031 ($MILLION)
    TABLE 117. JAPAN GREEN DATA CENTER MARKET, BY INDUSTRY VERTICAL, 2021-2031 ($MILLION)
    TABLE 118. INDIA GREEN DATA CENTER MARKET, BY COMPONENT, 2021-2031 ($MILLION)
    TABLE 119. INDIA SOLUTION GREEN DATA CENTER MARKET, BY SOLUTION TYPE, 2021-2031 ($MILLION)
    TABLE 120. INDIA SERVICES GREEN DATA CENTER MARKET, BY SERVICE TYPE, 2021-2031 ($MILLION)
    TABLE 121. INDIA GREEN DATA CENTER MARKET, BY ENTERPRISE SIZE, 2021-2031 ($MILLION)
    TABLE 122. INDIA GREEN DATA CENTER MARKET, BY INDUSTRY VERTICAL, 2021-2031 ($MILLION)
    TABLE 123. AUSTRALIA GREEN DATA CENTER MARKET, BY COMPONENT, 2021-2031 ($MILLION)
    TABLE 124. AUSTRALIA SOLUTION GREEN DATA CENTER MARKET, BY SOLUTION TYPE, 2021-2031 ($MILLION)
    TABLE 125. AUSTRALIA SERVICES GREEN DATA CENTER MARKET, BY SERVICE TYPE, 2021-2031 ($MILLION)
    TABLE 126. AUSTRALIA GREEN DATA CENTER MARKET, BY ENTERPRISE SIZE, 2021-2031 ($MILLION)
    TABLE 127. AUSTRALIA GREEN DATA CENTER MARKET, BY INDUSTRY VERTICAL, 2021-2031 ($MILLION)
    TABLE 128. SOUTH KOREA GREEN DATA CENTER MARKET, BY COMPONENT, 2021-2031 ($MILLION)
    TABLE 129. SOUTH KOREA SOLUTION GREEN DATA CENTER MARKET, BY SOLUTION TYPE, 2021-2031 ($MILLION)
    TABLE 130. SOUTH KOREA SERVICES GREEN DATA CENTER MARKET, BY SERVICE TYPE, 2021-2031 ($MILLION)
    TABLE 131. SOUTH KOREA GREEN DATA CENTER MARKET, BY ENTERPRISE SIZE, 2021-2031 ($MILLION)
    TABLE 132. SOUTH KOREA GREEN DATA CENTER MARKET, BY INDUSTRY VERTICAL, 2021-2031 ($MILLION)
    TABLE 133. REST OF ASIA-PACIFIC GREEN DATA CENTER MARKET, BY COMPONENT, 2021-2031 ($MILLION)
    TABLE 134. REST OF ASIA-PACIFIC SOLUTION GREEN DATA CENTER MARKET, BY SOLUTION TYPE, 2021-2031 ($MILLION)
    TABLE 135. REST OF ASIA-PACIFIC SERVICES GREEN DATA CENTER MARKET, BY SERVICE TYPE, 2021-2031 ($MILLION)
    TABLE 136. REST OF ASIA-PACIFIC GREEN DATA CENTER MARKET, BY ENTERPRISE SIZE, 2021-2031 ($MILLION)
    TABLE 137. REST OF ASIA-PACIFIC GREEN DATA CENTER MARKET, BY INDUSTRY VERTICAL, 2021-2031 ($MILLION)
    TABLE 138. LAMEA GREEN DATA CENTER MARKET, BY COMPONENT, 2021-2031 ($MILLION)
    TABLE 139. LAMEA SOLUTION GREEN DATA CENTER MARKET, BY SOLUTION TYPE, 2021-2031 ($MILLION)
    TABLE 140. LAMEA SERVICES GREEN DATA CENTER MARKET, BY SERVICE TYPE, 2021-2031 ($MILLION)
    TABLE 141. LAMEA GREEN DATA CENTER MARKET, BY ENTERPRISE SIZE, 2021-2031 ($MILLION)
    TABLE 142. LAMEA GREEN DATA CENTER MARKET, BY INDUSTRY VERTICAL, 2021-2031 ($MILLION)
    TABLE 143. LAMEA GREEN DATA CENTER MARKET, BY COUNTRY, 2021-2031 ($MILLION)
    TABLE 144. LATIN AMERICA GREEN DATA CENTER MARKET, BY COMPONENT, 2021-2031 ($MILLION)
    TABLE 145. LATIN AMERICA SOLUTION GREEN DATA CENTER MARKET, BY SOLUTION TYPE, 2021-2031 ($MILLION)
    TABLE 146. LATIN AMERICA SERVICES GREEN DATA CENTER MARKET, BY SERVICE TYPE, 2021-2031 ($MILLION)
    TABLE 147. LATIN AMERICA GREEN DATA CENTER MARKET, BY ENTERPRISE SIZE, 2021-2031 ($MILLION)
    TABLE 148. LATIN AMERICA GREEN DATA CENTER MARKET, BY INDUSTRY VERTICAL, 2021-2031 ($MILLION)
    TABLE 149. MIDDLE EAST GREEN DATA CENTER MARKET, BY COMPONENT, 2021-2031 ($MILLION)
    TABLE 150. MIDDLE EAST SOLUTION GREEN DATA CENTER MARKET, BY SOLUTION TYPE, 2021-2031 ($MILLION)
    TABLE 151. MIDDLE EAST SERVICES GREEN DATA CENTER MARKET, BY SERVICE TYPE, 2021-2031 ($MILLION)
    TABLE 152. MIDDLE EAST GREEN DATA CENTER MARKET, BY ENTERPRISE SIZE, 2021-2031 ($MILLION)
    TABLE 153. MIDDLE EAST GREEN DATA CENTER MARKET, BY INDUSTRY VERTICAL, 2021-2031 ($MILLION)
    TABLE 154. AFRICA GREEN DATA CENTER MARKET, BY COMPONENT, 2021-2031 ($MILLION)
    TABLE 155. AFRICA SOLUTION GREEN DATA CENTER MARKET, BY SOLUTION TYPE, 2021-2031 ($MILLION)
    TABLE 156. AFRICA SERVICES GREEN DATA CENTER MARKET, BY SERVICE TYPE, 2021-2031 ($MILLION)
    TABLE 157. AFRICA GREEN DATA CENTER MARKET, BY ENTERPRISE SIZE, 2021-2031 ($MILLION)
    TABLE 158. AFRICA GREEN DATA CENTER MARKET, BY INDUSTRY VERTICAL, 2021-2031 ($MILLION)
    TABLE 159.ABB LTD.: COMPANY SNAPSHOT
    TABLE 160.ABB LTD.: OPERATING SEGMENTS
    TABLE 161.ABB LTD.: PRODUCT PORTFOLIO
    TABLE 162.ABB LTD.: NET SALES,
    TABLE 163.ABB LTD.: KEY STRATERGIES
    TABLE 164.CISCO: COMPANY SNAPSHOT
    TABLE 165.CISCO: OPERATING SEGMENTS
    TABLE 166.CISCO: PRODUCT PORTFOLIO
    TABLE 167.CISCO: NET SALES,
    TABLE 168.CISCO: KEY STRATERGIES
    TABLE 169.CYBER POWER SYSTEMS: COMPANY SNAPSHOT
    TABLE 170.CYBER POWER SYSTEMS: OPERATING SEGMENTS
    TABLE 171.CYBER POWER SYSTEMS: PRODUCT PORTFOLIO
    TABLE 172.CYBER POWER SYSTEMS: NET SALES,
    TABLE 173.CYBER POWER SYSTEMS: KEY STRATERGIES
    TABLE 174.DELL TECHNOLOGIES: COMPANY SNAPSHOT
    TABLE 175.DELL TECHNOLOGIES: OPERATING SEGMENTS
    TABLE 176.DELL TECHNOLOGIES: PRODUCT PORTFOLIO
    TABLE 177.DELL TECHNOLOGIES: NET SALES,
    TABLE 178.DELL TECHNOLOGIES: KEY STRATERGIES
    TABLE 179.DELTA ELECTRONICS: COMPANY SNAPSHOT
    TABLE 180.DELTA ELECTRONICS: OPERATING SEGMENTS
    TABLE 181.DELTA ELECTRONICS: PRODUCT PORTFOLIO
    TABLE 182.DELTA ELECTRONICS: NET SALES,
    TABLE 183.DELTA ELECTRONICS: KEY STRATERGIES
    TABLE 184.DIGITAL REALTY TRUST: COMPANY SNAPSHOT
    TABLE 185.DIGITAL REALTY TRUST: OPERATING SEGMENTS
    TABLE 186.DIGITAL REALTY TRUST: PRODUCT PORTFOLIO
    TABLE 187.DIGITAL REALTY TRUST: NET SALES,
    TABLE 188.DIGITAL REALTY TRUST: KEY STRATERGIES
    TABLE 189.EATON CORPORATION: COMPANY SNAPSHOT
    TABLE 190.EATON CORPORATION: OPERATING SEGMENTS
    TABLE 191.EATON CORPORATION: PRODUCT PORTFOLIO
    TABLE 192.EATON CORPORATION: NET SALES,
    TABLE 193.EATON CORPORATION: KEY STRATERGIES
    TABLE 194.HEWLETT PACKARD ENTERPRISE: COMPANY SNAPSHOT
    TABLE 195.HEWLETT PACKARD ENTERPRISE: OPERATING SEGMENTS
    TABLE 196.HEWLETT PACKARD ENTERPRISE: PRODUCT PORTFOLIO
    TABLE 197.HEWLETT PACKARD ENTERPRISE: NET SALES,
    TABLE 198.HEWLETT PACKARD ENTERPRISE: KEY STRATERGIES
    TABLE 199.HUAWEI TECHNOLOGIES CO. LTD: COMPANY SNAPSHOT
    TABLE 200.HUAWEI TECHNOLOGIES CO. LTD: OPERATING SEGMENTS
    TABLE 201.HUAWEI TECHNOLOGIES CO. LTD: PRODUCT PORTFOLIO
    TABLE 202.HUAWEI TECHNOLOGIES CO. LTD: NET SALES,
    TABLE 203.HUAWEI TECHNOLOGIES CO. LTD: KEY STRATERGIES
    TABLE 204.IBM CORPORATION: COMPANY SNAPSHOT
    TABLE 205.IBM CORPORATION: OPERATING SEGMENTS
    TABLE 206.IBM CORPORATION: PRODUCT PORTFOLIO
    TABLE 207.IBM CORPORATION: NET SALES,
    TABLE 208.IBM CORPORATION: KEY STRATERGIES
    TABLE 209.MIDAS GREEN TECHNOLOGIES: COMPANY SNAPSHOT
    TABLE 210.MIDAS GREEN TECHNOLOGIES: OPERATING SEGMENTS
    TABLE 211.MIDAS GREEN TECHNOLOGIES: PRODUCT PORTFOLIO
    TABLE 212.MIDAS GREEN TECHNOLOGIES: NET SALES,
    TABLE 213.MIDAS GREEN TECHNOLOGIES: KEY STRATERGIES
    TABLE 214.NEC CORPORATION: COMPANY SNAPSHOT
    TABLE 215.NEC CORPORATION: OPERATING SEGMENTS
    TABLE 216.NEC CORPORATION: PRODUCT PORTFOLIO
    TABLE 217.NEC CORPORATION: NET SALES,
    TABLE 218.NEC CORPORATION: KEY STRATERGIES
    TABLE 219.NORTEK AIR SOLUTIONS: COMPANY SNAPSHOT
    TABLE 220.NORTEK AIR SOLUTIONS: OPERATING SEGMENTS
    TABLE 221.NORTEK AIR SOLUTIONS: PRODUCT PORTFOLIO
    TABLE 222.NORTEK AIR SOLUTIONS: NET SALES,
    TABLE 223.NORTEK AIR SOLUTIONS: KEY STRATERGIES
    TABLE 224.NTT COMMUNICATIONS: COMPANY SNAPSHOT
    TABLE 225.NTT COMMUNICATIONS: OPERATING SEGMENTS
    TABLE 226.NTT COMMUNICATIONS: PRODUCT PORTFOLIO
    TABLE 227.NTT COMMUNICATIONS: NET SALES,
    TABLE 228.NTT COMMUNICATIONS: KEY STRATERGIES
    TABLE 229.SCHNEIDER ELECTRIC: COMPANY SNAPSHOT
    TABLE 230.SCHNEIDER ELECTRIC: OPERATING SEGMENTS
    TABLE 231.SCHNEIDER ELECTRIC: PRODUCT PORTFOLIO
    TABLE 232.SCHNEIDER ELECTRIC: NET SALES,
    TABLE 233.SCHNEIDER ELECTRIC: KEY STRATERGIES
    TABLE 234.SUPER MICRO: COMPANY SNAPSHOT
    TABLE 235.SUPER MICRO: OPERATING SEGMENTS
    TABLE 236.SUPER MICRO: PRODUCT PORTFOLIO
    TABLE 237.SUPER MICRO: NET SALES,
    TABLE 238.SUPER MICRO: KEY STRATERGIES
    TABLE 239.ZUTACORE: COMPANY SNAPSHOT
    TABLE 240.ZUTACORE: OPERATING SEGMENTS
    TABLE 241.ZUTACORE: PRODUCT PORTFOLIO
    TABLE 242.ZUTACORE: NET SALES,
    TABLE 243.ZUTACORE: KEY STRATERGIES
  • LIST OF FIGURES

  • FIGURE 1.GREEN DATA CENTER MARKET SEGMENTATION
    FIGURE 2.GREEN DATA CENTER MARKET,2021-2031
    FIGURE 3.GREEN DATA CENTER MARKET,2021-2031
    FIGURE 4. TOP INVESTMENT POCKETS, BY REGION
    FIGURE 5.PORTER FIVE-1
    FIGURE 6.PORTER FIVE-2
    FIGURE 7.PORTER FIVE-3
    FIGURE 8.PORTER FIVE-4
    FIGURE 9.PORTER FIVE-5
    FIGURE 10.TOP PLAYER POSITIONING
    FIGURE 11.GREEN DATA CENTER MARKET:DRIVERS, RESTRAINTS AND OPPORTUNITIES
    FIGURE 12.GREEN DATA CENTER MARKET,BY COMPONENT,2021(%)
    FIGURE 13.COMPARATIVE SHARE ANALYSIS OF SOLUTION GREEN DATA CENTER MARKET,2021-2031(%)
    FIGURE 14.COMPARATIVE SHARE ANALYSIS OF SERVICES GREEN DATA CENTER MARKET,2021-2031(%)
    FIGURE 15.GREEN DATA CENTER MARKET,BY ENTERPRISE SIZE,2021(%)
    FIGURE 16.COMPARATIVE SHARE ANALYSIS OF LARGE ENTERPRISES GREEN DATA CENTER MARKET,2021-2031(%)
    FIGURE 17.COMPARATIVE SHARE ANALYSIS OF SMALL AND MEDIUM-SIZED ENTERPRISES GREEN DATA CENTER MARKET,2021-2031(%)
    FIGURE 18.GREEN DATA CENTER MARKET,BY INDUSTRY VERTICAL,2021(%)
    FIGURE 19.COMPARATIVE SHARE ANALYSIS OF BFSI GREEN DATA CENTER MARKET,2021-2031(%)
    FIGURE 20.COMPARATIVE SHARE ANALYSIS OF IT AND TELECOM GREEN DATA CENTER MARKET,2021-2031(%)
    FIGURE 21.COMPARATIVE SHARE ANALYSIS OF MEDIA AND ENTERTAINMENT GREEN DATA CENTER MARKET,2021-2031(%)
    FIGURE 22.COMPARATIVE SHARE ANALYSIS OF HEALTHCARE GREEN DATA CENTER MARKET,2021-2031(%)
    FIGURE 23.COMPARATIVE SHARE ANALYSIS OF GOVERNMENT AND DEFENSE GREEN DATA CENTER MARKET,2021-2031(%)
    FIGURE 24.COMPARATIVE SHARE ANALYSIS OF RETAIL GREEN DATA CENTER MARKET,2021-2031(%)
    FIGURE 25.COMPARATIVE SHARE ANALYSIS OF MANUFACTURING GREEN DATA CENTER MARKET,2021-2031(%)
    FIGURE 26.COMPARATIVE SHARE ANALYSIS OF OTHERS GREEN DATA CENTER MARKET,2021-2031(%)
    FIGURE 27.GREEN DATA CENTER MARKET BY REGION,2021
    FIGURE 28.U.S. GREEN DATA CENTER MARKET,2021-2031($MILLION)
    FIGURE 29.CANADA GREEN DATA CENTER MARKET,2021-2031($MILLION)
    FIGURE 30.UK GREEN DATA CENTER MARKET,2021-2031($MILLION)
    FIGURE 31.GERMANY GREEN DATA CENTER MARKET,2021-2031($MILLION)
    FIGURE 32.FRANCE GREEN DATA CENTER MARKET,2021-2031($MILLION)
    FIGURE 33.ITALY GREEN DATA CENTER MARKET,2021-2031($MILLION)
    FIGURE 34.SPAIN GREEN DATA CENTER MARKET,2021-2031($MILLION)
    FIGURE 35.NETHERLANDS GREEN DATA CENTER MARKET,2021-2031($MILLION)
    FIGURE 36.REST OF EUROPE GREEN DATA CENTER MARKET,2021-2031($MILLION)
    FIGURE 37.CHINA GREEN DATA CENTER MARKET,2021-2031($MILLION)
    FIGURE 38.JAPAN GREEN DATA CENTER MARKET,2021-2031($MILLION)
    FIGURE 39.INDIA GREEN DATA CENTER MARKET,2021-2031($MILLION)
    FIGURE 40.AUSTRALIA GREEN DATA CENTER MARKET,2021-2031($MILLION)
    FIGURE 41.SOUTH KOREA GREEN DATA CENTER MARKET,2021-2031($MILLION)
    FIGURE 42.REST OF ASIA-PACIFIC GREEN DATA CENTER MARKET,2021-2031($MILLION)
    FIGURE 43.LATIN AMERICA GREEN DATA CENTER MARKET,2021-2031($MILLION)
    FIGURE 44.MIDDLE EAST GREEN DATA CENTER MARKET,2021-2031($MILLION)
    FIGURE 45.AFRICA GREEN DATA CENTER MARKET,2021-2031($MILLION)
    FIGURE 46. TOP WINNING STRATEGIES, BY YEAR
    FIGURE 47. TOP WINNING STRATEGIES, BY DEVELOPMENT
    FIGURE 48. TOP WINNING STRATEGIES, BY COMPANY
    FIGURE 49.PRODUCT MAPPING OF TOP 10 PLAYERS
    FIGURE 50.COMPETITIVE DASHBOARD
    FIGURE 51.COMPETITIVE HEATMAP OF TOP 10 KEY PLAYERS
    FIGURE 52.ABB LTD..: NET SALES ,($MILLION)
    FIGURE 53.CISCO.: NET SALES ,($MILLION)
    FIGURE 54.CYBER POWER SYSTEMS.: NET SALES ,($MILLION)
    FIGURE 55.DELL TECHNOLOGIES.: NET SALES ,($MILLION)
    FIGURE 56.DELTA ELECTRONICS.: NET SALES ,($MILLION)
    FIGURE 57.DIGITAL REALTY TRUST.: NET SALES ,($MILLION)
    FIGURE 58.EATON CORPORATION.: NET SALES ,($MILLION)
    FIGURE 59.HEWLETT PACKARD ENTERPRISE.: NET SALES ,($MILLION)
    FIGURE 60.HUAWEI TECHNOLOGIES CO. LTD.: NET SALES ,($MILLION)
    FIGURE 61.IBM CORPORATION.: NET SALES ,($MILLION)
    FIGURE 62.MIDAS GREEN TECHNOLOGIES.: NET SALES ,($MILLION)
    FIGURE 63.NEC CORPORATION.: NET SALES ,($MILLION)
    FIGURE 64.NORTEK AIR SOLUTIONS.: NET SALES ,($MILLION)
    FIGURE 65.NTT COMMUNICATIONS.: NET SALES ,($MILLION)
    FIGURE 66.SCHNEIDER ELECTRIC.: NET SALES ,($MILLION)
    FIGURE 67.SUPER MICRO.: NET SALES ,($MILLION)
    FIGURE 68.ZUTACORE.: NET SALES ,($MILLION)


According to the insights of the CXOs of leading companies, modern enterprises globally have been continually adopting cloud computing solutions in almost all business aspects, including information storage, accounting, business communication, and daily business functions. A green data center is a centralized physical facility that makes enterprise computing possible. Further, rise in virtual infrastructure across prime enterprises is driving the need for build-in server rooms or data centers for virtualized networks; therefore, is expected to offer lucrative growth opportunities for the market growth. Furthermore, the green data center is considered central to an enterprise’s IT operations, where most business data is processed, stored, and disseminated to users. In addition, the rise in demand for digitization across enterprises in emerging economies is expected to offer profitable opportunities for the green data center market.

The global green data center market is highly competitive, owing to the strong presence of existing vendors. Green data center vendors, who have access to extensive technical and financial resources, are anticipated to gain a competitive edge over their rivals, as they have the capacity to cater to the market requirements. The competitive environment in this market is expected to further intensify with increase in technological innovations, product extensions, and different strategies adopted by key vendors.

Prominent market players explore new technologies and platforms to meet increase in customer demands. Product launches, partnerships, and acquisitions are expected to enable them to expand their product portfolios and penetrate different regions. For instance, in June 2019, Schneider Electric expanded its data center solutions portfolio by introducing Critical Facility Operations. It has improved digitized versions of cloud & service providers and large data center operators. The advantages of the solution for customers include lower risk & increased uptime, growing operational efficiency, and efficient IT planning.

Among the analyzed regions, North America exhibits the highest adoption of green data center and has been experiencing massive expansion of the market. On the other hand, Asia-Pacific is expected to grow at a faster pace, predicting lucrative growth due to emerging countries such as China, Japan, and India investing in these technologies.

PURCHASE OPTIONS

Call or Email us

U.S.-Canada Toll-free: +1-800-792-5285
Int'l : +1-503-894-6022
Europe : +44-845-528-1300
Email : help@alliedmarketresearch.com
 
FREQUENTLY ASKED QUESTIONS?

A. Factors such as surge in penetration of high-end cloud computing in enterprise, rise in green data center complexities due to scalability and surge in the expenditure on green data center technology are key factors driving the growth of the Green Data Center market.

A. North America dominates the green data center industry. Growth of the market in this region is attributed to several factors such as increase in digitalization and adoption of green data center solutions by the various sectors such as manufacturing, BFSI, and governments.

A. The global green data center market size was valued at $49,678.67 million in 2021, and is projected to reach $303,939.0 million by 2031, registering a CAGR of 20.1% from 2022 to 2031.

A. Some of the major players in the market are ABB LTD, Cyber Power Systems, Dell Technologies Inc., Delta Electronics, Inc., Digital Realty Trust, Inc., Eaton Corporation, Hewlett-Packard, Huawei Technologies, IBM Corporation, NEC Corporation, Nortek Air Solutions, NTT Corporation, Schneider Electric and ZutaCore. These players have adopted various strategies to increase their market penetration and strengthen their position in the industry.

Looking for Customization?

 Customization Request

Have a Question?

 Speak with Analyst

Any Confusion?

 Inquire Before Buying

Have a glance of the Report

  Request Sample
RELATED TAGS

Purchase Full Report of
Green Data Center Market

Start reading instantly.
This Report and over 66,782+ more Reports, Available with Avenue Library. T&C*.

  • Online Only
  • $3,690
  • Online cloud access only
  • Restricted print, copy, paste & download
  • Read only
  • Free industry update
    (Within 180 days)
  • Free report update in next update cycle
    (Oct 2023 - Oct 2024)
  • Data Pack
  • $3,930
  • Restricted to one authorized user
  • One print only
  • Available in
    Excel
  • Free industry update
    (Within 180 days)
  •   Free report update in next update cycle
    (Oct 2023 - Oct 2024)
  • Single User
  • $5,820
  • Restricted to one authorized user
  • One print only
  • Available in
    PDF
  • Free industry update
    (Within 180 days)
  •   Free report update in next update cycle
    (Oct 2023 - Oct 2024)
  • Five Users
  • $6,540
  • Limited to five authorized users
  • Print upto five copies
  • Available in
    PDF
  • Free industry update
    (Within 180 days)
  •   Free report update in next update cycle
    (Oct 2023 - Oct 2024)
  • Enterprise
    License/PDF

  • $9,870
  • Unlimited
    within
    company/enterprise
  • Available in Excel & PDF
  • Free industry update
    (Within 180 days)
  •   Free report update in next update cycle
    (Oct 2023 - Oct 2024)
  • Library
    Membership

  • $999 $ 1,175
    Per User/ Per month/ Billed annually
  • Published Content
    E-access
  • Company Profiles
    E-access
  • Newly Added Content Access
  • 10 PDF
    Downloads
  • 5 Excel Data
    Pack Downloads
  • 250 Company Profiles PDF Downloads
  • Buy Now

*Taxes/Fees, if applicable will be added during checkout. All prices in USD

RELATED REPORTS
 

Why Allied Market Research?


Infallible Methodology

To ensure high-level data integrity, accurate analysis, and impeccable forecasts

Analyst Support

For complete satisfaction

Customization

On-demand customization of scope of the report to exactly meet your needs

TARGETED MARKET VIEW

Targeted market view to provide pertinent information and save time of readers

Get fresh content delivered

Get insights on topics that are crucial for your business. Stay abreast of your interest areas.

Get Industry Data Alerts

Why Allied Market Research?

Infallible Methodology

To ensure high-level data integrity, accurate analysis, and impeccable forecasts

Analyst Support

For complete satisfaction

Customization

On-demand customization of scope of the report to exactly meet your needs

TARGETED MARKET VIEW

Targeted market view to provide pertinent information and save time of readers