0
2022
Grow Lights Market

Grow Lights Market

by Offering (Hardware, Software, Services), by Technology (High Intensity Discharge (HID), Light Emitting Diode (LED), Fluorescent, Others), by Spectrum (Narrow, Broad), by Installation Type (New Installation, Retrofit), by Application (Indoor Farming, Commercial Greenhouse, Vertical Farming, Turf and Landscaping, Research, Others): Global Opportunity Analysis and Industry Forecast, 2021-2031

Report Code: A06157
Jul 2022 | Pages: 280
Tables: 190
Charts: 65
  • Formats*:

  • pdf

    Single User License, Five User
    License & Enterprise User License

  • xls

    Data Pack Excel License

  • ppt

    It comes with the additional cost
    of $2500.00 contact sales.


The global grow lights market size was valued at $2.4 billion in 2021, and is projected to reach $27.3 billion by 2031, growing at a CAGR of 27.5% from 2022 to 2031.

Grow lights are specialized lights used for growing indoor and commercial greenhouse plants. These lights help plants in the process of photosynthesis and boost healthy development and yield incredible products. Grow lights offer many benefits as it mimics the white light received from the sun. It includes longer lifespan, cooler temperature, greater efficiency, usage of full spectrum, compact size, and state rebates. These factors make it ideal for indoor, vertical farming, commercial greenhouses, and other applications.

The emergence of the pandemic in 2020, left the lighting industry in shambles. The industry stakeholders incurred huge losses and were forced to resort to extreme measures and reorient their age-old strategies in order to ensure survival and long-term stability. However, after the passing of the relapse waves of COVID-19 accompanied by massive vaccination drives carried out by nations across the globe, different lighting segments began to recover from 2021. The COVID-19 pandemic has primarily had a disruptive effect on the economy. The distribution of the finished product as well as the supply of raw materials were both impacted by the supply chain disruptions. In addition, compared to pre-COVID levels, the demand for grow lights decreased significantly. In the short term, the demand for grow lights is anticipated to suffer from a decline in export shipments and a slowdown in domestic demand compared to pre-COVID-19 levels. However, as the restrictions were loosened, the market began to improve. Students who worked from home for an extended period of time were involved in gardening, especially growing vegetables. For their home gardens, many people have embraced vertical farming and indoor farming methods like hydroponics. The demand for grow lights began to increase, and after the restrictions were lifted, the demand for grow lights stabilised. Additionally, the availability of grow lights was restored as the supply chains were restored to normal and shipments resumed on a regular basis. It is anticipated that major market participants in the grow light industry will make modest R&D cuts, enabling them to maintain a robust and evolving product portfolio. The companies such as BIOS Lighting and Kroptek are looking forward to produce a single grow light, which contains multiple options such as Internet of Things (IoT), dimmable LEDs, and adjusting height of fixtures. Such advancements will give businesses and manufacturers a competitive advantage to reduce material costs during production, and the products will receive ongoing updates.

Grow Lights Market, Grow Lights Industry, Grow Lights Market Size, Grow Lights Market Share, Grow Lights Market Growth, Grow Lights Market Trends, Grow Lights Market Analysis, Grow Lights Market Forecast, Grow Lights Market Outlook, Grow Lights Market Opportunity

Grow lights can be adjusted to different colors, which affect growth cycle of specific plants. It can be adjusted to change from ultraviolet (UV) spectrum to infra-red (IR) spectrum. This adjustment makes plants grow to their best potential, while maximizing potential profits. Grow lights are highly preferred for seedlings, herbs, succulents, and leafy houseplants, as they offer optimum environment for growth.

Higher efficiency offered by grow lights such as LEDs is the prime reason that drives growth of the grow light industry during the forecast period. Furthermore, grow lights offer higher controllability and scalability, which accelerates growth of the grow light market. Moreover, rise in adoption of vertical farming is opportunistic for the grow lights industry. Considering these factors, the grow lights industry is estimated to experience exponential grow lights market growth in the future.

Cultivation of medicinal plants is expected to expand the grow lights market opportunity for the market during the forecast period. However, high initial investments act as major restrains for the market growth. Moreover, lack of standardization results in high risk of purchasing incompatible parts hampers the market growth.

The grow lights market share and revenue has been significantly impacted by the COVID-19 outbreak. Production facilities of electronics and semiconductors have been halted, owing to slowdown and unavailability of workforces across the globe. COVID-19 outbreak has caused a significant and protracted drop in manufacturing utilization and travel bans. In addition, facility closures kept workers out of their factories, which led to slowdown in growth of the grow lights industry in 2020.

The grow lights market is segmented into Offering, Technology, Spectrum, Installation Type and Application.
Grow Lights Market

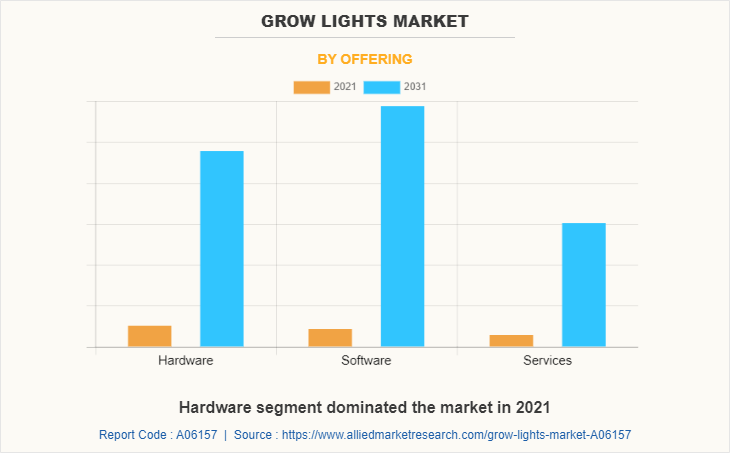
Based on offering, it is fragmented into hardware, software, and services. The hardware dominated the market, in terms of revenue in 2021, and is expected to follow the same trend during the forecast period.
Grow Lights Market

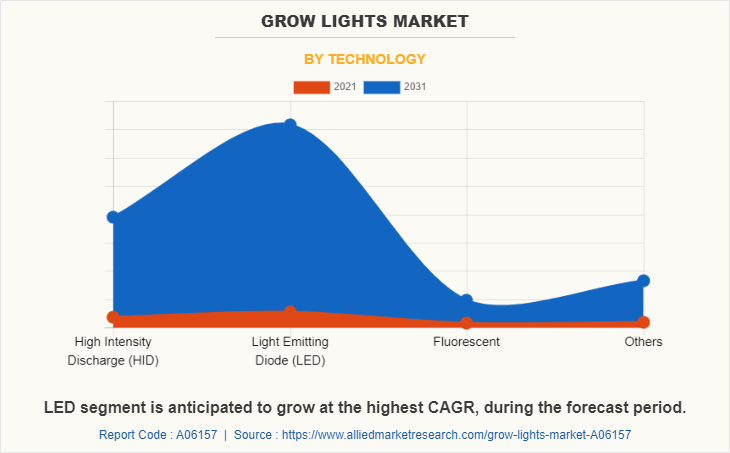
Based on technology, the market is segregated into high intensity discharge (HID), light emitting diode (LED), fluorescent and others. The light emitting diode (LED) segment dominated the market, in terms of revenue in 2021, and is anticipated to witness significant market share during the forecast period.
Grow Lights Market

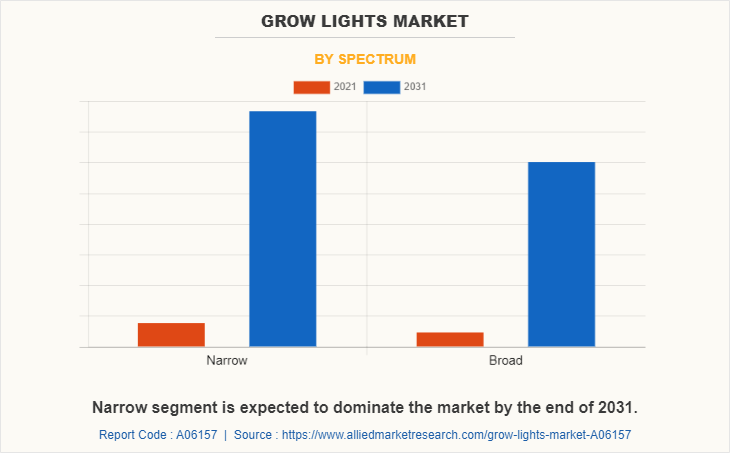
By spectrum, the market is divided into narrow and broad. The narrow segment dominated the market, in terms of revenue in 2021, and is anticipated to witness significant market share during the forecast period.
Grow Lights Market

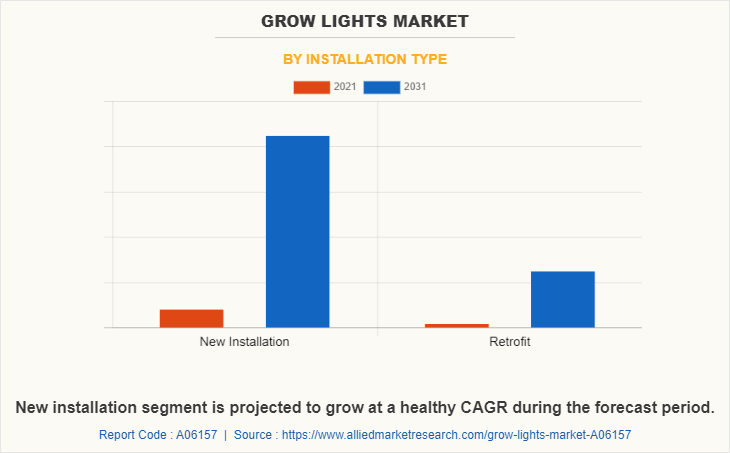
By installation type, the market is divided into new installation, and retrofit. Both new installation and retrofit segments are further bifurcated into remote and touch. The market share for the new installation segment was highest in 2020, and is expected to grow at a high CAGR from 2022 to 2031.
Grow Lights Market

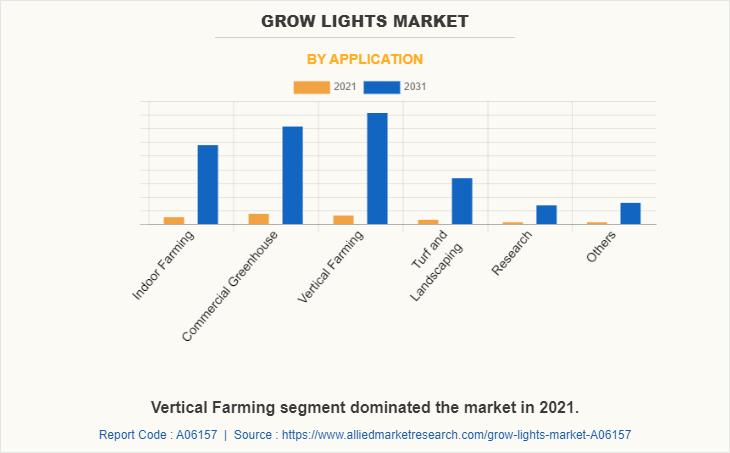
By application, the market is divided into indoor farming, commercial greenhouse, vertical farming, Turf & landscaping, research, and others. The market share for the commercial greenhouse segment was highest in 2021, and the others segment is expected to grow at a high CAGR from 2022 to 2031.
Grow Lights Market

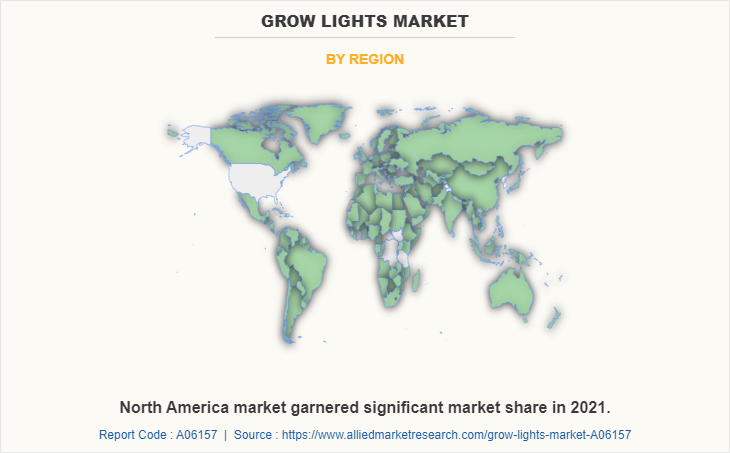
Region-wise, the grow lights market forecast trends are analyzed across North America (the U.S., Canada, and Mexico), Europe (the UK, Germany, France, Italy, and Rest of Europe), Asia-Pacific (China, Japan, India, South Korea, and Rest of Asia-Pacific), and LAMEA (Latin America, the Middle East, and Africa). The Asia-Pacific LED grow lights market is expected to grow at the highest rate during the forecast period.

TOP IMPACTING FACTORS

Significant factors that impact the growth of the grow lights market outlook include rise in demand for energy efficient grow lights. Moreover, significant rise in glass house lighting by various organizations has been observed. However, initial high investment and set-up costs may hamper the growth of the market. On the contrary, growth in the cultivation of medicinal plants is expected to offer potential growth opportunity for the grow light market during the forecast period.

COMPETITION ANALYSIS

Competitive analysis and profiles of the major satellite modem market players, such as BIOS Lighting, Fluence (Osram), GE Current, Heliospectra AB, HORTILUX SCHRÉDER, Kroptek, SANlight GmbH, Signify N.V., Valoya and Vertically Urban are provided in this report.

Key Benefits For Stakeholders

  • This report provides a quantitative analysis of the market segments, current trends, estimations, and dynamics of the grow lights market analysis from 2021 to 2031 to identify the prevailing grow lights market opportunities.
  • The market research is offered along with information related to key drivers, restraints, and opportunities.
  • Porter's five forces analysis highlights the potency of buyers and suppliers to enable stakeholders make profit-oriented business decisions and strengthen their supplier-buyer network.
  • In-depth analysis of the grow lights market segmentation assists to determine the prevailing market opportunities.
  • Major countries in each region are mapped according to their revenue contribution to the global market.
  • Market player positioning facilitates benchmarking and provides a clear understanding of the present position of the market players.
  • The report includes the analysis of the regional as well as global grow lights market trends, key players, market segments, application areas, and market growth strategies.

Grow Lights Market Report Highlights

Aspects Details
By Offering
  • Hardware
  • Software
  • Services
By Technology
  • High Intensity Discharge (HID)
  • Light Emitting Diode (LED)
  • Fluorescent
  • Others
By Spectrum
  • Narrow
  • Broad
By Installation Type
  • New Installation
  • Retrofit
By Application
  • Indoor Farming
  • Commercial Greenhouse
  • Vertical Farming
  • Turf and Landscaping
  • Research
  • Others
By Region
  • North America  (U.S., Canada, Mexico)
  • Europe  (U.K., Germany, France, Italy, Rest of Europe)
  • Asia-Pacific  (China, Japan, India, South Korea, Rest Of Asia Pacific)
  • LAMEA  (Latin America, Middle East, Africa)
Key Market Players SANlight GmbH, valoya ltd, Fluence (Osram), hortilux schreder, Signify N.V., Kroptek, bios lighting, GE Current, heliospectra ab
 
  • CHAPTER 1:INTRODUCTION

    • 1.1.Report description

    • 1.2.Key market segments

    • 1.3.Key benefits to the stakeholders

    • 1.4.Research Methodology

      • 1.4.1.Secondary research

      • 1.4.2.Primary research

      • 1.4.3.Analyst tools and models

  • CHAPTER 2:EXECUTIVE SUMMARY

    • 2.1.Key findings of the study

    • 2.2.CXO Perspective

  • CHAPTER 3:MARKET OVERVIEW

    • 3.1.Market definition and scope

    • 3.2.Key findings

      • 3.2.1.Top investment pockets

    • 3.3.Porter’s five forces analysis

    • 3.4.Top player positioning

    • 3.5.Market dynamics

      • 3.5.1.Drivers

      • 3.5.2.Restraints

      • 3.5.3.Opportunities

    • 3.6.COVID-19 Impact Analysis on the market

  • CHAPTER 4: GROW LIGHTS MARKET, BY OFFERING

    • 4.1 Overview

      • 4.1.1 Market size and forecast

    • 4.2 Hardware

      • 4.2.1 Key market trends, growth factors and opportunities

      • 4.2.2 Market size and forecast, by region

      • 4.2.3 Market analysis by country

    • 4.3 Software

      • 4.3.1 Key market trends, growth factors and opportunities

      • 4.3.2 Market size and forecast, by region

      • 4.3.3 Market analysis by country

    • 4.4 Services

      • 4.4.1 Key market trends, growth factors and opportunities

      • 4.4.2 Market size and forecast, by region

      • 4.4.3 Market analysis by country

  • CHAPTER 5: GROW LIGHTS MARKET, BY TECHNOLOGY

    • 5.1 Overview

      • 5.1.1 Market size and forecast

    • 5.2 High Intensity Discharge (HID)

      • 5.2.1 Key market trends, growth factors and opportunities

      • 5.2.2 Market size and forecast, by region

      • 5.2.3 Market analysis by country

    • 5.3 Light Emitting Diode (LED)

      • 5.3.1 Key market trends, growth factors and opportunities

      • 5.3.2 Market size and forecast, by region

      • 5.3.3 Market analysis by country

    • 5.4 Fluorescent

      • 5.4.1 Key market trends, growth factors and opportunities

      • 5.4.2 Market size and forecast, by region

      • 5.4.3 Market analysis by country

    • 5.5 Others

      • 5.5.1 Key market trends, growth factors and opportunities

      • 5.5.2 Market size and forecast, by region

      • 5.5.3 Market analysis by country

  • CHAPTER 6: GROW LIGHTS MARKET, BY SPECTRUM

    • 6.1 Overview

      • 6.1.1 Market size and forecast

    • 6.2 Narrow

      • 6.2.1 Key market trends, growth factors and opportunities

      • 6.2.2 Market size and forecast, by region

      • 6.2.3 Market analysis by country

    • 6.3 Broad

      • 6.3.1 Key market trends, growth factors and opportunities

      • 6.3.2 Market size and forecast, by region

      • 6.3.3 Market analysis by country

  • CHAPTER 7: GROW LIGHTS MARKET, BY INSTALLATION TYPE

    • 7.1 Overview

      • 7.1.1 Market size and forecast

    • 7.2 New Installation

      • 7.2.1 Key market trends, growth factors and opportunities

      • 7.2.2 Market size and forecast, by region

      • 7.2.3 Market analysis by country

    • 7.3 Retrofit

      • 7.3.1 Key market trends, growth factors and opportunities

      • 7.3.2 Market size and forecast, by region

      • 7.3.3 Market analysis by country

  • CHAPTER 8: GROW LIGHTS MARKET, BY APPLICATION

    • 8.1 Overview

      • 8.1.1 Market size and forecast

    • 8.2 Indoor Farming

      • 8.2.1 Key market trends, growth factors and opportunities

      • 8.2.2 Market size and forecast, by region

      • 8.2.3 Market analysis by country

    • 8.3 Commercial Greenhouse

      • 8.3.1 Key market trends, growth factors and opportunities

      • 8.3.2 Market size and forecast, by region

      • 8.3.3 Market analysis by country

    • 8.4 Vertical Farming

      • 8.4.1 Key market trends, growth factors and opportunities

      • 8.4.2 Market size and forecast, by region

      • 8.4.3 Market analysis by country

    • 8.5 Turf and Landscaping

      • 8.5.1 Key market trends, growth factors and opportunities

      • 8.5.2 Market size and forecast, by region

      • 8.5.3 Market analysis by country

    • 8.6 Research

      • 8.6.1 Key market trends, growth factors and opportunities

      • 8.6.2 Market size and forecast, by region

      • 8.6.3 Market analysis by country

    • 8.7 Others

      • 8.7.1 Key market trends, growth factors and opportunities

      • 8.7.2 Market size and forecast, by region

      • 8.7.3 Market analysis by country

  • CHAPTER 9: GROW LIGHTS MARKET, BY REGION

    • 9.1 Overview

      • 9.1.1 Market size and forecast

    • 9.2 North America

      • 9.2.1 Key trends and opportunities

      • 9.2.2 North America Market size and forecast, by Offering

      • 9.2.3 North America Market size and forecast, by Technology

      • 9.2.4 North America Market size and forecast, by Spectrum

      • 9.2.5 North America Market size and forecast, by Installation Type

      • 9.2.6 North America Market size and forecast, by Application

      • 9.2.7 North America Market size and forecast, by country

        • 9.2.7.1 U.S.
          • 9.2.7.1.1 Market size and forecast, by Offering
          • 9.2.7.1.2 Market size and forecast, by Technology
          • 9.2.7.1.3 Market size and forecast, by Spectrum
          • 9.2.7.1.4 Market size and forecast, by Installation Type
          • 9.2.7.1.5 Market size and forecast, by Application
        • 9.2.7.2 Canada
          • 9.2.7.2.1 Market size and forecast, by Offering
          • 9.2.7.2.2 Market size and forecast, by Technology
          • 9.2.7.2.3 Market size and forecast, by Spectrum
          • 9.2.7.2.4 Market size and forecast, by Installation Type
          • 9.2.7.2.5 Market size and forecast, by Application
        • 9.2.7.3 Mexico
          • 9.2.7.3.1 Market size and forecast, by Offering
          • 9.2.7.3.2 Market size and forecast, by Technology
          • 9.2.7.3.3 Market size and forecast, by Spectrum
          • 9.2.7.3.4 Market size and forecast, by Installation Type
          • 9.2.7.3.5 Market size and forecast, by Application
    • 9.3 Europe

      • 9.3.1 Key trends and opportunities

      • 9.3.2 Europe Market size and forecast, by Offering

      • 9.3.3 Europe Market size and forecast, by Technology

      • 9.3.4 Europe Market size and forecast, by Spectrum

      • 9.3.5 Europe Market size and forecast, by Installation Type

      • 9.3.6 Europe Market size and forecast, by Application

      • 9.3.7 Europe Market size and forecast, by country

        • 9.3.7.1 U.K.
          • 9.3.7.1.1 Market size and forecast, by Offering
          • 9.3.7.1.2 Market size and forecast, by Technology
          • 9.3.7.1.3 Market size and forecast, by Spectrum
          • 9.3.7.1.4 Market size and forecast, by Installation Type
          • 9.3.7.1.5 Market size and forecast, by Application
        • 9.3.7.2 Germany
          • 9.3.7.2.1 Market size and forecast, by Offering
          • 9.3.7.2.2 Market size and forecast, by Technology
          • 9.3.7.2.3 Market size and forecast, by Spectrum
          • 9.3.7.2.4 Market size and forecast, by Installation Type
          • 9.3.7.2.5 Market size and forecast, by Application
        • 9.3.7.3 France
          • 9.3.7.3.1 Market size and forecast, by Offering
          • 9.3.7.3.2 Market size and forecast, by Technology
          • 9.3.7.3.3 Market size and forecast, by Spectrum
          • 9.3.7.3.4 Market size and forecast, by Installation Type
          • 9.3.7.3.5 Market size and forecast, by Application
        • 9.3.7.4 Italy
          • 9.3.7.4.1 Market size and forecast, by Offering
          • 9.3.7.4.2 Market size and forecast, by Technology
          • 9.3.7.4.3 Market size and forecast, by Spectrum
          • 9.3.7.4.4 Market size and forecast, by Installation Type
          • 9.3.7.4.5 Market size and forecast, by Application
        • 9.3.7.5 Rest of Europe
          • 9.3.7.5.1 Market size and forecast, by Offering
          • 9.3.7.5.2 Market size and forecast, by Technology
          • 9.3.7.5.3 Market size and forecast, by Spectrum
          • 9.3.7.5.4 Market size and forecast, by Installation Type
          • 9.3.7.5.5 Market size and forecast, by Application
    • 9.4 Asia-Pacific

      • 9.4.1 Key trends and opportunities

      • 9.4.2 Asia-Pacific Market size and forecast, by Offering

      • 9.4.3 Asia-Pacific Market size and forecast, by Technology

      • 9.4.4 Asia-Pacific Market size and forecast, by Spectrum

      • 9.4.5 Asia-Pacific Market size and forecast, by Installation Type

      • 9.4.6 Asia-Pacific Market size and forecast, by Application

      • 9.4.7 Asia-Pacific Market size and forecast, by country

        • 9.4.7.1 China
          • 9.4.7.1.1 Market size and forecast, by Offering
          • 9.4.7.1.2 Market size and forecast, by Technology
          • 9.4.7.1.3 Market size and forecast, by Spectrum
          • 9.4.7.1.4 Market size and forecast, by Installation Type
          • 9.4.7.1.5 Market size and forecast, by Application
        • 9.4.7.2 Japan
          • 9.4.7.2.1 Market size and forecast, by Offering
          • 9.4.7.2.2 Market size and forecast, by Technology
          • 9.4.7.2.3 Market size and forecast, by Spectrum
          • 9.4.7.2.4 Market size and forecast, by Installation Type
          • 9.4.7.2.5 Market size and forecast, by Application
        • 9.4.7.3 India
          • 9.4.7.3.1 Market size and forecast, by Offering
          • 9.4.7.3.2 Market size and forecast, by Technology
          • 9.4.7.3.3 Market size and forecast, by Spectrum
          • 9.4.7.3.4 Market size and forecast, by Installation Type
          • 9.4.7.3.5 Market size and forecast, by Application
        • 9.4.7.4 South Korea
          • 9.4.7.4.1 Market size and forecast, by Offering
          • 9.4.7.4.2 Market size and forecast, by Technology
          • 9.4.7.4.3 Market size and forecast, by Spectrum
          • 9.4.7.4.4 Market size and forecast, by Installation Type
          • 9.4.7.4.5 Market size and forecast, by Application
        • 9.4.7.5 Rest Of Asia Pacific
          • 9.4.7.5.1 Market size and forecast, by Offering
          • 9.4.7.5.2 Market size and forecast, by Technology
          • 9.4.7.5.3 Market size and forecast, by Spectrum
          • 9.4.7.5.4 Market size and forecast, by Installation Type
          • 9.4.7.5.5 Market size and forecast, by Application
    • 9.5 LAMEA

      • 9.5.1 Key trends and opportunities

      • 9.5.2 LAMEA Market size and forecast, by Offering

      • 9.5.3 LAMEA Market size and forecast, by Technology

      • 9.5.4 LAMEA Market size and forecast, by Spectrum

      • 9.5.5 LAMEA Market size and forecast, by Installation Type

      • 9.5.6 LAMEA Market size and forecast, by Application

      • 9.5.7 LAMEA Market size and forecast, by country

        • 9.5.7.1 Latin America
          • 9.5.7.1.1 Market size and forecast, by Offering
          • 9.5.7.1.2 Market size and forecast, by Technology
          • 9.5.7.1.3 Market size and forecast, by Spectrum
          • 9.5.7.1.4 Market size and forecast, by Installation Type
          • 9.5.7.1.5 Market size and forecast, by Application
        • 9.5.7.2 Middle East
          • 9.5.7.2.1 Market size and forecast, by Offering
          • 9.5.7.2.2 Market size and forecast, by Technology
          • 9.5.7.2.3 Market size and forecast, by Spectrum
          • 9.5.7.2.4 Market size and forecast, by Installation Type
          • 9.5.7.2.5 Market size and forecast, by Application
        • 9.5.7.3 Africa
          • 9.5.7.3.1 Market size and forecast, by Offering
          • 9.5.7.3.2 Market size and forecast, by Technology
          • 9.5.7.3.3 Market size and forecast, by Spectrum
          • 9.5.7.3.4 Market size and forecast, by Installation Type
          • 9.5.7.3.5 Market size and forecast, by Application
  • CHAPTER 10: COMPANY LANDSCAPE

    • 10.1. Introduction

    • 10.2. Top winning strategies

    • 10.3. Product Mapping of Top 10 Player

    • 10.4. Competitive Dashboard

    • 10.5. Competitive Heatmap

    • 10.6. Key developments

  • CHAPTER 11: COMPANY PROFILES

    • 11.1 bios lighting

      • 11.1.1 Company overview

      • 11.1.2 Company snapshot

      • 11.1.3 Operating business segments

      • 11.1.4 Product portfolio

      • 11.1.5 Business performance

      • 11.1.6 Key strategic moves and developments

    • 11.2 Fluence (Osram)

      • 11.2.1 Company overview

      • 11.2.2 Company snapshot

      • 11.2.3 Operating business segments

      • 11.2.4 Product portfolio

      • 11.2.5 Business performance

      • 11.2.6 Key strategic moves and developments

    • 11.3 GE Current

      • 11.3.1 Company overview

      • 11.3.2 Company snapshot

      • 11.3.3 Operating business segments

      • 11.3.4 Product portfolio

      • 11.3.5 Business performance

      • 11.3.6 Key strategic moves and developments

    • 11.4 heliospectra ab

      • 11.4.1 Company overview

      • 11.4.2 Company snapshot

      • 11.4.3 Operating business segments

      • 11.4.4 Product portfolio

      • 11.4.5 Business performance

      • 11.4.6 Key strategic moves and developments

    • 11.5 hortilux schreder

      • 11.5.1 Company overview

      • 11.5.2 Company snapshot

      • 11.5.3 Operating business segments

      • 11.5.4 Product portfolio

      • 11.5.5 Business performance

      • 11.5.6 Key strategic moves and developments

    • 11.6 Kroptek

      • 11.6.1 Company overview

      • 11.6.2 Company snapshot

      • 11.6.3 Operating business segments

      • 11.6.4 Product portfolio

      • 11.6.5 Business performance

      • 11.6.6 Key strategic moves and developments

    • 11.7 SANlight GmbH

      • 11.7.1 Company overview

      • 11.7.2 Company snapshot

      • 11.7.3 Operating business segments

      • 11.7.4 Product portfolio

      • 11.7.5 Business performance

      • 11.7.6 Key strategic moves and developments

    • 11.8 Signify N.V.

      • 11.8.1 Company overview

      • 11.8.2 Company snapshot

      • 11.8.3 Operating business segments

      • 11.8.4 Product portfolio

      • 11.8.5 Business performance

      • 11.8.6 Key strategic moves and developments

    • 11.9 valoya ltd

      • 11.9.1 Company overview

      • 11.9.2 Company snapshot

      • 11.9.3 Operating business segments

      • 11.9.4 Product portfolio

      • 11.9.5 Business performance

      • 11.9.6 Key strategic moves and developments

  • LIST OF TABLES

  • TABLE 96. ASIA-PACIFIC GROW LIGHTS MARKET, BY INSTALLATION TYPE, 2021-2031 ($MILLION)
    TABLE 97. ASIA-PACIFIC GROW LIGHTS MARKET, BY APPLICATION, 2021-2031 ($MILLION)
    TABLE 98. ASIA-PACIFIC GROW LIGHTS MARKET, BY COUNTRY, 2021-2031 ($MILLION)
    TABLE 99. CHINA GROW LIGHTS MARKET, BY OFFERING, 2021-2031 ($MILLION)
    TABLE 100. CHINA GROW LIGHTS MARKET, BY TECHNOLOGY, 2021-2031 ($MILLION)
    TABLE 105. JAPAN GROW LIGHTS MARKET, BY TECHNOLOGY, 2021-2031 ($MILLION)
    TABLE 106. JAPAN GROW LIGHTS MARKET, BY SPECTRUM, 2021-2031 ($MILLION)
    TABLE 107. JAPAN GROW LIGHTS MARKET, BY INSTALLATION TYPE, 2021-2031 ($MILLION)
    TABLE 108. JAPAN GROW LIGHTS MARKET, BY APPLICATION, 2021-2031 ($MILLION)
    TABLE 109. INDIA GROW LIGHTS MARKET, BY OFFERING, 2021-2031 ($MILLION)
    TABLE 110. INDIA GROW LIGHTS MARKET, BY TECHNOLOGY, 2021-2031 ($MILLION)
    TABLE 111. INDIA GROW LIGHTS MARKET, BY SPECTRUM, 2021-2031 ($MILLION)
    TABLE 112. INDIA GROW LIGHTS MARKET, BY INSTALLATION TYPE, 2021-2031 ($MILLION)
    TABLE 113. INDIA GROW LIGHTS MARKET, BY APPLICATION, 2021-2031 ($MILLION)
    TABLE 114. SOUTH KOREA GROW LIGHTS MARKET, BY OFFERING, 2021-2031 ($MILLION)
    TABLE 115. SOUTH KOREA GROW LIGHTS MARKET, BY TECHNOLOGY, 2021-2031 ($MILLION)
    TABLE 116. SOUTH KOREA GROW LIGHTS MARKET, BY SPECTRUM, 2021-2031 ($MILLION)
    TABLE 101. CHINA GROW LIGHTS MARKET, BY SPECTRUM, 2021-2031 ($MILLION)
    TABLE 102. CHINA GROW LIGHTS MARKET, BY INSTALLATION TYPE, 2021-2031 ($MILLION)
    TABLE 103. CHINA GROW LIGHTS MARKET, BY APPLICATION, 2021-2031 ($MILLION)
    TABLE 104. JAPAN GROW LIGHTS MARKET, BY OFFERING, 2021-2031 ($MILLION)
    TABLE 117. SOUTH KOREA GROW LIGHTS MARKET, BY INSTALLATION TYPE, 2021-2031 ($MILLION)
    TABLE 118. SOUTH KOREA GROW LIGHTS MARKET, BY APPLICATION, 2021-2031 ($MILLION)
    TABLE 119. REST OF ASIA PACIFIC GROW LIGHTS MARKET, BY OFFERING, 2021-2031 ($MILLION)
    TABLE 120. REST OF ASIA PACIFIC GROW LIGHTS MARKET, BY TECHNOLOGY, 2021-2031 ($MILLION)
    TABLE 121. REST OF ASIA PACIFIC GROW LIGHTS MARKET, BY SPECTRUM, 2021-2031 ($MILLION)
    TABLE 122. REST OF ASIA PACIFIC GROW LIGHTS MARKET, BY INSTALLATION TYPE, 2021-2031 ($MILLION)
    TABLE 123. REST OF ASIA PACIFIC GROW LIGHTS MARKET, BY APPLICATION, 2021-2031 ($MILLION)
    TABLE 124. LAMEA GROW LIGHTS MARKET, BY OFFERING, 2021-2031 ($MILLION)
    TABLE 125. LAMEA GROW LIGHTS MARKET, BY TECHNOLOGY, 2021-2031 ($MILLION)
    TABLE 126. LAMEA GROW LIGHTS MARKET, BY SPECTRUM, 2021-2031 ($MILLION)
    TABLE 127. LAMEA GROW LIGHTS MARKET, BY INSTALLATION TYPE, 2021-2031 ($MILLION)
    TABLE 128. LAMEA GROW LIGHTS MARKET, BY APPLICATION, 2021-2031 ($MILLION)
    TABLE 129. LAMEA GROW LIGHTS MARKET, BY COUNTRY, 2021-2031 ($MILLION)
    TABLE 130. LATIN AMERICA GROW LIGHTS MARKET, BY OFFERING, 2021-2031 ($MILLION)
    TABLE 131. LATIN AMERICA GROW LIGHTS MARKET, BY TECHNOLOGY, 2021-2031 ($MILLION)
    TABLE 132. LATIN AMERICA GROW LIGHTS MARKET, BY SPECTRUM, 2021-2031 ($MILLION)
    TABLE 133. LATIN AMERICA GROW LIGHTS MARKET, BY INSTALLATION TYPE, 2021-2031 ($MILLION)
    TABLE 134. LATIN AMERICA GROW LIGHTS MARKET, BY APPLICATION, 2021-2031 ($MILLION)
    TABLE 135. MIDDLE EAST GROW LIGHTS MARKET, BY OFFERING, 2021-2031 ($MILLION)
    TABLE 136. MIDDLE EAST GROW LIGHTS MARKET, BY TECHNOLOGY, 2021-2031 ($MILLION)
    TABLE 137. MIDDLE EAST GROW LIGHTS MARKET, BY SPECTRUM, 2021-2031 ($MILLION)
    TABLE 138. MIDDLE EAST GROW LIGHTS MARKET, BY INSTALLATION TYPE, 2021-2031 ($MILLION)
    TABLE 139. MIDDLE EAST GROW LIGHTS MARKET, BY APPLICATION, 2021-2031 ($MILLION)
    TABLE 140. AFRICA GROW LIGHTS MARKET, BY OFFERING, 2021-2031 ($MILLION)
    TABLE 141. AFRICA GROW LIGHTS MARKET, BY TECHNOLOGY, 2021-2031 ($MILLION)
    TABLE 142. AFRICA GROW LIGHTS MARKET, BY SPECTRUM, 2021-2031 ($MILLION)
    TABLE 143. AFRICA GROW LIGHTS MARKET, BY INSTALLATION TYPE, 2021-2031 ($MILLION)
    TABLE 144. AFRICA GROW LIGHTS MARKET, BY APPLICATION, 2021-2031 ($MILLION)
    TABLE 145.BIOS LIGHTING: COMPANY SNAPSHOT
    TABLE 146.BIOS LIGHTING: OPERATING SEGMENTS
    TABLE 147.BIOS LIGHTING: PRODUCT PORTFOLIO
    TABLE 148.BIOS LIGHTING: NET SALES,
    TABLE 149.BIOS LIGHTING: KEY STRATERGIES
    TABLE 150.FLUENCE (OSRAM): COMPANY SNAPSHOT
    TABLE 151.FLUENCE (OSRAM): OPERATING SEGMENTS
    TABLE 152.FLUENCE (OSRAM): PRODUCT PORTFOLIO
    TABLE 153.FLUENCE (OSRAM): NET SALES,
    TABLE 154.FLUENCE (OSRAM): KEY STRATERGIES
    TABLE 155.GE CURRENT: COMPANY SNAPSHOT
    TABLE 156.GE CURRENT: OPERATING SEGMENTS
    TABLE 157.GE CURRENT: PRODUCT PORTFOLIO
    TABLE 158.GE CURRENT: NET SALES,
    TABLE 159.GE CURRENT: KEY STRATERGIES
    TABLE 160.HELIOSPECTRA AB: COMPANY SNAPSHOT
    TABLE 161.HELIOSPECTRA AB: OPERATING SEGMENTS
    TABLE 162.HELIOSPECTRA AB: PRODUCT PORTFOLIO
    TABLE 163.HELIOSPECTRA AB: NET SALES,
    TABLE 164.HELIOSPECTRA AB: KEY STRATERGIES
    TABLE 165.HORTILUX SCHREDER: COMPANY SNAPSHOT
    TABLE 166.HORTILUX SCHREDER: OPERATING SEGMENTS
    TABLE 167.HORTILUX SCHREDER: PRODUCT PORTFOLIO
    TABLE 168.HORTILUX SCHREDER: NET SALES,
    TABLE 169.HORTILUX SCHREDER: KEY STRATERGIES
    TABLE 170.KROPTEK: COMPANY SNAPSHOT
    TABLE 171.KROPTEK: OPERATING SEGMENTS
    TABLE 172.KROPTEK: PRODUCT PORTFOLIO
    TABLE 173.KROPTEK: NET SALES,
    TABLE 174.KROPTEK: KEY STRATERGIES
    TABLE 175.SANLIGHT GMBH: COMPANY SNAPSHOT
    TABLE 176.SANLIGHT GMBH: OPERATING SEGMENTS
    TABLE 177.SANLIGHT GMBH: PRODUCT PORTFOLIO
    TABLE 178.SANLIGHT GMBH: NET SALES,
    TABLE 179.SANLIGHT GMBH: KEY STRATERGIES
    TABLE 180.SIGNIFY N.V.: COMPANY SNAPSHOT
    TABLE 181.SIGNIFY N.V.: OPERATING SEGMENTS
    TABLE 182.SIGNIFY N.V.: PRODUCT PORTFOLIO
    TABLE 183.SIGNIFY N.V.: NET SALES,
    TABLE 184.SIGNIFY N.V.: KEY STRATERGIES
    TABLE 185.VALOYA LTD: COMPANY SNAPSHOT
    TABLE 186.VALOYA LTD: OPERATING SEGMENTS
    TABLE 187.VALOYA LTD: PRODUCT PORTFOLIO
    TABLE 188.VALOYA LTD: NET SALES,
    TABLE 189.VALOYA LTD: KEY STRATERGIES
    TABLE 14. GROW LIGHTS MARKET FOR FLUORESCENT BY COUNTRY, 2021-2031 ($MILLION)
    TABLE 15. GROW LIGHTS MARKET SIZE, FOR OTHERS, BY REGION, 2021-2031 ($MILLION)
    TABLE 16. GROW LIGHTS MARKET FOR OTHERS BY COUNTRY, 2021-2031 ($MILLION)
    TABLE 17. GLOBAL GROW LIGHTS MARKET, BY SPECTRUM, 2021-2031 ($MILLION)
    TABLE 18. GROW LIGHTS MARKET SIZE, FOR NARROW, BY REGION, 2021-2031 ($MILLION)
    TABLE 1. GLOBAL GROW LIGHTS MARKET, BY OFFERING, 2021-2031 ($MILLION)
    TABLE 2. GROW LIGHTS MARKET SIZE, FOR HARDWARE, BY REGION, 2021-2031 ($MILLION)
    TABLE 3. GROW LIGHTS MARKET FOR HARDWARE BY COUNTRY, 2021-2031 ($MILLION)
    TABLE 4. GROW LIGHTS MARKET SIZE, FOR SOFTWARE, BY REGION, 2021-2031 ($MILLION)
    TABLE 5. GROW LIGHTS MARKET FOR SOFTWARE BY COUNTRY, 2021-2031 ($MILLION)
    TABLE 6. GROW LIGHTS MARKET SIZE, FOR SERVICES, BY REGION, 2021-2031 ($MILLION)
    TABLE 7. GROW LIGHTS MARKET FOR SERVICES BY COUNTRY, 2021-2031 ($MILLION)
    TABLE 8. GLOBAL GROW LIGHTS MARKET, BY TECHNOLOGY, 2021-2031 ($MILLION)
    TABLE 9. GROW LIGHTS MARKET SIZE, FOR HIGH INTENSITY DISCHARGE (HID), BY REGION, 2021-2031 ($MILLION)
    TABLE 10. GROW LIGHTS MARKET FOR HIGH INTENSITY DISCHARGE (HID) BY COUNTRY, 2021-2031 ($MILLION)
    TABLE 11. GROW LIGHTS MARKET SIZE, FOR LIGHT EMITTING DIODE (LED), BY REGION, 2021-2031 ($MILLION)
    TABLE 12. GROW LIGHTS MARKET FOR LIGHT EMITTING DIODE (LED) BY COUNTRY, 2021-2031 ($MILLION)
    TABLE 13. GROW LIGHTS MARKET SIZE, FOR FLUORESCENT, BY REGION, 2021-2031 ($MILLION)
    TABLE 19. GROW LIGHTS MARKET FOR NARROW BY COUNTRY, 2021-2031 ($MILLION)
    TABLE 20. GROW LIGHTS MARKET SIZE, FOR BROAD, BY REGION, 2021-2031 ($MILLION)
    TABLE 21. GROW LIGHTS MARKET FOR BROAD BY COUNTRY, 2021-2031 ($MILLION)
    TABLE 22. GLOBAL GROW LIGHTS MARKET, BY INSTALLATION TYPE, 2021-2031 ($MILLION)
    TABLE 23. GROW LIGHTS MARKET SIZE, FOR NEW INSTALLATION, BY REGION, 2021-2031 ($MILLION)
    TABLE 24. GROW LIGHTS MARKET FOR NEW INSTALLATION BY COUNTRY, 2021-2031 ($MILLION)
    TABLE 25. GROW LIGHTS MARKET SIZE, FOR RETROFIT, BY REGION, 2021-2031 ($MILLION)
    TABLE 26. GROW LIGHTS MARKET FOR RETROFIT BY COUNTRY, 2021-2031 ($MILLION)
    TABLE 27. GLOBAL GROW LIGHTS MARKET, BY APPLICATION, 2021-2031 ($MILLION)
    TABLE 28. GROW LIGHTS MARKET SIZE, FOR INDOOR FARMING, BY REGION, 2021-2031 ($MILLION)
    TABLE 29. GROW LIGHTS MARKET FOR INDOOR FARMING BY COUNTRY, 2021-2031 ($MILLION)
    TABLE 30. GROW LIGHTS MARKET SIZE, FOR COMMERCIAL GREENHOUSE, BY REGION, 2021-2031 ($MILLION)
    TABLE 31. GROW LIGHTS MARKET FOR COMMERCIAL GREENHOUSE BY COUNTRY, 2021-2031 ($MILLION)
    TABLE 32. GROW LIGHTS MARKET SIZE, FOR VERTICAL FARMING, BY REGION, 2021-2031 ($MILLION)
    TABLE 33. GROW LIGHTS MARKET FOR VERTICAL FARMING BY COUNTRY, 2021-2031 ($MILLION)
    TABLE 34. GROW LIGHTS MARKET SIZE, FOR TURF AND LANDSCAPING, BY REGION, 2021-2031 ($MILLION)
    TABLE 35. GROW LIGHTS MARKET FOR TURF AND LANDSCAPING BY COUNTRY, 2021-2031 ($MILLION)
    TABLE 36. GROW LIGHTS MARKET SIZE, FOR RESEARCH, BY REGION, 2021-2031 ($MILLION)
    TABLE 37. GROW LIGHTS MARKET FOR RESEARCH BY COUNTRY, 2021-2031 ($MILLION)
    TABLE 38. GROW LIGHTS MARKET SIZE, FOR OTHERS, BY REGION, 2021-2031 ($MILLION)
    TABLE 39. GROW LIGHTS MARKET FOR OTHERS BY COUNTRY, 2021-2031 ($MILLION)
    TABLE 40. GROW LIGHTS MARKET, BY REGION, 2021-2031 ($MILLION)
    TABLE 41. NORTH AMERICA GROW LIGHTS MARKET, BY OFFERING, 2021-2031 ($MILLION)
    TABLE 42. NORTH AMERICA GROW LIGHTS MARKET, BY TECHNOLOGY, 2021-2031 ($MILLION)
    TABLE 43. NORTH AMERICA GROW LIGHTS MARKET, BY SPECTRUM, 2021-2031 ($MILLION)
    TABLE 44. NORTH AMERICA GROW LIGHTS MARKET, BY INSTALLATION TYPE, 2021-2031 ($MILLION)
    TABLE 45. NORTH AMERICA GROW LIGHTS MARKET, BY APPLICATION, 2021-2031 ($MILLION)
    TABLE 46. NORTH AMERICA GROW LIGHTS MARKET, BY COUNTRY, 2021-2031 ($MILLION)
    TABLE 47. U.S. GROW LIGHTS MARKET, BY OFFERING, 2021-2031 ($MILLION)
    TABLE 57. MEXICO GROW LIGHTS MARKET, BY OFFERING, 2021-2031 ($MILLION)
    TABLE 58. MEXICO GROW LIGHTS MARKET, BY TECHNOLOGY, 2021-2031 ($MILLION)
    TABLE 59. MEXICO GROW LIGHTS MARKET, BY SPECTRUM, 2021-2031 ($MILLION)
    TABLE 60. MEXICO GROW LIGHTS MARKET, BY INSTALLATION TYPE, 2021-2031 ($MILLION)
    TABLE 61. MEXICO GROW LIGHTS MARKET, BY APPLICATION, 2021-2031 ($MILLION)
    TABLE 62. EUROPE GROW LIGHTS MARKET, BY OFFERING, 2021-2031 ($MILLION)
    TABLE 63. EUROPE GROW LIGHTS MARKET, BY TECHNOLOGY, 2021-2031 ($MILLION)
    TABLE 64. EUROPE GROW LIGHTS MARKET, BY SPECTRUM, 2021-2031 ($MILLION)
    TABLE 65. EUROPE GROW LIGHTS MARKET, BY INSTALLATION TYPE, 2021-2031 ($MILLION)
    TABLE 66. EUROPE GROW LIGHTS MARKET, BY APPLICATION, 2021-2031 ($MILLION)
    TABLE 67. EUROPE GROW LIGHTS MARKET, BY COUNTRY, 2021-2031 ($MILLION)
    TABLE 68. U.K. GROW LIGHTS MARKET, BY OFFERING, 2021-2031 ($MILLION)
    TABLE 69. U.K. GROW LIGHTS MARKET, BY TECHNOLOGY, 2021-2031 ($MILLION)
    TABLE 70. U.K. GROW LIGHTS MARKET, BY SPECTRUM, 2021-2031 ($MILLION)
    TABLE 71. U.K. GROW LIGHTS MARKET, BY INSTALLATION TYPE, 2021-2031 ($MILLION)
    TABLE 48. U.S. GROW LIGHTS MARKET, BY TECHNOLOGY, 2021-2031 ($MILLION)
    TABLE 49. U.S. GROW LIGHTS MARKET, BY SPECTRUM, 2021-2031 ($MILLION)
    TABLE 50. U.S. GROW LIGHTS MARKET, BY INSTALLATION TYPE, 2021-2031 ($MILLION)
    TABLE 51. U.S. GROW LIGHTS MARKET, BY APPLICATION, 2021-2031 ($MILLION)
    TABLE 52. CANADA GROW LIGHTS MARKET, BY OFFERING, 2021-2031 ($MILLION)
    TABLE 53. CANADA GROW LIGHTS MARKET, BY TECHNOLOGY, 2021-2031 ($MILLION)
    TABLE 54. CANADA GROW LIGHTS MARKET, BY SPECTRUM, 2021-2031 ($MILLION)
    TABLE 55. CANADA GROW LIGHTS MARKET, BY INSTALLATION TYPE, 2021-2031 ($MILLION)
    TABLE 56. CANADA GROW LIGHTS MARKET, BY APPLICATION, 2021-2031 ($MILLION)
    TABLE 72. U.K. GROW LIGHTS MARKET, BY APPLICATION, 2021-2031 ($MILLION)
    TABLE 73. GERMANY GROW LIGHTS MARKET, BY OFFERING, 2021-2031 ($MILLION)
    TABLE 74. GERMANY GROW LIGHTS MARKET, BY TECHNOLOGY, 2021-2031 ($MILLION)
    TABLE 75. GERMANY GROW LIGHTS MARKET, BY SPECTRUM, 2021-2031 ($MILLION)
    TABLE 76. GERMANY GROW LIGHTS MARKET, BY INSTALLATION TYPE, 2021-2031 ($MILLION)
    TABLE 77. GERMANY GROW LIGHTS MARKET, BY APPLICATION, 2021-2031 ($MILLION)
    TABLE 78. FRANCE GROW LIGHTS MARKET, BY OFFERING, 2021-2031 ($MILLION)
    TABLE 79. FRANCE GROW LIGHTS MARKET, BY TECHNOLOGY, 2021-2031 ($MILLION)
    TABLE 80. FRANCE GROW LIGHTS MARKET, BY SPECTRUM, 2021-2031 ($MILLION)
    TABLE 81. FRANCE GROW LIGHTS MARKET, BY INSTALLATION TYPE, 2021-2031 ($MILLION)
    TABLE 82. FRANCE GROW LIGHTS MARKET, BY APPLICATION, 2021-2031 ($MILLION)
    TABLE 83. ITALY GROW LIGHTS MARKET, BY OFFERING, 2021-2031 ($MILLION)
    TABLE 84. ITALY GROW LIGHTS MARKET, BY TECHNOLOGY, 2021-2031 ($MILLION)
    TABLE 85. ITALY GROW LIGHTS MARKET, BY SPECTRUM, 2021-2031 ($MILLION)
    TABLE 86. ITALY GROW LIGHTS MARKET, BY INSTALLATION TYPE, 2021-2031 ($MILLION)
    TABLE 87. ITALY GROW LIGHTS MARKET, BY APPLICATION, 2021-2031 ($MILLION)
    TABLE 88. REST OF EUROPE GROW LIGHTS MARKET, BY OFFERING, 2021-2031 ($MILLION)
    TABLE 89. REST OF EUROPE GROW LIGHTS MARKET, BY TECHNOLOGY, 2021-2031 ($MILLION)
    TABLE 90. REST OF EUROPE GROW LIGHTS MARKET, BY SPECTRUM, 2021-2031 ($MILLION)
    TABLE 91. REST OF EUROPE GROW LIGHTS MARKET, BY INSTALLATION TYPE, 2021-2031 ($MILLION)
    TABLE 92. REST OF EUROPE GROW LIGHTS MARKET, BY APPLICATION, 2021-2031 ($MILLION)
    TABLE 93. ASIA-PACIFIC GROW LIGHTS MARKET, BY OFFERING, 2021-2031 ($MILLION)
    TABLE 94. ASIA-PACIFIC GROW LIGHTS MARKET, BY TECHNOLOGY, 2021-2031 ($MILLION)
    TABLE 95. ASIA-PACIFIC GROW LIGHTS MARKET, BY SPECTRUM, 2021-2031 ($MILLION)
  • LIST OF FIGURES

  • FIGURE 1.GROW LIGHTS MARKET SEGMENTATION
    FIGURE 2.GROW LIGHTS MARKET,2021-2031
    FIGURE 3.GROW LIGHTS MARKET,2021-2031
    FIGURE 4. TOP INVESTMENT POCKETS, BY REGION
    FIGURE 5.PORTER FIVE-1
    FIGURE 6.PORTER FIVE-2
    FIGURE 7.PORTER FIVE-3
    FIGURE 8.PORTER FIVE-4
    FIGURE 9.PORTER FIVE-5
    FIGURE 10.TOP PLAYER POSITIONING
    FIGURE 11.GROW LIGHTS MARKET:DRIVERS, RESTRAINTS AND OPPORTUNITIES
    FIGURE 12.GROW LIGHTS MARKET,BY OFFERING,2021(%)
    FIGURE 13.COMPARATIVE SHARE ANALYSIS OF HARDWARE GROW LIGHTS MARKET,2021-2031(%)
    FIGURE 14.COMPARATIVE SHARE ANALYSIS OF SOFTWARE GROW LIGHTS MARKET,2021-2031(%)
    FIGURE 15.COMPARATIVE SHARE ANALYSIS OF SERVICES GROW LIGHTS MARKET,2021-2031(%)
    FIGURE 16.GROW LIGHTS MARKET,BY TECHNOLOGY,2021(%)
    FIGURE 17.COMPARATIVE SHARE ANALYSIS OF HIGH INTENSITY DISCHARGE (HID) GROW LIGHTS MARKET,2021-2031(%)
    FIGURE 18.COMPARATIVE SHARE ANALYSIS OF LIGHT EMITTING DIODE (LED) GROW LIGHTS MARKET,2021-2031(%)
    FIGURE 19.COMPARATIVE SHARE ANALYSIS OF FLUORESCENT GROW LIGHTS MARKET,2021-2031(%)
    FIGURE 20.COMPARATIVE SHARE ANALYSIS OF OTHERS GROW LIGHTS MARKET,2021-2031(%)
    FIGURE 21.GROW LIGHTS MARKET,BY SPECTRUM,2021(%)
    FIGURE 22.COMPARATIVE SHARE ANALYSIS OF NARROW GROW LIGHTS MARKET,2021-2031(%)
    FIGURE 23.COMPARATIVE SHARE ANALYSIS OF BROAD GROW LIGHTS MARKET,2021-2031(%)
    FIGURE 24.GROW LIGHTS MARKET,BY INSTALLATION TYPE,2021(%)
    FIGURE 25.COMPARATIVE SHARE ANALYSIS OF NEW INSTALLATION GROW LIGHTS MARKET,2021-2031(%)
    FIGURE 26.COMPARATIVE SHARE ANALYSIS OF RETROFIT GROW LIGHTS MARKET,2021-2031(%)
    FIGURE 27.GROW LIGHTS MARKET,BY APPLICATION,2021(%)
    FIGURE 28.COMPARATIVE SHARE ANALYSIS OF INDOOR FARMING GROW LIGHTS MARKET,2021-2031(%)
    FIGURE 29.COMPARATIVE SHARE ANALYSIS OF COMMERCIAL GREENHOUSE GROW LIGHTS MARKET,2021-2031(%)
    FIGURE 30.COMPARATIVE SHARE ANALYSIS OF VERTICAL FARMING GROW LIGHTS MARKET,2021-2031(%)
    FIGURE 31.COMPARATIVE SHARE ANALYSIS OF TURF AND LANDSCAPING GROW LIGHTS MARKET,2021-2031(%)
    FIGURE 32.COMPARATIVE SHARE ANALYSIS OF RESEARCH GROW LIGHTS MARKET,2021-2031(%)
    FIGURE 33.COMPARATIVE SHARE ANALYSIS OF OTHERS GROW LIGHTS MARKET,2021-2031(%)
    FIGURE 34.GROW LIGHTS MARKET BY REGION,2021
    FIGURE 35.U.S. GROW LIGHTS MARKET,2021-2031($MILLION)
    FIGURE 36.CANADA GROW LIGHTS MARKET,2021-2031($MILLION)
    FIGURE 37.MEXICO GROW LIGHTS MARKET,2021-2031($MILLION)
    FIGURE 38.U.K. GROW LIGHTS MARKET,2021-2031($MILLION)
    FIGURE 39.GERMANY GROW LIGHTS MARKET,2021-2031($MILLION)
    FIGURE 40.FRANCE GROW LIGHTS MARKET,2021-2031($MILLION)
    FIGURE 41.ITALY GROW LIGHTS MARKET,2021-2031($MILLION)
    FIGURE 42.REST OF EUROPE GROW LIGHTS MARKET,2021-2031($MILLION)
    FIGURE 43.CHINA GROW LIGHTS MARKET,2021-2031($MILLION)
    FIGURE 44.JAPAN GROW LIGHTS MARKET,2021-2031($MILLION)
    FIGURE 45.INDIA GROW LIGHTS MARKET,2021-2031($MILLION)
    FIGURE 46.SOUTH KOREA GROW LIGHTS MARKET,2021-2031($MILLION)
    FIGURE 47.REST OF ASIA PACIFIC GROW LIGHTS MARKET,2021-2031($MILLION)
    FIGURE 48.LATIN AMERICA GROW LIGHTS MARKET,2021-2031($MILLION)
    FIGURE 49.MIDDLE EAST GROW LIGHTS MARKET,2021-2031($MILLION)
    FIGURE 50.AFRICA GROW LIGHTS MARKET,2021-2031($MILLION)
    FIGURE 51. TOP WINNING STRATEGIES, BY YEAR
    FIGURE 52. TOP WINNING STRATEGIES, BY DEVELOPMENT
    FIGURE 53. TOP WINNING STRATEGIES, BY COMPANY
    FIGURE 54.PRODUCT MAPPING OF TOP 10 PLAYERS
    FIGURE 55.COMPETITIVE DASHBOARD
    FIGURE 56.COMPETITIVE HEATMAP OF TOP 10 KEY PLAYERS
    FIGURE 57.BIOS LIGHTING.: NET SALES ,($MILLION)
    FIGURE 58.FLUENCE (OSRAM).: NET SALES ,($MILLION)
    FIGURE 59.GE CURRENT.: NET SALES ,($MILLION)
    FIGURE 60.HELIOSPECTRA AB.: NET SALES ,($MILLION)
    FIGURE 61.HORTILUX SCHREDER.: NET SALES ,($MILLION)
    FIGURE 62.KROPTEK.: NET SALES ,($MILLION)
    FIGURE 63.SANLIGHT GMBH.: NET SALES ,($MILLION)
    FIGURE 64.SIGNIFY N.V..: NET SALES ,($MILLION)
    FIGURE 65.VALOYA LTD.: NET SALES ,($MILLION)


for less than a decade, grow lights in the horticulture industry were used mainly as research tools and novelty. Some of the biggest technical challenges in utilizing grow light efficiently for agriculture include shadowing, glaring, cleaning, and color separation. However, this is quickly changing. Prices of grow lights have considerably reduced due to various alternatives offered in the market and efficiencies have substantially increased to critical point where a lot of applications are included.

Manufacturers of grow light are working meticulously to offer customer-oriented solutions across the globe. Every project is unique in the horticulture lighting industry; and efficiency is a critical factor. Other factors include region, crop, and customer requirements. There is no exact size of grow light that fits for all stages of plants in horticulture, but having the right combination of spectrum, efficiency, and reliability are critical parameters for success as a supplier to these manufacturers. Moreover, manufacturers continue to focus on developing most efficient grow lights in visible spectrum and currently offer best products in the visible spectrum.

Surge in demand for energy saving grow lights is driving the need to enhance grow light applications such as vertical farming, indoor farming, rooftop farming and others. Moreover, prime economics, such as the U.S., China, Germany, Netherlands and Japan, plan to develop and deploy next generation grow light solutions across various sectors.

Among the analyzed regions, North America exhibits the highest adoption rate of grow lights and has been experiencing massive expansion of the market. On the other hand, Asia-Pacific is expected to grow at a faster pace, predicting lucrative growth due to emerging countries, such as China, Japan, and India, investing in these technologies. Regions, such as the Middle East and Africa, are also expected to offer new opportunities in the grow light market in future.

Globally, various key players and government agencies are investing in grow light to make them compatible with various industrial platforms. For instance, on April, 2022, BIOS joined the illuminated Partner Program with OCL Architectural Lighting. This relationship combines OCL's high-quality luminaires with BIOS SkyBlue LED Solutions' inherently stunning performance, which will be helpful in the development of BIOS's human-centric product line. In addition, in February 2022, Fluence by OSRAM launched intercanopy lighting solution, VYNE. The company's latest luminaire comes with multiple spectral options, allowing growers to balance light efficiency with crop quality and yield. All these developments across grow light showcase lucrative growth opportunities for the market growth. 

The key players profiled in the report include BIOS Lighting, Fluence (Osram), GE Current, Heliospectra AB, HORTILUX SCHRÉDER, Kroptek, SANlight GmbH, Signify N.V., Valoya and Vertically Urban.

PURCHASE OPTIONS

Call or Email us

U.S.-Canada Toll-free: +1-800-792-5285
Int'l : +1-503-894-6022
Europe : +44-845-528-1300
Email : help@alliedmarketresearch.com
 
FREQUENTLY ASKED QUESTIONS?

A. Increase in uptake of light-emitting diode (LED) and high-intensity discharge (HID) grow lights.

A. Commercial greenhouse is the leading application of Grow Lights Market.

A. At present, Europe is the largest regional market for Grow Lights

A. The global grow light market is projected to reach $27,348.3 million by 2031.

A. BIOS Lighting, Fluence (Osram), GE Current, Heliospectra AB, HORTILUX SCHRÉDER, Kroptek, SANlight GmbH, Signify N.V., Valoya, and Vertically Urban are some of the major companies.

Looking for Customization?

 Customization Request

Have a Question?

 Speak with Analyst

Any Confusion?

 Inquire Before Buying

Have a glance of the Report

  Request Sample
RELATED TAGS

Purchase Full Report of
Grow Lights Market

Start reading instantly.
This Report and over 67,068+ more Reports, Available with Avenue Library. T&C*.

  • Online Only
  • $3,456
  • Online cloud access only
  • Restricted print, copy, paste & download
  • Read only
  • Free industry update
    (Within 180 days)
  • Free report update in next update cycle
    (Jul 2023 - Jul 2024)
  • Data Pack
  • $3,840
  • Restricted to one authorized user
  • One print only
  • Available in
    Excel
  • Free industry update
    (Within 180 days)
  •   Free report update in next update cycle
    (Jul 2023 - Jul 2024)
  • Single User
  • $5,769
  • Restricted to one authorized user
  • One print only
  • Available in
    PDF
  • Free industry update
    (Within 180 days)
  •   Free report update in next update cycle
    (Jul 2023 - Jul 2024)
  • Five Users
  • $6,450
  • Limited to five authorized users
  • Print upto five copies
  • Available in
    PDF
  • Free industry update
    (Within 180 days)
  •   Free report update in next update cycle
    (Jul 2023 - Jul 2024)
  • Enterprise
    License/PDF

  • $10,995
  • Unlimited
    within
    company/enterprise
  • Available in Excel & PDF
  • Free industry update
    (Within 180 days)
  •   Free report update in next update cycle
    (Jul 2023 - Jul 2024)
  • Library
    Membership

  • $999 $ 1,175
    Per User/ Per month/ Billed annually
  • Published Content
    E-access
  • Company Profiles
    E-access
  • Newly Added Content Access
  • 10 PDF
    Downloads
  • 5 Excel Data
    Pack Downloads
  • 250 Company Profiles PDF Downloads
  • Buy Now

*Taxes/Fees, if applicable will be added during checkout. All prices in USD

RELATED REPORTS
 

Why Allied Market Research?


Infallible Methodology

To ensure high-level data integrity, accurate analysis, and impeccable forecasts

Analyst Support

For complete satisfaction

Customization

On-demand customization of scope of the report to exactly meet your needs

TARGETED MARKET VIEW

Targeted market view to provide pertinent information and save time of readers

Get fresh content delivered

Get insights on topics that are crucial for your business. Stay abreast of your interest areas.

Get Industry Data Alerts

Why Allied Market Research?

Infallible Methodology

To ensure high-level data integrity, accurate analysis, and impeccable forecasts

Analyst Support

For complete satisfaction

Customization

On-demand customization of scope of the report to exactly meet your needs

TARGETED MARKET VIEW

Targeted market view to provide pertinent information and save time of readers