
Gym Clothes Market Research, 2034
Market Introduction and Definition
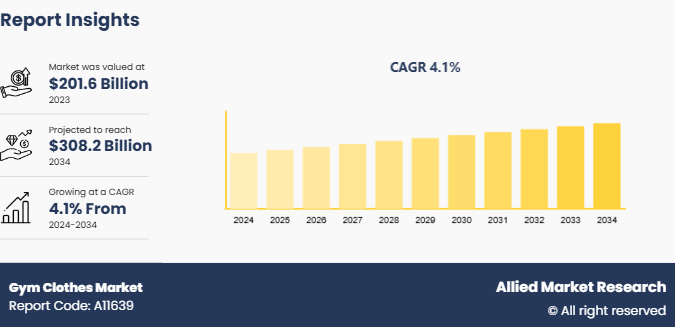
The global gym clothes market size was valued at $201.6 billion in 2023, and is projected to reach $308.2 billion by 2034, growing at a CAGR of 4.1% from 2024 to 2034. Gym clothes are specialized athletic garments designed for physical activities such as workouts, fitness training, and sports. These clothes are typically made from breathable, moisture-wicking fabrics such as polyester, spandex, and nylon, which help keep the body dry and comfortable during exercise. Wearing gym clothes provides flexibility and improves performance by allowing a full range of motion and reducing the risk of chafing and irritation. Gym clothes often include items such as T-shirts, tank tops, leggings, shorts, sports bras, and specialized footwear. These clothes contribute to better temperature regulation by promoting airflow and controlling sweat, which helps prevent overheating. In addition, well-fitted gym cloth can provide support, reduce muscle fatigue, and promote quicker recovery.
Key Takeaways
The gym clothes market study covers 20 countries. The research includes a segment analysis of each country in terms of value ($Billion) for the projected period 2024-2034.
More than 1, 500 product literatures, industry releases, annual reports, and other such documents of major gym clothes industry participants along with authentic industry journals, trade associations' releases, and government websites have been reviewed for generating high-value industry insights.
The study integrated high-quality data, professional opinions and analysis, and critical independent perspectives. The research approach is intended to provide a balanced view of global markets and to assist stakeholders in making educated decisions in order to achieve their most ambitious growth objectives.
Key Market Dynamics
The increased focus on health and fitness among global populations has significantly driven the demand for gym clothes. More people are engaging in physical activities, driven by a rise in awareness of the benefits of an active lifestyle for overall health. According to the U.S. Department of Health and Human Services, the Physical Activity Guidelines for Americans indicate that over 50% of adults meet the guidelines for aerobic physical activity. In addition, the National Health Interview Survey of CDC reported that participation in leisure-time physical activities rose by nearly 5.3% from 2010 to 2022. Thus, increased focus on fitness has led to higher investments in quality gym clothes that support comfort, performance, and style. As more individuals incorporate regular exercise into their routines, the market for specialized, functional gym clothes market share is anticipated to grow rapidly, meeting the demand for flexible, breathable, and performance-improving gym clothes.
However, the availability of counterfeit products poses a significant restraint on the gym clothes market demand by decline in brand value and consumer trust. Counterfeit items, often sold at lower prices, can attract cost-conscious customers, diverting sales from legitimate brands. These fake products typically lack the quality, durability, and performance features found in genuine gym clothes, leading to negative user experiences that may damage the reputation of established brands. Reports indicate that the global counterfeit market impacts industries substantially, with the Organization for Economic Co-operation and Development (OECD) estimating counterfeit trade at 3.3% of global trade. This prevalence in the gym clothes segment reduces revenues for authentic manufacturers and creates price competition that disrupts market stability. Moreover, combating counterfeit sales demands increases investment in anti-counterfeit measures, further straining resources for legitimate companies and affects their ability to innovate and expand their product offerings during the gym clothes market forecast.
The development of eco-friendly and sustainable gym wear has created numerous opportunities in the gym clothes market as consumers increasingly prioritize environmental responsibility. Brands incorporating sustainable practices, such as using recycled fabrics, organic cotton, and biodegradable materials, attract eco-conscious buyers. For instance, in January 2024, Adidas launched a sustainable line featuring gym wear made from recycled ocean plastics, catering to environmentally aware consumers. In September 2023, Lululemon introduced gym clothes made from plant-based fibers, reinforcing its commitment to sustainability. The move toward eco-friendly gym wear aligns with the broader aim in the fashion industry to reduce carbon footprints and promote ethical consumption. Offering sustainable options helps gym wear brands differentiate from competitors and build loyalty among environmentally focused customers. The shift in consumer preferences provides an opportunity for companies to create gym clothes that combine functionality and sustainability, meeting the expectations of consumers who value eco-friendly choices.
Value Chain of Global Gym Clothes Market

The value chain of the gym clothes market involves several key stages. Raw material suppliers provide fabrics such as cotton, polyester, nylon, and eco-friendly alternatives like recycled materials. Textile manufacturers process and weave these materials into fabric suitable for gym wear, followed by dyeing, treatment, and testing for durability and performance. Design and product development teams create prototypes, incorporating features such as moisture-wicking and breathability. Apparel manufacturers produce gym clothes in bulk, ensuring quality control. Brands or distributors manage marketing, branding, and retailing through both online and offline channels. Finally, consumers purchase gym clothes from retailers, e-commerce platforms, or directly from brand stores. Feedback from customers helps brands refine products, contributing to the overall growth of the gym clothes market.
Market Segmentation
The gym clothes market is segmented into product type, end user, distribution channel, and region. By product type, the market is classified into top wear, bottom wear, outwear, footwear, and others. By end user, the market is divided into men and women. By distribution channel, it is categorized into offline and online. Region wise, the market is analyzed across North America, Europe, Asia-Pacific, and LAMEA.
Regional/Country Market Outlook
Increase in awareness regarding health and fitness, along with a shift toward active lifestyles in North America, has led to greater participation in physical activities such as yoga, running, and fitness training. According to the International Health, Racquet & Sportsclub Association (IHRSA) , North American gym memberships have steadily risen over the past decade. Popularity of athleisure fashion, where gym clothes are worn for both workouts and casual settings, further fuels demand for gym clothes. In addition, the rise of fitness influencers on social media platforms has boosted consumer interest in high-performance, stylish gym wear. Moreover, e-commerce platforms make gym clothing products easily accessible, allowing brands to reach a wider audience. These factors, along with a growing focus on sustainability in gym clothes and active wear, contribute to the gym clothes market growth in North America.
In the Asia-Pacific region, several growth opportunities are shaping the gym clothes market. Rapid urbanization and rise in disposable incomes boost the demand for fitness-related products as more individuals adopt active lifestyles. The growing popularity of fitness centers and online workout programs, particularly in countries such as China and India, boosts the need for gym clothes market. In addition, the rise of athleisure as a fashion trend, where gym clothes are worn in casual settings, has created growth of gym clothes in the Asia-Pacific region. The growing middle class, especially in Southeast Asia, has contributed to higher demand for quality activewear. Furthermore, the focus on eco-friendly and sustainable gym wear aligns with the increasing environmental consciousness in the region, thus driving market growth.
Industry Trends:
A significant development in the gym clothes market is the introduction of thermo-regulating fabrics, which adjust to external temperatures and personal body heat. For instance, in February 2024, Decathlon, a leading European sportswear brand, launched a gym wear line incorporating phase-change materials designed to maintain consistent body temperature during physical activities. These fabrics absorb and release heat depending on the wearer’s temperature, ensuring comfort during both intense workouts and outdoor activities. This innovation helps prevent overheating or chills, improving the overall workout experience. The use of such technology in gym wear allows users to focus on performance without being distracted by discomfort caused by temperature fluctuations. Moreover, the approach to integrating smart fabric technology into activewear highlights the increase in demand for functional, performance-driven gym clothes in the global market.
Competitive Landscape
The major players operating in the gym clothes market include Nike, Inc., Adidas AG, Under Armour, Inc., Lululemon Athletica Inc., Puma SE, Reebok International Ltd., Gymshark Ltd., New Balance Athletics, Inc., ASICS Corporation, and Decathlon S.A.
Recent Key Strategies and Developments
In June 2023, Lululemon partnered with Zalando to expand its reach in Europe, offering innovative accessories and apparel, which are expected to attract millions of new customers through Zalando's platform.
In August 2023, professional basketball player Jonathan Isaac launched an athletic apparel brand aimed at conservatives and Christians, offering faith- and freedom-oriented options for Americans to align with their values.
In May 2021, Trophy Fitness Clothing, a gym wear brand for women, launched a new collection during the COVID-19 pandemic, offering apparel for women ready to adopt a more active and transformative lifestyle.
Key Benefits For Stakeholders
- This report provides a quantitative analysis of the market segments, current trends, estimations, and dynamics of the gym clothes market analysis from 2024 to 2034 to identify the prevailing gym clothes market opportunities.
- The market research is offered along with information related to key drivers, restraints, and opportunities.
- Porter's five forces analysis highlights the potency of buyers and suppliers to enable stakeholders make profit-oriented business decisions and strengthen their supplier-buyer network.
- In-depth analysis of the gym clothes market segmentation assists to determine the prevailing market opportunities.
- Major countries in each region are mapped according to their revenue contribution to the global market.
- Market player positioning facilitates benchmarking and provides a clear understanding of the present position of the market players.
- The report includes the analysis of the regional as well as global gym clothes market trends, key players, market segments, application areas, and market growth strategies.
Gym Clothes Market Report Highlights
| Aspects | Details |
| Market Size By 2034 | USD 308.2 Billion |
| Growth Rate | CAGR of 4.1% |
| Forecast period | 2024 - 2034 |
| Report Pages | 275 |
| By Product Type |
|
| By End User |
|
| By Distribution Channel |
|
| By Region |
|
| Key Market Players | Gymshark Ltd., New Balance Athletics, Inc., Nike, Inc., ASICS Corporation, Under Armour, Inc., Adidas AG, Reebok International Ltd., Decathlon S.A., Puma SE, Lululemon Athletica Inc. |
Upcoming trends in the global gym clothes market include sustainable fabrics, smart clothing, performance-enhancing designs, and personalized fitness wear.
The leading application of the gym clothes market is athletic wear for fitness activities, including gym workouts, yoga, running, and other sports.
By region, North America held the highest market share in terms of revenue in 2023.
The global gym clothes market was valued at $201.6 billion in 2023.
The major players operating in the gym clothes market include Nike, Inc., Adidas AG, Under Armour, Inc., Lululemon Athletica Inc., Puma SE, Reebok International Ltd., Gymshark Ltd., New Balance Athletics, Inc., ASICS Corporation, and Decathlon S.A.
Loading Table Of Content...

