
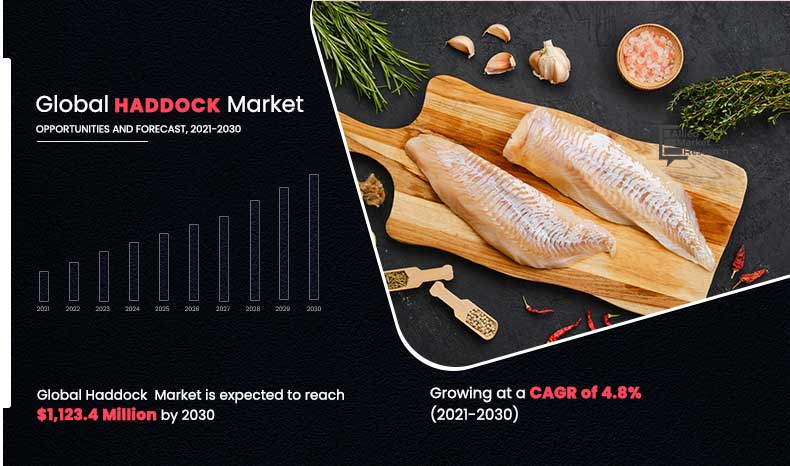
The Haddock market size was valued at $679.2 million in 2020 and is estimated to reach $ 1,123.4 million by 2030, registering a CAGR of 4.8% from 2021 to 2030. Growth in demand for processed seafood and production of haddock is expected to propel growth of the haddock market during the forecast period. Haddock is one of the favorite fish species and is majorly consumed in the UK and Ireland. It is similar to cod and is majorly found in the North Atlantic Ocean. These fish were commonly fished in Northern Europe and imported as market fresh or frozen.
Popularity of haddock has increased and its consumption is gradually increasing, owing to its nutritional value as it is richer in vitamins A, B12, B6, and B3. Haddock is majorly preferred over other seafood as it is low in calorie, has no carbohydrates, and is suitable for people with diabetes or people following a low carbohydrate diet.
The market is segmented into type, distribution channel, and region. On the basis of type, the market is categorized into fresh, frozen, and smoked. By distribution channel, it is segmented into retail stores, supermarkets/hypermarkets, food service, online sales, and others. Region wise, it is analyzed across North America (the U.S. and Canada), Europe (the UK, Ireland, Russia, Poland, Germany, Norway, France, Netherlands, Sweden, Denmark, and rest of Europe), Asia-Pacific (China, Vietnam, Singapore, Japan, Australia, and rest of Asia-Pacific), and LAMEA (Latin America, the Middle East, and Africa)
By Type
Fresh segment helds the major share of 46.2% in 2020
According to the haddock market analysis, on the basis of type, the fresh segment is estimated to reach $469.6 million by 2030, at a CAGR of 3.8%. The fresh segment has been gaining major traction among consumers, and is expected to sustain its traction throughout the haddock market forecast period. Fresh haddock are not been preserved, cured, or frozen. They are generally sold without any processing. Growth of the market is attributed to increase in awareness of health benefits regarding haddock and change in lifestyle of consumers. Local producers of haddock including Canada sell fresh haddock in the Canada market as haddock losses its nutritional value over time, so it is supposed to be eaten quickly. Thus, above mentioned factors are attributable for the haddock market growth through the fresh segment.
According to the haddock market trends, on the basis of distribution channel, the retail stores segment was the significant contributor to the market, with $228.8 million in 2020, and is projected grow at a CAGR of 297.9% during the forecast period. Hypermarkets/supermarkets is gaining popularity, owing to availability of a broad range of food including seafood under a single roof, ample parking space, and convenient operation timings. Moreover, increase in urbanization, rise in working class population, and competitive pricing boosts popularity of hypermarkets in developed and developing regions. Furthermore, hypermarkets/supermarkets are highly equipped with cold storage and are connected with internet of things, which helps to manage their inventory and facilitates to showcase their products to consumers. People are expected to find haddock in the hypermarket/supermarket as haddock is very rare and premium category fish. Thus above mentioned attributes are expected to propel growth of the market through hypermarket/supermarket segment.
By Distribution Channel
Retail Stores segment helds the major share of 33.7% in 2020
According to the haddock market opportunities, region wise, Asia-Pacific garnered a second highest share in the haddock market in 2020, and is expected to maintain its share throughout forecast period. China has been gaining major traction for the haddock market, and is expected sustain its traction during the forecast period. China holds highest share in exporting haddock to other countries including the U.S., South Korea, Japan, and other European countries. Rise in middle class population in China, Japan, and other developing countries drives demand for higher-value western seafood such as haddock. Furthermore, growth of frozen and smoked haddock expanded sales channels and a strong preference for environmentally friendly packaged products.
The players operating in the global market have adopted various developmental strategies to expand their market share, increase profitability, and remain competitive in the market. The key players profiled in this report include Channel Fish Processing, Channel Seafoods International, CTLE Seafood, Inc., Holmes Seafood, Hottlet Frozen Foods, Marz Seafood, Ocean More Foods Co., Limited, Polar Seafood Greenland A/S, Seacore Seafood Inc., and The Fish Company.
By Region
Europe region helds the major share of 45.1% in 2020
Key Benefits For Stakeholders
- The report provides a quantitative analysis of the current trends, estimations, and dynamics of the market size from 2020–2030 to identify the prevailing opportunities.
- Porter’s five forces analysis highlights the potency of buyers and suppliers to enable stakeholders to make profit-oriented business decisions and strengthen their supplier–buyer network.
- In-depth analysis and the market size and segmentation assist to determine the prevailing market opportunities.
- The major countries in each region are mapped according to their revenue contribution to the haddock market share.
- The market player positioning segment facilitates benchmarking and provides a clear understanding of the present position of the market players in the haddock industry.
Haddock Market Report Highlights
| Aspects | Details |
| By Type |
|
| By Distribution Channel |
|
| By Region |
|
Analyst Review
According to CXOs, increase in disposable income and dynamic changes in food habits around the world, propels consumer demand for unique cuisines. As a result, customers are more inclined toward premium food products, which propels the market growth.
Currently, Europe is the largest market and has been witnessing huge demand for haddock. One of the major reasons contributing toward growth of the haddock market is health benefits such as it prevents irregular heart beat and combats high blood pressure. Haddock is a rich source of minerals that help to build bone strength and regulate heart rate.
On the other hand, CXOs are concerned about increasing demand-supply gap, which leads to price fluctuation of haddock in the global market. However, CXOs are very optimistic about the rising demand of haddock in the food service sector, such as hotel, restaurants, and Quick service restaurant (QSR). This in turn fosters the market growth.
According to the pessimistic view for the impact of COVID-19 for haddock market, growing cases of the COVID-19 are expected to impel countries to shut down their boundaries, which subsequently slowed down trade activities. Lockdown due to third wave of the COVID-19 is once again hard hitting the food service sector, which is likely to slow down growth of the haddock market during the forecast period.
The Haddock market size was valued at $679.2 million in 2020 and is estimated to reach $ 1,123.4 million by 2030
The global Haddock market is projected to grow at a compound annual growth rate of 4.8% from 2021 to 2030 $ 1,123.4 million by 2030
The key players profiled in this report include Channel Fish Processing, Channel Seafoods International, CTLE Seafood, Inc., Holmes Seafood, Hottlet Frozen Foods, Marz Seafood, Ocean More Foods Co., Limited, Polar Seafood Greenland A/S, Seacore Seafood Inc., and The Fish Company.
Europe region helds the major share
Rise in fish production to meet food supply, surge in demand for nutritious diet, and technological advancements in the field of fish harvesting/aquaculture drive the growth of the global haddock market.
Loading Table Of Content...

