
Hand Wash Market Research, 2033
Market Introduction and Definition
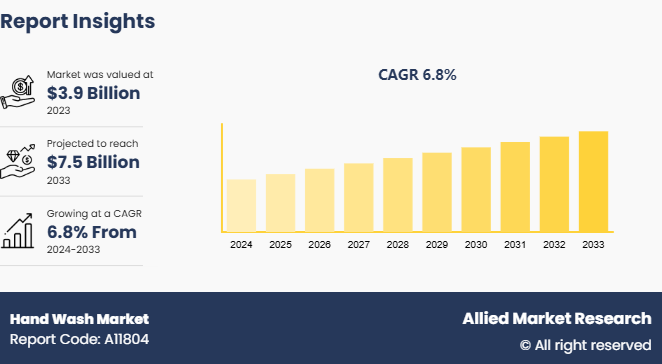
The global hand wash market size was valued at $3.9 billion in 2023, and is projected to reach $7.5 billion by 2033, growing at a CAGR of 6.8% from 2024 to 2033. The hand wash market includes products made to cleanse hands and stop bacteria and germs from spreading. It encompasses a variety of formulations, including foams, gels, and liquid soaps; they are frequently enhanced with moisturizing, antibacterial, or fragrant substances. Hand wash products are used to attract customers who are concerned about hygiene in residential, commercial, and healthcare environments. Global public health initiatives, shifting hygiene practices, and rising health consciousness have all contributed to the market's significant expansion. Growing concerns about infectious diseases like COVID-19 have increased the need for efficient hand wash products. Producing eco-friendly packaging, natural ingredients, and skin-friendly formulae, manufacturers prioritize innovation while catering to a broad consumer base that values sustainability and wellness.
Key Takeaways
- The hand wash market study covers 20 countries. The research includes a segment analysis of each country in terms of value for the projected period.
- More than 1, 500 product literature, industry releases, annual reports, and other such documents of major hand wash industry participants along with authentic industry journals, trade associations' releases, and government websites have been reviewed for generating high-value industry insights.
- The study integrated high-quality data, professional opinions and analysis, and critical independent perspectives. The research approach is intended to provide a balanced view of global markets and to assist stakeholders in making educated decisions in order to achieve their most ambitious growth objectives.
Key market dynamics
The need for hand wash products has increased significantly as a result of consumers' growing health and hygiene consciousness, particularly in the wake of COVID-19. Consumer demand for hand hygiene products has increased as a result of the World Health Organization's (WHO) emphasis on hand hygiene as a crucial strategy in reducing the spread of disease. Furthermore, the proliferation of e-commerce has increased customer accessibility to hand wash products, hence increasing online sales and facilitating convenience. Retailers are getting more online exposure so that customers may buy a variety of hand wash solutions from the comfort of their homes.
As consumers get increasingly particular about ingredients, the market is also seeing a trend towards natural and organic products. Industry innovators are responding to consumer demand for safer, more ecologically friendly formulations by introducing plant-based alternatives. The increasing focus on sustainability and the trend toward eco-friendly packaging and production methods are in line with each other. Furthermore, as more people are ready to spend more on visually beautiful and fragrant products that improve their personal care routines, the market for luxury and premium hand wash products is growing.
Regulations about product safety and quality are becoming more stringent, which is forcing producers to guarantee compliance and improve product quality and trust among consumers. Additionally, seasonal patterns have an impact on the market, with hand wash market demand being highest in the winter and during flu seasons. The market is expected to increase steadily due to innovation, quality-driven focus, and the incorporation of sustainability into product offerings, as customer preferences and awareness continue to shift.
Parent Market Overview of the Global Hand Wash Market
A crucial sector of the broader personal care and hygiene industry, the global market is being driven by rising health consciousness and attention to sanitation. This market includes a wide range of products, such as foam washes, antibacterial gels, and liquid soaps. Hand wash market growth has been accelerated by an increase in demand for efficient hygiene solutions, especially during and after the COVID-19 pandemic. Furthermore, evolving consumer preferences for natural and eco-friendly products are influencing the range of products available. Innovations in formulations and packaging, along with a focus on sustainability, define the market. Thus, the hand wash sector represents a crucial aspect of personal care trends and public health initiatives, offering producers and stakeholders a great deal of opportunity.
Market Segmentation
The hand wash market is segmented into product, end user, sales channel, and region. On the basis of product, the market is divided into ordinary hand wash and waterless hand wash. As per end user, the market is classified into commercial, residential, and industrial. On the basis of sales channel, the market is segregated into pharmacy stores, supermarket/hypermarket, online channels, and others. Region-wise, the market is analyzed across North America, Europe, Asia-Pacific, and LAMEA.
Regional/Country Market Outlook
North America occupies a significant hand wash market share driven by a strong consumer focus on health and hygiene. A variety of product offerings, such as liquid soaps, foams, and gel sanitizers, are particularly beneficial to the U.S. market. With nations like Germany and the UK highlighting natural and eco-friendly chemicals in their hand wash formulas, the industry is similarly expanding throughout Europe. An increase in consumer preferences toward sustainability is being observed in the region, with a shift towards luxury items.
The demand for hand hygiene products has increased significantly in Asia-Pacific as a result of the region's rapid urbanization and rising disposable income. Government campaigns to promote cleanliness are driving significant increases in home and business consumption in countries like China and India. Additionally, growing awareness of health standards in developing countries is driving market expansion.
A developing market exists throughout the Middle East and Africa, especially in metropolitan areas where there is a growing need for personal hygiene goods. The market is defined by a combination of domestic and foreign brands that serve different customer segments, such as luxury and budget-conscious consumers.
As a result, the demand for sustainable solutions, product innovation, and increased health consciousness are all contributing to the hand wash market's strong global expansion. With substantial prospects across many geographies, the market is anticipated to continue evolving as consumers become more conscious of the significance of hand hygiene.
Industry Trends:
- Procter & Gamble introduced a new range of environmentally friendly hand soaps under the Method brand in July 2024. This project seeks to satisfy the rising demand from customers for environmentally friendly and biodegradable goods. The company extended its production facilities, which improved its market presence in the natural personal care industry to handle this new product line.
- Unilever purchased Huangtian, a local cosmetics firm that specializes in natural and organic hand wash products, in June 2024. Through this acquisition, Unilever will be able to broaden its line of luxury hand wash products and capitalize on China's expanding eco-conscious consumer trend. It is anticipated that the acquisition will greatly increase Unilever's market share in the area.
- Reckitt Benckiser announced in August 2024 that it will increase its production capacity in India to fulfill the growing demand for hand hygiene products. With a new hand wash line that targets both urban and rural markets, the business offers enhanced antibacterial formulations. Reckitt's larger plan to increase its market share in the Asia-Pacific area in the face of rising health consciousness includes this expansion.
Competitive Landscape
The major players operating in the hand wash market include Unilever, Procter & Gamble, Johnson & Johnson Services, Inc., Reckitt Benckiser, Lion Corporation, The Caldrea Company, Henkel Corporation, 3M, Medline Industries, Inc., and Amway.
Recent Key Strategies and Developments
- In October 2021, Reckitt Benckiser Group PLC launched a range of foamy hand wash products. There are two fragrances available for the product: aloe coconut and strawberry.
- In September 2022, INEOS introduced a cost-effective hand wash solution in the United States and Europe. The launch of the new product will help the company increase income and sales.
- In April 2023, Reckitt Benckiser Group PLC encouraged consumers to use more hand wash liquid instead of soap in a recent campaign. The latest improved moisture seal formula softens the hand and has a nice fragrance.
Key Benefits For Stakeholders
- This report provides a quantitative analysis of the market segments, current trends, estimations, and dynamics of the hand wash market analysis from 2024 to 2033 to identify the prevailing hand wash market opportunities.
- The market research is offered along with information related to key drivers, restraints, and opportunities.
- Porter's five forces analysis highlights the potency of buyers and suppliers to enable stakeholders make profit-oriented business decisions and strengthen their supplier-buyer network.
- In-depth analysis of the hand wash market segmentation assists to determine the prevailing market opportunities.
- Major countries in each region are mapped according to their revenue contribution to the global market.
- Market player positioning facilitates benchmarking and provides a clear understanding of the present position of the market players.
- The report includes the analysis of the regional as well as global hand wash market trends, key players, market segments, application areas, and market growth strategies.
Hand Wash Market Report Highlights
| Aspects | Details |
| Market Size By 2033 | USD 7.5 Billion |
| Growth Rate | CAGR of 6.8% |
| Forecast period | 2024 - 2033 |
| Report Pages | 250 |
| By Product |
|
| By End User |
|
| By Sales Channel |
|
| By Region |
|
| Key Market Players | Johnson & Johnson Services, Inc., Unilever Group, Medline Industries, Inc., Henkel Corporation, Amway, reckitt benckiser, The Caldrea Company, Procter & Gamble, Lion Corporation. |
Consumers are increasingly leaning towards eco-friendly and sustainable hand wash options. This includes products with biodegradable packaging, plant-based ingredients, and certifications like cruelty-free or vegan.
The leading application of the hand wash market is **residential use**, driven by increased hygiene awareness, regular handwashing habits, and demand for convenient, skin-friendly, and effective formulations in households globally.
The **Asia-Pacific region** is the largest market for hand wash, driven by its high population, increasing hygiene awareness, urbanization, and the growing availability of affordable and premium products.
The hand wash market was valued at $3.9 billion in 2023, and is estimated to reach $7.5 billion by 2033, growing at a CAGR of 6.8% from 2024 to 2033.
The major players operating in the hand wash market include Unilever, Procter & Gamble, Johnson & Johnson Services, Inc., Reckitt Benckiser, Lion Corporation, The Caldrea Company, Henkel Corporation, 3M, Medline Industries, Inc., and Amway.
Loading Table Of Content...

