Report Code: A11332 | May 2021 | Pages: 309 | ||
Tables: 200 | Charts: 85 |
|
Pandemic disrupted the entire world and affected many industries.
Get detailed COVID-19 impact analysis on the Healthcare Barcode Reader Market
Request Now !
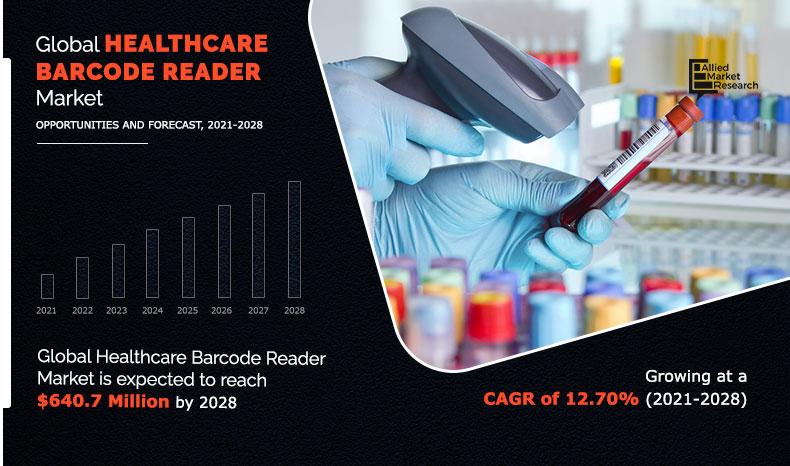
The global healthcare barcode reader market size was valued at $260.9 million in 2019, and is projected to reach $640.7 million by 2028, registering a CAGR of 12.7% from 2021 to 2028. Barcode reader is a device that helps in extracting the information and data from the barcode, and transmits it to the computer in a hospital or healthcare facility. It allows individuals to access classified information and data. Increase in trends and technologies along with reduced data errors led to rise in the growth of barcode reader in healthcare. The barcode reader has a significant adoption rate in healthcare due to its advantages such as increased patient safety and reduction of human error.
Mobile Barcode reader segment impacted positively, due to COVID - 19.
Furthermore, technological advancements such as use of internet connectivity have enabled real-time surveillance at remote and critical locations with enhanced accuracy. These devices are cost-effective and help reduce errors. Moreover, easy integration has resulted in increase in use of intrusion detection systems across the globe, these systems help verify the identity of an individual and allow healthcare authority to access the information. This further drives the healthcare barcode reader market growth.
Healthcare barcode reader is used for scanning to get accurate data and information of the patients with unique barcode tags. Increase in digitalization with penetration of advanced technologies is expected to drive the growth of the healthcare barcode reader market. The barcode reader systems have a significant adoption rate in healthcare due to its key factors such as accuracy, safety, and efficiency, which is anticipated to fuel the market growth.
The healthcare barcode reader market size is segmented on the basis of type, product type, connectivity, application, and region. By type, the healthcare barcode reader market is divided into 1D and 2D. By product type, it is categorized into fixed barcode reader and mobile barcode reader. By connectivity, it is divided into wired and wireless. By application, it is segmented into in vitro diagnostics, access tracking, surgical, patient monitoring, and drug dispensing. By region, the market is studied across North America, Europe, Asia-Pacific, and LAMEA along with its prominent countries.
The key players profiled in the healthcare barcode reader industry include Honeywell, Zebra, Cognex, Sato, Toshiba, Wasp, Datalogic, Scandit, Juniper, Bluebird, Denso, NCR, Opticon, Sick, Microscan, JC Square, and Keyence. These key players have adopted strategies, such as product portfolio expansion, mergers & acquisitions, agreements, geographical expansion, and collaborations, to enhance their barcode reader market forecast and penetration.
The ongoing spread of COVID-19 has become one of the biggest threats to the global economy and is causing widespread concerns and economic hardship for consumers, businesses, and communities across the globe. The “New Normal” that includes social distance and working from home has created challenges with daily activities, regular work, needs, and supplies, causing delayed initiatives, and missed opportunities.
The COVID-19 pandemic is impacting the society and overall economy across the global. The impact of this outbreak is growing day-by-day as well as affecting the supply chain. It is creating uncertainty in the stock market, falling business confidence, massive slowing of supply chain, and increasing panic among customers. European countries under lockdowns have suffered a major loss of business and revenue due to shutdown of manufacturing units in the region. Operations of production and manufacturing industries have been heavily impacted by the outbreak of COVID-19; which has led to slowdown in growth of the healthcare barcode reader market in 2020.
According to the healthcare barcode reader market analysis, COVID-19 has severely impacted the global manufacturing and industrial sector as production facilities have stalled, which, in turn, have led to significant demand in industries. Emergence of COVID-19 has forced the security organizations to change the way they operate. It has led to critical medical emergency; therefore, increase in demand for barcode readers has been witnessed from the healthcare sector as it is an effective tool for access control that allows contactless identity checks.
The factors that drive the growth of the healthcare barcode reader market share include extensive patient safety and preventing medication errors.
Barcode technology has a significant share in the market, owing to several choices available to the consumer such as 1D and 2D. To maintain the medical records and medication of the patient, also increasing need of security and safety is boosting the healthcare barcode reader globally.
Widespread use of barcode reader by doctors, nurses, and medical staffs to improve safety and maintain error-free records drives the global healthcare barcode reader market growth. Hospitals and medical institutes are installing barcode reader devices for checking and maintaining patient’s record and medication for proper treatment and analysis.
New technologies in barcode reader have increased the growth of the devices like introduction of 2D and 3D type of readers. Ease of installation and ease of handling is one of the major advancements. Development of handheld, portable, and mobile barcode readers has further increased the demand for the healthcare barcode reader market.
Key Benefits For Stakeholders
Healthcare Barcode Market Key Segments
By Type
By Product Type
By Connectivity
By Application
By Region
Key Market Players
Healthcare Barcode Reader Market Report Highlights
Aspects | Details |
---|---|
By Type |
|
By Product Type |
|
By Connectivity |
|
By Application |
|
By Region |
|
Key Market Players | Denso, Keyence, JC Square, Scandit, Datalogic, Juniper, Zebra, Sick, Toshiba, Microscan, Wasp, Bluebird, Honeywell, NCR, Opticon, Sato, Cognex |
CHAPTER 1:INTRODUCTION
1.1.REPORT DESCRIPTION
1.2.KEY BENEFITS FOR STAKEHOLDERS
1.3.KEY MARKET SEGMENTS
1.4.RESEARCH METHODOLOGY
1.4.1.Primary research
1.4.2.Secondary research
1.4.3.Analyst tools and models
CHAPTER 2:EXECUTIVE SUMMARY
2.1.CXO PERSPECTIVE
CHAPTER 3:MARKET OVERVIEW
3.1.MARKET DEFINITION AND SCOPE
3.2.KEY FINDINGS
3.2.1.Top Investment Pockets
3.2.2.Top Winning Strategies
3.3.PORTER’S FIVE FORCES ANALYSIS
3.4.MARKET DYNAMICS
3.4.1.Drivers
3.4.1.1.Increase in demand for wireless healthcare barcode reader
3.4.1.2.Increased patient safety
3.4.1.3.Reduction in human errors
3.4.2.Restraint
3.4.2.1.Line of sight barcode scanning
3.4.3.Opportunities
3.4.3.1.Development of advanced technologies
3.5.COVID IMPACT
3.5.1.Impact on market size
3.5.2.End user trends, preferences, and budget impact
3.6.MARKET SHARE ANALYSIS, 2019
3.7.PRODUCT PRICING TRENDS
CHAPTER 4:GLOBAL HEALTHCARE BARCODE READER MARKET, BY TYPE
4.1.OVERVIEW
4.2.1D
4.2.1.Key market trends, growth factors, and opportunities
4.2.2.Market size and forecast, by region
4.2.3.Market analysis, by country
4.3.2D
4.3.1.Key market trends, growth factors, and opportunities
4.3.2.Market size and forecast, by region
4.3.3.Market analysis, by country
CHAPTER 5:GLOBAL HEALTHCARE BARCODE READER MARKET, BY PRODUCT TYPE
5.1.OVERVIEW
5.2.FIXED
5.2.1.Key market trends, growth factors, and opportunities
5.2.2.Market size and forecast, by region
5.2.3.Market analysis, by country
5.3.MOBILE
5.3.1.Key market trends, growth factors, and opportunities
5.3.2.Market size and forecast, by region
5.3.3.Market analysis, by country
CHAPTER 6:GLOBAL HEALTHCARE BARCODE READER MARKET, BY CONNECTIVITY
6.1.OVERVIEW
6.2.WIRED
6.2.1.Key market trends, growth factors, and opportunities
6.2.2.Market size and forecast, by region
6.2.3.Market analysis, by country
6.3.WIRELESS
6.3.1.Key market trends, growth factors, and opportunities
6.3.2.Market size and forecast, by region
6.3.3.Market analysis, by country
CHAPTER 7:GLOBAL HEALTHCARE BARCODE READER MARKET, BY APPLICATION
7.1.OVERVIEW
7.2.IN VITRO DIAGNOSTICS
7.2.1.Key market trends, growth factors, and opportunities
7.2.2.Market size and forecast, by region
7.2.3.Market analysis, by country
7.2.4.Pre-analytical
7.2.5.Analytical
7.3.ACCESS TRACKING
7.3.1.Key market trends, growth factors, and opportunities
7.3.2.Market size and forecast, by region
7.3.3.Market analysis, by country
7.3.4.Medical
7.3.5.Industrial
7.4.SURGICAL
7.4.1.Key market trends, growth factors, and opportunities
7.4.2.Market size and forecast, by region
7.4.3.Market analysis, by country
7.4.4.Tracking
7.4.5.Navigation
7.4.6.Visualization
7.5.PATIENT MONITORING
7.5.1.Key market trends, growth factors, and opportunities
7.5.2.Market size and forecast, by region
7.5.3.Market analysis, by country
7.6.DRUG DISPENSING
7.6.1.Key market trends, growth factors, and opportunities
7.6.2.Market size and forecast, by region
7.6.3.Market analysis, by country
CHAPTER 8:HEALTHCARE BARCODE READER MARKET, BY REGION
8.1.OVERVIEW
8.2.NORTH AMERICA
8.2.1.Key market trends, growth factors, and opportunities
8.2.2.Market size and forecast, by type
8.2.3.Market size and forecast, by product type
8.2.4.Market size and forecast, by connectivity
8.2.5.Market size and forecast, by application
8.2.6.Market analysis, by country
8.2.6.1.U.S.
8.2.6.1.1.Market size and forecast, by type
8.2.6.1.2.Market size and forecast, by product type
8.2.6.1.3.Market size and forecast, by connectivity
8.2.6.1.4.Market size and forecast, by application
8.2.6.2.Canada
8.2.6.2.1.Market size and forecast, by type
8.2.6.2.2.Market size and forecast, by product type
8.2.6.2.3.Market size and forecast, by connectivity
8.2.6.2.4.Market size and forecast, by application
8.2.6.3.Mexico
8.2.6.3.1.Market size and forecast, by type
8.2.6.3.2.Market size and forecast, product type
8.2.6.3.3.Market size and forecast, by connectivity
8.2.6.3.4.Market size and forecast, by application
8.3.EUROPE
8.3.1.Key market trends, growth factors, and opportunities
8.3.2.Market size and forecast, by type
8.3.3.Market size and forecast, by product type
8.3.4.Market size and forecast, by connectivity
8.3.5.Market size and forecast, by application
8.3.6.Market analysis, by country
8.3.6.1.Germany
8.3.6.1.1.Market size and forecast, by type
8.3.6.1.2.Market size and forecast, by product type
8.3.6.1.3.Market size and forecast, by connectivity
8.3.6.1.4.Market size and forecast, by application
8.3.6.2.UK
8.3.6.2.1.Market size and forecast, by type
8.3.6.2.2.Market size and forecast, by product type
8.3.6.2.3.Market size and forecast, by connectivity
8.3.6.2.4.Market size and forecast, by application
8.3.6.3.France
8.3.6.3.1.Market size and forecast, by type
8.3.6.3.2.Market size and forecast, by product type
8.3.6.3.3.Market size and forecast, by connectivity
8.3.6.3.4.Market size and forecast, by application
8.3.6.4.Italy
8.3.6.4.1.Market size and forecast, by type
8.3.6.4.2.Market size and forecast, by product type
8.3.6.4.3.Market size and forecast, by connectivity
8.3.6.4.4.Market size and forecast, by application
8.3.6.5.Rest of Europe
8.3.6.5.1.Market size and forecast, by type
8.3.6.5.2.Market size and forecast, by product type
8.3.6.5.3.Market size and forecast, by connectivity
8.3.6.5.4.Market size and forecast, by application
8.4.ASIA-PACIFIC
8.4.1.Key market trends, growth factors, and opportunities
8.4.2.Market size and forecast, by type
8.4.3.Market size and forecast, by product type
8.4.4.Market size and forecast, by connectivity
8.4.5.Market size and forecast, by application
8.4.6.Market analysis, by country
8.4.6.1.China
8.4.6.1.1.Market size and forecast, by type
8.4.6.1.2.Market size and forecast, by product type
8.4.6.1.3.Market size and forecast, by connectivity
8.4.6.1.4.Market size and forecast, by application
8.4.6.2.Japan
8.4.6.2.1.Market size and forecast, by type
8.4.6.2.2.Market size and forecast, by product type
8.4.6.2.3.Market size and forecast, by connectivity
8.4.6.2.4.Market size and forecast, by application
8.4.6.3.India
8.4.6.3.1.Market size and forecast, by type
8.4.6.3.2.Market size and forecast, by product type
8.4.6.3.3.Market size and forecast, by connectivity
8.4.6.3.4.Market size and forecast, by application
8.4.6.4.South Korea
8.4.6.4.1.Market size and forecast, by type
8.4.6.4.2.Market size and forecast, by product type
8.4.6.4.3.Market size and forecast, by connectivity
8.4.6.4.4.Market size and forecast, by application
8.4.6.5.Rest of Asia-Pacific
8.4.6.5.1.Market size and forecast, by type
8.4.6.5.2.Market size and forecast, by product type
8.4.6.5.3.Market size and forecast, by connectivity
8.4.6.5.4.Market size and forecast, by application
8.5.LAMEA
8.5.1.Key market trends, growth factors, and opportunities
8.5.2.Market size and forecast, by type
8.5.3.Market size and forecast, by product type
8.5.4.Market size and forecast, by connectivity
8.5.5.Market size and forecast, by application
8.5.6.Market analysis, by country
8.5.6.1.Latin America
8.5.6.1.1.Market size and forecast, by type
8.5.6.1.2.Market size and forecast, by product type
8.5.6.1.3.Market size and forecast, by connectivity
8.5.6.1.4.Market size and forecast, by connectivity
8.5.6.2.Middle East
8.5.6.2.1.Market size and forecast, by type
8.5.6.2.2.Market size and forecast, by product type
8.5.6.2.3.Market size and forecast, by connectivity
8.5.6.2.4.Market size and forecast, by application
8.5.6.3.Africa
8.5.6.3.1.Market size and forecast, by type
8.5.6.3.2.Market size and forecast, by product type
8.5.6.3.3.Market size and forecast, by connectivity
8.5.6.3.4.Market size and forecast, by application
CHAPTER 9:COMPANY PROFILES
9.1.BLUEBIRD
9.1.1.Company overview
9.1.2.Key executives
9.1.3.Company snapshot
9.1.4.SWOT analysis
9.1.5.Operating business segments
9.1.6.Product portfolio
9.1.7.Key strategic moves and developments
9.2.COGNEX
9.2.1.Company overview
9.2.2.Key executives
9.2.3.Company snapshot
9.2.4.SWOT analysis
9.2.5.Operating business segments
9.2.6.Product portfolio
9.2.7.R&D expenditure
9.2.8.Business performance
9.2.9.Key strategic moves and developments
9.3.DATALOGIC
9.3.1.Company overview
9.3.2.Key executives
9.3.3.Company snapshot
9.3.4.SWOT analysis
9.3.5.Operating business segments
9.3.6.Product portfolio
9.3.7.R&D expenditure
9.3.8.Business performance
9.3.9.Key strategic moves and developments
9.4.DENSO
9.4.1.Company overview
9.4.2.Key executives
9.4.3.Company snapshot
9.4.4.SWOT analysis
9.4.5.Operating business segments
9.4.6.Product portfolio
9.4.7.Key strategic moves and developments
9.5.HONEYWELL
9.5.1.Company overview
9.5.2.Key executives
9.5.3.Company snapshot
9.5.4.SWOT analysis
9.5.5.Operating business segments
9.5.6.Product portfolio
9.5.7.R&D expenditure
9.5.8.Business performance
9.5.9.Key strategic moves and developments
9.6.JC SQUARE
9.6.1.Company overview
9.6.2.Key executives
9.6.3.Company snapshot
9.6.4.SWOT analysis
9.6.5.Operating business segments
9.6.6.Product portfolio
9.6.7.Key strategic moves and developments
9.7.JUNIPER
9.7.1.Company overview
9.7.2.Key executives
9.7.3.Company snapshot
9.7.4.SWOT analysis
9.7.5.Operating business segments
9.7.6.Product portfolio
9.7.7.Key strategic moves and developments
9.8.KEYENCE
9.8.1.Company overview
9.8.2.Key executives
9.8.3.Company snapshot
9.8.4.SWOT analysis
9.8.5.Operating business segments
9.8.6.Product portfolio
9.8.7.R&D expenditure
9.8.8.Business performance
9.8.9.Key strategic moves and developments
9.9.MICROSCAN (OMRON)
9.9.1.Company overview
9.9.2.Key executives
9.9.3.Company snapshot
9.9.4.SWOT analysis
9.9.5.Operating business segments
9.9.6.Product portfolio
9.9.7.R&D expenditure
9.9.8.Business performance
9.9.9.Key strategic moves and developments
9.10.NCR
9.10.1.Company overview
9.10.2.Key executives
9.10.3.Company snapshot
9.10.4.SWOT analysis
9.10.5.Operating business segments
9.10.6.Product portfolio
9.10.7.R&D expenditure
9.10.8.Business performance
9.10.9.Key strategic moves and developments
9.11.OPTICON
9.11.1.Company overview
9.11.2.Company snapshot
9.11.3.SWOT analysis
9.11.4.Operating business segments
9.11.5.Product portfolio
9.11.6.Key strategic moves and developments
9.12.SATO
9.12.1.Company overview
9.12.2.Key executives
9.12.3.Company snapshot
9.12.4.SWOT analysis
9.12.5.Operating business segments
9.12.6.Product portfolio
9.12.7.R&D expenditure
9.12.8.Business performance
9.12.9.Key strategic moves and developments
9.13.SCANDIT
9.13.1.Company overview
9.13.2.Key executives
9.13.3.Company snapshot
9.13.4.SWOT analysis
9.13.5.Operating business segments
9.13.6.Product portfolio
9.13.7.Key strategic moves and developments
9.14.SICK
9.14.1.Company overview
9.14.2.Key executives
9.14.3.Company snapshot
9.14.4.SWOT analysis
9.14.5.Operating business segments
9.14.6.Product portfolio
9.14.7.R&D expenditure
9.14.8.Business performance
9.14.9.Key strategic moves and developments
9.15.TOSHIBA
9.15.1.Company overview
9.15.2.Key executives
9.15.3.Company snapshot.
9.15.4.SWOT analysis
9.15.5.Operating business segments
9.15.6.Product portfolio
9.15.7.R&D expenditure
9.15.8.Business performance
9.15.9.Key strategic moves and developments
9.16.WASP
9.16.1.Company overview
9.16.2.Key executives
9.16.3.Company snapshot
9.16.4.SWOT analysis
9.16.5.Operating business segments
9.16.6.Product portfolio
9.16.7.Key strategic moves and developments
9.17.ZEBRA
9.17.1.Company overview
9.17.2.Key executives
9.17.3.Company snapshot
9.17.4.SWOT analysis
9.17.5.Operating business segments
9.17.6.Product portfolio
9.17.7.R&D expenditure
9.17.8.Business performance
9.17.9.Key strategic moves and developments
LIST OF TABLES
TABLE 01.GLOBAL HEALTHCARE BARCODE READER MARKET, BY TYPE, 2019-2028 ($MILLION)
TABLE 02.HEALTHCARE BARCODE READER MARKET FOR 1D, BY REGION, 2019-2028 ($MILLION)
TABLE 03.HEALTHCARE BARCODE READER FOR 2D, BY REGION, 2019-2028 ($MILLION)
TABLE 04.GLOBAL HEALTHCARE BARCODE READER MARKET, BY PRODUCT TYPE, 2019-2028 ($MILLION)
TABLE 05.GLOBAL HEALTHCARE BARCODE READER MARKET FOR FIXED, BY REGION, 2019-2028 ($MILLION)
TABLE 06.HEALTHCARE BARCODE READER FOR MOBILE, BY REGION, 2019-2028 ($MILLION)
TABLE 07.GLOBAL HEALTHCARE BARCODE READER MARKET, BY CONNECTIVITY, 2019-2028 ($MILLION)
TABLE 08.HEALTHCARE BARCODE READER MARKET FOR WIRED, BY REGION, 2019-2028 ($MILLION)
TABLE 09.HEALTHCARE BARCODE READER MARKET FOR WIRELESS, BY REGION, 2019-2028 ($MILLION)
TABLE 10.GLOBAL HEALTHCARE BARCODE READER MARKET, BY APPLICATION, 2019-2028 ($MILLION)
TABLE 11.HEALTHCARE BARCODE READER MARKET FOR IN VITRO DIAGNOSTIC, BY REGION, 2019-2028 ($MILLION)
TABLE 12.GLOBAL HEALTHCARE BARCODE READER MARKET, BY IN VITRO DIAGNOSTICS, 2019-2028 ($MILLION)
TABLE 13.HEALTHCARE BARCODE READER MARKET FOR ACCESS TRACKING, BY REGION, 2019-2028 ($MILLION)
TABLE 14.GLOBAL HEALTHCARE BARCODE READER MARKET, BY ACCESS TRACKING, 2019-2028 ($MILLION)
TABLE 15.HEALTHCARE BARCODE READER MARKET FOR SURGICAL, BY REGION, 2019-2028 ($MILLION)
TABLE 16.GLOBAL HEALTHCARE BARCODE READER MARKET, BY SURGICAL, 2019-2028 ($MILLION)
TABLE 17.HEALTHCARE BARCODE READER MARKET FOR PATIENT MONITORING, BY REGION, 2019-2028 ($MILLION)
TABLE 18.HEALTHCARE BARCODE READER MARKET FOR DRUG DISPENSING, BY REGION, 2019-2028 ($MILLION)
TABLE 19.HEALTHCARE BARCODE READER MARKET REVENUE, BY REGION, 2019–2028 ($MILLION)
TABLE 20.NORTH AMERICA HEALTHCARE BARCODE READER MARKET, BY TYPE, 2019–2028 ($MILLION)
TABLE 21.NORTH AMERICA HEALTHCARE BARCODE READER MARKET, BY PRODUCT TYPE, 2019–2028 ($MILLION)
TABLE 22.NORTH AMERICA HEALTHCARE BARCODE READER MARKET, BY CONNECTIVITY, 2019–2028 ($MILLION)
TABLE 23.NORTH AMERICA HEALTHCARE BARCODE READER MARKET, BY APPLICATION, 2019–2028 ($MILLION)
TABLE 24.U.S. HEALTHCARE BARCODE READER MARKET, BY TYPE, 2019–2028 ($MILLION)
TABLE 25.U.S. HEALTHCARE BARCODE READER MARKET, BY PRODUCT TYPE, 2019–2028 ($MILLION)
TABLE 26.U.S. HEALTHCARE BARCODE READER MARKET, BY CONNECTIVITY, 2019–2028 ($MILLION)
TABLE 27.U.S. HEALTHCARE BARCODE READER MARKET, BY APPLCIATION, 2019–2028 ($MILLION)
TABLE 28.CANADA HEALTHCARE BARCODE READER MARKET, BY TYPE, 2019–2028 ($MILLION)
TABLE 29.CANADA HEALTHCARE BARCODE READER MARKET, BY PRODUCT TYPE, 2019–2028 ($MILLION)
TABLE 30.CANADA HEALTHCARE BARCODE READER MARKET, BY CONNECTIVITY, 2019–2028 ($MILLION)
TABLE 31.CANADA HEALTHCARE BARCODE READER MARKET, BY APPLICATION, 2019–2028 ($MILLION)
TABLE 32.MEXICO HEALTHCARE BARCODE READER MARKET, BY TYPE, 2019–2028 ($MILLION)
TABLE 33.MEXICO HEALTHCARE BARCODE READER MARKET, BY PRODUCT TYPE, 2019–2028 ($MILLION)
TABLE 34.MEXICO HEALTHCARE BARCODE READER MARKET, BY CONNECTIVITY, 2019–2028 ($MILLION)
TABLE 35.MEXICO HEALTHCARE BARCODE READER MARKET, BY APPLICATION, 2019–2028 ($MILLION)
TABLE 36.EUROPE HEALTHCARE BARCODE READER MARKET, BY TYPE, 2019–2028 ($MILLION)
TABLE 37.EUROPE HEALTHCARE BARCODE READER MARKET, BY PRODUCT TYPE, 2019–2028 ($MILLION)
TABLE 38.EUROPE HEALTHCARE BARCODE READER MARKET, BY CONNECTIVITY, 2019–2028 ($MILLION)
TABLE 39.EUROPE HEALTHCARE BARCODE READER MARKET, BY APPLICATION, 2019–2028 ($MILLION)
TABLE 40.GERMANY HEALTHCARE BARCODE READER MARKET, BY TYPE, 2019–2028 ($MILLION)
TABLE 41.GERMANY HEALTHCARE BARCODE READER MARKET, BY PRODUCT TYPE, 2019–2028 ($MILLION)
TABLE 42.GERMANY HEALTHCARE BARCODE READER MARKET, BY CONNECTIVITY, 2019–2028 ($MILLION)
TABLE 43.GERMANY HEALTHCARE BARCODE READER MARKET, BY APPLICATION, 2019–2028 ($MILLION)
TABLE 44.UK HEALTHCARE BARCODE READER MARKET, BY TYPE, 2019–2028 ($MILLION)
TABLE 45.UK HEALTHCARE BARCODE READER MARKET, BY PRODUCT TYPE, 2019–2028 ($MILLION)
TABLE 46.UK HEALTHCARE BARCODE READER MARKET, BY CONNECTIVITY, 2019–2028 ($MILLION)
TABLE 47.UK HEALTHCARE BARCODE READER MARKET, BY CONNECTIVITY, 2019–2028 ($MILLION)
TABLE 48.FRANCE HEALTHCARE BARCODE READER MARKET, BY TYPE, 2019–2028 ($MILLION)
TABLE 49.FRANCE HEALTHCARE BARCODE READER MARKET, BY PRODUCT TYPE, 2019–2028 ($MILLION)
TABLE 50.FRANCE HEALTHCARE BARCODE READER MARKET, BY CONNECTIVITY, 2019–2028 ($MILLION)
TABLE 51.FRANCE HEALTHCARE BARCODE READER MARKET, BY APPLICATION, 2019–2028 ($MILLION)
TABLE 52.ITALY HEALTHCARE BARCODE READER MARKET, BY TYPE, 2019–2028 ($MILLION)
TABLE 53.ITALY HEALTHCARE BARCODE READER MARKET, BY PRODUCT TYPE, 2019–2028 ($MILLION)
TABLE 54.ITALY HEALTHCARE BARCODE READER MARKET, BY CONNECTIVITY, 2019–2028 ($MILLION)
TABLE 55.ITALY HEALTHCARE BARCODE READER MARKET, BY APPLICATION, 2019–2028 ($MILLION)
TABLE 56.REST OF EUROPE HEALTHCARE BARCODE READER MARKET, BY TYPE, 2019–2028 ($MILLION)
TABLE 57.REST OF EUROPE HEALTHCARE BARCODE READER MARKET, BY PRODUCT TYPE, 2019–2028 ($MILLION)
TABLE 58.REST OF EUROPE HEALTHCARE BARCODE READER MARKET, BY CONNECTIVITY, 2019–2028 ($MILLION)
TABLE 59.REST OF EUROPE HEALTHCARE BARCODE READER MARKET, BY APPLICATION, 2019–2028 ($MILLION)
TABLE 60.ASIA-PACIFIC HEALTHCARE BARCODE READER MARKET, BY TYPE, 2019–2028 ($MILLION)
TABLE 61.ASIA-PACIFIC HEALTHCARE BARCODE READER MARKET, BY PRODUCT TYPE, 2019–2028 ($MILLION)
TABLE 62.ASIA-PACIFIC HEALTHCARE BARCODE READER MARKET, BY CONNECTIVITY, 2019–2028 ($MILLION)
TABLE 63.ASIA-PACIFIC HEALTHCARE BARCODE READER MARKET, BY APPLICATION, 2019–2028 ($MILLION)
TABLE 64.CHINA HEALTHCARE BARCODE READER MARKET, BY TYPE, 2019–2028 ($MILLION)
TABLE 65.CHINA HEALTHCARE BARCODE READER MARKET, BY PRODUCT TYPE, 2019–2028 ($MILLION)
TABLE 66.CHINA HEALTHCARE BARCODE READER MARKET, BY CONNECTIVITY, 2019–2028 ($MILLION)
TABLE 67.CHINA HEALTHCARE BARCODE READER MARKET, BY APPLICATION, 2019–2028 ($MILLION)
TABLE 68.JAPAN HEALTHCARE BARCODE READER MARKET, BY TYPE, 2019–2028 ($MILLION)
TABLE 69.JAPAN HEALTHCARE BARCODE READER MARKET, BY PRODUCT TYPE, 2019–2028 ($MILLION)
TABLE 70.JAPAN HEALTHCARE BARCODE READER MARKET, BY CONNECTIVITY, 2019–2028 ($MILLION)
TABLE 71.JAPAN HEALTHCARE BARCODE READER MARKET, BY APPLICATION, 2019–2028 ($MILLION)
TABLE 72.INDIA HEALTHCARE BARCODE READER MARKET, BY TYPE, 2019–2028 ($MILLION)
TABLE 73.INDIA HEALTHCARE BARCODE READER MARKET, BY PRODUCT TYPE, 2019–2028 ($MILLION)
TABLE 74.INDIA HEALTHCARE BARCODE READER MARKET, BY CONNECTIVITY, 2019–2028 ($MILLION)
TABLE 75.INDIA HEALTHCARE BARCODE READER MARKET, BY APPLICATION, 2019–2028 ($MILLION)
TABLE 76.SOUTH KOREA HEALTHCARE BARCODE READER MARKET, BY TYPE, 2019–2028 ($MILLION)
TABLE 77.SOUTH KOREA HEALTHCARE BARCODE READER MARKET, BY PRODUCT TYPE, 2019–2028 ($MILLION)
TABLE 78.SOUTH KOREA HEALTHCARE BARCODE READER MARKET, BY CONNECTIVITY, 2019–2028 ($MILLION)
TABLE 79.SOUTH KOREA HEALTHCARE BARCODE READER MARKET, BY APPLICATION, 2019–2028 ($MILLION)
TABLE 80.REST OF ASIA-PACIFIC HEALTHCARE BARCODE READER MARKET, BY TYPE, 2019–2028 ($MILLION)
TABLE 81.REST OF ASIA-PACIFIC HEALTHCARE BARCODE READER MARKET, BY PRODUCT TYPE, 2019–2028 ($MILLION)
TABLE 82.REST OF ASIA-PACIFIC HEALTHCARE BARCODE READER MARKET, BY CONNECTIVITY, 2019–2028 ($MILLION)
TABLE 83.REST OF ASIA-PACIFIC HEALTHCARE BARCODE READER MARKET, BY APPLICATION, 2019–2028 ($MILLION)
TABLE 84.LAMEA HEALTHCARE BARCODE READER MARKET, BY TYPE, 2019–2028 ($MILLION)
TABLE 85.LAMEA HEALTHCARE BARCODE READER MARKET, BY PRODUCT TYPE, 2019–2028 ($MILLION)
TABLE 86.LAMEA HEALTHCARE BARCODE READER MARKET, BY CONNECTIVITY, 2019–2028 ($MILLION)
TABLE 87.LAMEA HEALTHCARE BARCODE READER MARKET, BY APPLICATION, 2019–2028 ($MILLION)
TABLE 88.LATIN AMERICA HEALTHCARE BARCODE READER MARKET, BY TYPE, 2019–2028 ($MILLION)
TABLE 89.LATIN AMERICA HEALTHCARE BARCODE READER MARKET, BY PRODUCT TYPE, 2019–2028 ($MILLION)
TABLE 90.LATIN AMERICA HEALTHCARE BARCODE READER MARKET, BY CONNECTIVITY, 2019–2028 ($MILLION)
TABLE 91.LATIN AMERICA HEALTHCARE BARCODE READER MARKET, BY CONNECTIVITY, 2019–2028 ($MILLION)
TABLE 92.MIDDLE EAST HEALTHCARE BARCODE READER MARKET, BY TYPE, 2019–2028 ($MILLION)
TABLE 93.MIDDLE EAST HEALTHCARE BARCODE READER MARKET, BY PRODUCT TYPE, 2019–2028 ($MILLION)
TABLE 94.MIDDLE EAST HEALTHCARE BARCODE READER MARKET, BY CONNECTIVITY, 2019–2028 ($MILLION)
TABLE 95.MIDDLE EAST HEALTHCARE BARCODE READER MARKET, BY APPLICATION, 2019–2028 ($MILLION)
TABLE 96.AFRICA HEALTHCARE BARCODE READER MARKET, BY TYPE, 2019–2028 ($MILLION)
TABLE 97.AFRICA HEALTHCARE BARCODE READER MARKET, BY PRODUCT TYPE, 2019–2028 ($MILLION)
TABLE 98.AFRICA HEALTHCARE BARCODE READER MARKET, BY CONNECTIVITY, 2019–2028 ($MILLION)
TABLE 99.AFRICA HEALTHCARE BARCODE READER MARKET, BY APPLCIATION, 2019–2028 ($MILLION)
TABLE 100.BLUEBIRD:KEY EXECUTIVES
TABLE 101.BLUEBIRD: COMPANY SNAPSHOT
TABLE 102.BLUEBIRD: SWOT ANALYSIS
TABLE 103.BLUEBIRD: OPERATING SEGMENTS
TABLE 104.BLUEBIRD: PRODUCT PORTFOLIO
TABLE 105.BLUEBIRD: KEY STRATEGIC MOVES AND DEVELOPMENTS
TABLE 106.COGNEX:KEY EXECUTIVES
TABLE 107.COGNEX: COMPANY SNAPSHOT
TABLE 108.COGNEX: SWOT ANALYSIS
TABLE 109.COGNEX: OPERATING SEGMENTS
TABLE 110.COGNEX: PRODUCT PORTFOLIO
TABLE 111.COGNEX: KEY STRATEGIC MOVES AND DEVELOPMENTS
TABLE 112.DATALOGIC:KEY EXECUTIVES
TABLE 113.DATALOGIC: COMPANY SNAPSHOT
TABLE 114.DATALOGIC: SWOT ANALYSIS
TABLE 115.DATALOGIC: OPERATING SEGMENTS
TABLE 116.DATALOGIC: PRODUCT PORTFOLIO
TABLE 117.DATALOGIC: KEY STRATEGIC MOVES AND DEVELOPMENTS
TABLE 118.DENSO WAVE INC.:KEY EXECUTIVES
TABLE 119.DENSO WAVE INC.: COMPANY SNAPSHOT
TABLE 120.DENSO WAVE INC.: SWOT ANALYSIS
TABLE 121.DENSO WAVE INC.: OPERATING SEGMENTS
TABLE 122.DENSO WAVE INC.: PRODUCT PORTFOLIO
TABLE 123.DENSO WAVE INC.: KEY STRATEGIC MOVES AND DEVELOPMENTS
TABLE 124.HONEYWELL:KEY EXECUTIVES
TABLE 125.HONEYWELL: COMPANY SNAPSHOT
TABLE 126.HONEYWELL: SWOT ANALYSIS
TABLE 127.HONEYWELL: OPERATING SEGMENTS
TABLE 128.HONEYWELL: PRODUCT PORTFOLIO
TABLE 129.HONEYWELL: KEY STRATEGIC MOVES AND DEVELOPMENTS
TABLE 130.JC SQUARE:KEY EXECUTIVES
TABLE 131.JC SQUARE: COMPANY SNAPSHOT
TABLE 132.JC SQUARE: SWOT ANALYSIS
TABLE 133.JC SQUARE: OPERATING SEGMENTS
TABLE 134.JC SQUARE: PRODUCT PORTFOLIO
TABLE 135.JC SQUARE: KEY STRATEGIC MOVES AND DEVELOPMENTS
TABLE 136.JUNIPER:KEY EXECUTIVES
TABLE 137.JUNIPER: COMPANY SNAPSHOT
TABLE 138.JUNIPER: SWOT ANALYSIS
TABLE 139.JUNIPER: OPERATING SEGMENTS
TABLE 140.JUNIPER: PRODUCT PORTFOLIO
TABLE 141.JUNIPER: KEY STRATEGIC MOVES AND DEVELOPMENTS
TABLE 142.KEYENCE: KEY EXECUTIVES
TABLE 143.KEYENCE: COMPANY SNAPSHOT
TABLE 144.KEYENCE: SWOT ANALYSIS
TABLE 145.KEYENCE: OPERATING SEGMENTS
TABLE 146.KEYENCE: PRODUCT PORTFOLIO
TABLE 147.KEYENCE: KEY STRATEGIC MOVES AND DEVELOPMENTS
TABLE 148.MICROSCAN (OMRON):KEY EXECUTIVES
TABLE 149.MICROSCAN (OMRON): COMPANY SNAPSHOT
TABLE 150.MICROSCAN (OMRON): SWOT ANALYSIS
TABLE 151.MICROSCAN (OMRON): OPERATING SEGMENTS
TABLE 152.MICROSCAN (OMRON): PRODUCT PORTFOLIO
TABLE 153.MICROSCAN (OMRON): KEY STRATEGIC MOVES AND DEVELOPMENTS
TABLE 154.NCR:KEY EXECUTIVES
TABLE 155.NCR: COMPANY SNAPSHOT
TABLE 156.NCR: SWOT ANALYSIS
TABLE 157.NCR: OPERATING SEGMENTS
TABLE 158.NCR: PRODUCT PORTFOLIO
TABLE 159.NCR: KEY STRATEGIC MOVES AND DEVELOPMENTS
TABLE 160.OPTICON: COMPANY SNAPSHOT
TABLE 161.OPTICON: SWOT ANALYSIS
TABLE 162.OPTICON: OPERATING SEGMENTS
TABLE 163.OPTICON: PRODUCT PORTFOLIO
TABLE 164.OPTICON: KEY STRATEGIC MOVES AND DEVELOPMENTS
TABLE 165.SATO:KEY EXECUTIVES
TABLE 166.SATO: COMPANY SNAPSHOT
TABLE 167.SATO: SWOT ANALYSIS
TABLE 168.SATO: OPERATING SEGMENTS
TABLE 169.SATO: PRODUCT PORTFOLIO
TABLE 170.SATO: KEY STRATEGIC MOVES AND DEVELOPMENTS
TABLE 171.SCANDIT:KEY EXECUTIVES
TABLE 172.SCANDIT: COMPANY SNAPSHOT
TABLE 173.SCANDIT: SWOT ANALYSIS
TABLE 174.SCANDIT: OPERATING SEGMENTS
TABLE 175.SCANDIT: PRODUCT PORTFOLIO
TABLE 176.SCANDIT: KEY STRATEGIC MOVES AND DEVELOPMENTS
TABLE 177.SICK:KEY EXECUTIVES
TABLE 178.SICK: COMPANY SNAPSHOT
TABLE 179.SICK: SWOT ANALYSIS
TABLE 180.SICK: OPERATING SEGMENTS
TABLE 181.SICK: PRODUCT PORTFOLIO
TABLE 182.SICK: KEY STRATEGIC MOVES AND DEVELOPMENTS
TABLE 183.TOSHIBA:KEY EXECUTIVES
TABLE 184.TOSHIBA: COMPANY SNAPSHOT
TABLE 185.TOSHIBA: SWOT ANALYSIS
TABLE 186.TOSHIBA: OPERATING SEGMENTS
TABLE 187.TOSHIBA: PRODUCT PORTFOLIO
TABLE 188.TOSHIBA: KEY STRATEGIC MOVES AND DEVELOPMENTS
TABLE 189.WASP:KEY EXECUTIVES
TABLE 190.WASP: COMPANY SNAPSHOT
TABLE 191.WASP: SWOT ANALYSIS
TABLE 192.WASP: OPERATING SEGMENTS
TABLE 193.WASP: PRODUCT PORTFOLIO
TABLE 194.WASP: KEY STRATEGIC MOVES AND DEVELOPMENTS
TABLE 195.ZEBRA:KEY EXECUTIVES
TABLE 196.ZEBRA: COMPANY SNAPSHOT
TABLE 197.ZEBRA: SWOT ANALYSIS
TABLE 198.ZEBRA: OPERATING SEGMENTS
TABLE 199.ZEBRA: PRODUCT PORTFOLIO
TABLE 200.ZEBRA: KEY STRATEGIC MOVES AND DEVELOPMENTS
LIST OF FIGURES
FIGURE 01.KEY MARKET SEGMENTS
FIGURE 02.GLOBAL HEALTHCARE BARCODE READER MARKET SNAPSHOT, BY SEGMENTATION
FIGURE 03.HEALTHCARE BARCODE READER MARKET SNAPSHOT, BY REGION
FIGURE 04.TOP WINNING STRATEGIES, BY YEAR, 2017–2021*
FIGURE 05.TOP WINNING STRATEGIES, BY DEVELOPMENT, 2017–2021*
FIGURE 06.TOP WINNING STRATEGIES, BY COMPANY, 2017–2021*
FIGURE 07.HIGH BARGAINING POWER OF SUPPLIERS
FIGURE 08.MODERATE THREAT OF NEW ENTRANTS
FIGURE 09.MODERATE TO HIGH THREAT OF SUBSTITUTES
FIGURE 10.MODERATE-TO-HIGH INTENSITY OF RIVALRY
FIGURE 11.MODERATE-TO-HIGH BARGAINING POWER OF BUYERS
FIGURE 12.MARKET SHARE ANALYSIS, 2019
FIGURE 13.GLOBAL HEALTHCARE BARCODE READER MARKET, BY TYPE, 2019-2028
FIGURE 14.COMPARATIVE SHARE ANALYSIS OF HEALTHCARE BARCODE READER MARKET FOR 1D,
BY COUNTRY, 2019 & 2028(%)
FIGURE 15.COMPARATIVE SHARE ANALYSIS OF HEALTHCARE BARCODE READER MARKET FOR 2D,
BY COUNTRY, 2019 & 2028(%)
FIGURE 16.GLOBAL HEALTHCARE BARCODE READER MARKET, BY PRODUCT TYPE, 2019-2028
FIGURE 17.COMPARATIVE SHARE ANALYSIS OF HEALTHCARE BARCODE READER MARKET FOR FIXED,
BY COUNTRY, 2019 & 2028(%)
FIGURE 18.COMPARATIVE SHARE ANALYSIS OF HEALTHCARE BARCODE READER MARKET FOR MOBILE,
BY COUNTRY, 2019 & 2028(%)
FIGURE 19.GLOBAL HEALTHCARE BARCODE READER MARKET, BY CONNECTIVITY, 2019-2028
FIGURE 20.COMPARATIVE SHARE ANALYSIS HEALTHCARE BARCODE READER MARKET FOR WIRED,
BY COUNTRY, 2019 & 2028 (%)
FIGURE 21.COMPARATIVE SHARE ANALYSIS OF HEALTHCARE BARCODE READER MARKET FOR WIRELESS,
BY COUNTRY, 2019 & 2028 (%)
FIGURE 22.GLOBAL HEALTHCARE BARCODE READER MARKET, BY APPLICATION, 2019-2028
FIGURE 23.COMPARATIVE SHARE ANALYSIS HEALTHCARE BARCODE READER MARKET FOR INVITRO DIAGNOSTICS, BY COUNTRY, 2019 & 2028 (%)
FIGURE 24.COMPARATIVE SHARE ANALYSIS OF HEALTHCARE BARCODE READER MARKET FOR ACCESS TRACKING, BY COUNTRY, 2019 & 2028 (%)
FIGURE 25.COMPARATIVE SHARE ANALYSIS OF HEALTHCARE BARCODE READER MARKET FOR SURGICAL,
BY COUNTRY, 2019 & 2028 (%)
FIGURE 26.COMPARATIVE SHARE ANALYSIS OF HEALTHCARE BARCODE READER MARKET FOR PATIENT MONITORING, BY COUNTRY, 2019 & 2028 (%)
FIGURE 27.COMPARATIVE SHARE ANALYSIS OF HEALTHCARE BARCODE READER MARKET FOR DRUG DISPENSING, BY COUNTRY, 2019 & 2028 (%)
FIGURE 28.HEALTHCARE BARCODE READER MARKET, BY REGION, 2019-2028 (%)
FIGURE 29.COMPARATIVE SHARE ANALYSIS OF NORTH AMERICA HEALTHCARE BARCODE READER MARKET, BY COUNTRY, 2019–2028 (%)
FIGURE 30.U.S. HEALTHCARE BARCODE READER MARKET, 2019–2028 ($MILLION)
FIGURE 31.CANADA HEALTHCARE BARCODE READER MARKET, 2019–2028 ($MILLION)
FIGURE 32.MEXICO HEALTHCARE BARCODE READER MARKET, 2019–2028 ($MILLION)
FIGURE 33.COMPARATIVE SHARE ANALYSIS OF EUROPE HEALTHCARE BARCODE READER MARKET,
BY COUNTRY, 2019–2028 (%)
FIGURE 34.GERMANY HEALTHCARE BARCODE READER MARKET, 2019–2028 ($MILLION)
FIGURE 35.UK HEALTHCARE BARCODE READER MARKET, 2019–2028 ($MILLION)
FIGURE 36.FRANCE HEALTHCARE BARCODE READER MARKET, 2019–2028 ($MILLION)
FIGURE 37.ITALY HEALTHCARE BARCODE READER MARKET, 2019–2028 ($MILLION)
FIGURE 38.REST OF EUROPE HEALTHCARE BARCODE READER MARKET, 2019–2028 ($MILLION)
FIGURE 39.COMPARATIVE SHARE ANALYSIS OF ASIA-PACIFIC HEALTHCARE BARCODE READER MARKET,
BY COUNTRY, 2019–2028 (%)
FIGURE 40.CHINA HEALTHCARE BARCODE READER MARKET, 2019–2028 ($MILLION)
FIGURE 41.JAPAN HEALTHCARE BARCODE READER MARKET, 2019–2028 ($MILLION)
FIGURE 42.INDIA HEALTHCARE BARCODE READER MARKET, 2019–2028 ($MILLION)
FIGURE 43.SOUTH KOREA HEALTHCARE BARCODE READER MARKET, 2019–2028 ($MILLION)
FIGURE 44.REST OF ASIA-PACIFIC HEALTHCARE BARCODE READER MARKET, 2019–2028 ($MILLION)
FIGURE 45.COMPARATIVE SHARE ANALYSIS OF LAMEA HEALTHCARE BARCODE READER MARKET,
BY COUNTRY, 2019–2028 (%)
FIGURE 46.LATIN AMERICA HEALTHCARE BARCODE READER MARKET, 2019–2028 ($MILLION)
FIGURE 47.MIDDLE EAST HEALTHCARE BARCODE READER MARKET, 2019–2028 ($MILLION)
FIGURE 48.AFRICA HEALTHCARE BARCODE READER MARKET, 2019–2028 ($MILLION)
FIGURE 49.COGNEX: R&D EXPENDITURE, 2018–2020 ($MILLION)
FIGURE 50.COGNEX: REVENUE, 2018–2020 ($MILLION)
FIGURE 51.COGNEX: REVENUE SHARE, BY REGION, 2020 (%)
FIGURE 52.DATALOGIC: R&D EXPENDITURE, 2017–2019 ($MILLION)
FIGURE 53.DATALOGIC: REVENUE, 2017–2019 ($MILLION)
FIGURE 54.DATALOGIC: REVENUE SHARE, BY SEGMENT, 2019 (%)
FIGURE 55.DATALOGIC: REVENUE SHARE, BY REGION, 2019 (%)
FIGURE 56.DENSO WAVE INC.: REVENUE SHARE, BY SEGMENT, 2020 (%)
FIGURE 57.HONEYWELL: R&D EXPENDITURE, 2018–2020 ($MILLION)
FIGURE 58.HONEYWELL: REVENUE, 2018–2020 ($MILLION)
FIGURE 59.HONEYWELL: REVENUE SHARE, BY SEGMENT, 2020 (%)
FIGURE 60.HONEYWELL: REVENUE SHARE, BY REGION, 2020 (%)
FIGURE 61.KEYENCE: R&D EXPENDITURE, 2018–2020 ($MILLION)
FIGURE 62.KEYENCE: REVENUE, 2018–2020 ($MILLION)
FIGURE 63.KEYENCE: REVENUE SHARE, BY REGION, 2020 (%)
FIGURE 64.MICROSCAN (OMRON): R&D EXPENDITURE, 2017–2019 ($MILLION)
FIGURE 65.MICROSCAN (OMRON): REVENUE, 2017–2019 ($MILLION)
FIGURE 66.MICROSCAN (OMRON): REVENUE SHARE, BY SEGMENT, 2019 (%)
FIGURE 67.MICROSCAN (OMRON): REVENUE SHARE, BY REGION, 2019 (%)
FIGURE 68.NCR: R&D EXPENDITURE, 2018–2020 ($MILLION)
FIGURE 69.NCR: REVENUE, 2018–2020 ($MILLION)
FIGURE 70.NCR: REVENUE SHARE, BY SEGMENT, 2020 (%)
FIGURE 71.NCR: REVENUE SHARE, BY REGION, 2020 (%)
FIGURE 72.SATO: R&D EXPENDITURE, 2017–2019 ($MILLION)
FIGURE 73.SATO: REVENUE, 2017–2019 ($MILLION)
FIGURE 74.SICK: R&D EXPENDITURE, 2018–2020 ($MILLION)
FIGURE 75.SICK: REVENUE, 2018–2020 ($MILLION)
FIGURE 76.SICK: REVENUE SHARE, BY SEGMENT, 2020 (%)
FIGURE 77.SICK: REVENUE SHARE, BY REGION, 2020 (%)
FIGURE 78.TOSHIBA: R&D EXPENDITURE, 2018–2020 ($MILLION)
FIGURE 79.TOSHIBA: NET SALES, 2018–2020 ($MILLION)
FIGURE 80.TOSHIBA: REVENUE SHARE BY SEGMENT, 2020 (%)
FIGURE 81.TOSHIBA: REVENUE SHARE BY REGION, 2020 (%)
FIGURE 82.ZEBRA: R&D EXPENDITURE, 2018–2020 ($MILLION)
FIGURE 83.ZEBRA: REVENUE, 2018–2020 ($MILLION)
FIGURE 84.ZEBRA: REVENUE SHARE, BY SEGMENT, 2020 (%)
FIGURE 85.ZEBRA: REVENUE SHARE, BY REGION, 2020 (%)
The healthcare barcode reader market is witnessing significant growth, owing to reduction of human error-assisted security paired with rise in investments by government and healthcare sector.
Healthcare barcode reader vendors, who have access to extensive technical and financial resources, are anticipated to gain a competitive edge over their rivals, as they have the capacity to cater to the market requirements. The competitive environment in this market is expected to further intensify with increase in technological innovations, product extensions, and different strategies adopted by key vendors.
The barcode reader market is expected to witness a significant growth with increase in adoption from healthcare sector to improve operations efficiency in different geographical regions. Technological advancements have augmented the overall industrial development to ascertain safety and maintain error-free records and gain operations efficiency.
Asia-Pacific is projected to dominate the market during the forecast period, due to increase in infrastructure. The digitization particularly in India and China is also opening several growth opportunities for the barcode reader market. Furthermore, increase in adoption of barcode reader in the healthcare sector, reduction of errors, cost-effectiveness, and ease of these devices drive the growth of the healthcare barcode reader market in this region.
The healthcare barcode reader market provides numerous growth opportunities to the players such as Honeywell, Datalogic, Cognex, and more.
A. The Healthcare Barcode Reader Market is estimated to grow at a CAGR of 12.7% from 2021 to 2028.
A. The Healthcare Barcode Reader Market is projected to reach $640.7 million by 2028.
A. To get the latest version of sample report
A. Extensive patient safety, and preventing medication errors etc. boost the Healthcare Barcode Reader market growth.
A. The key players profiled in the report include Honeywell, Zebra, Cognex, Sato, Toshiba, Wasp, Datalogic, and many more.
A. On the basis of top growing big corporations, we select top 10 players.
A. The Healthcare Barcode Reader Market is segmented on the basis of type, product type, connectivity, application, and region.
A. The key growth strategies of Healthcare Barcode Reader market players include product portfolio expansion, mergers & acquisitions, agreements, geographical expansion, and collaborations.
A. Patient Monitoring segment would grow at a highest CAGR of 14.1% during the forecast period.
A. Asia-Pacific region will dominate the market by the end of 2028.
Start reading instantly.
This Report and over 67,070+ more Reports, Available with Avenue Library. T&C*.
Enterprise
License/PDF
Library
Membership
*Taxes/Fees, if applicable will be added during checkout. All prices in USD
To ensure high-level data integrity, accurate analysis, and impeccable forecasts
For complete satisfaction
On-demand customization of scope of the report to exactly meet your needs
Targeted market view to provide pertinent information and save time of readers
Get insights on topics that are crucial for your business. Stay abreast of your interest areas.
Get Industry Data AlertsTo ensure high-level data integrity, accurate analysis, and impeccable forecasts
For complete satisfaction
On-demand customization of scope of the report to exactly meet your needs
Targeted market view to provide pertinent information and save time of readers