0
2021
Healthcare Fabrics Market

Healthcare Fabrics Market

by Raw Material (Polypropylene, Cotton, Polyester, Viscose, Polyamide, and Others), Fabrics Type (Non-woven, Woven and knitted) and Application (Hygiene Products, Dressing Products, Clothing, Blanket & Bedding, Upholstery, Privacy Curtains, and Others): Global Opportunity Analysis and Industry Forecast 2020-2027

Report Code: A10987
Apr 2021 | Pages: 340
Tables: 233
Charts: 67
  • Formats*:

  • pdf

    Single User License, Five User
    License & Enterprise User License

  • xls

    Data Pack Excel License

  • ppt

    It comes with the additional cost
    of $2500.00 contact sales.


COVID-19

Pandemic disrupted the entire world and affected many industries.

Get detailed COVID-19 impact analysis on the Healthcare Fabrics Market

Request Now !

Healthcare Fabrics Market Outlook - 2020–2027

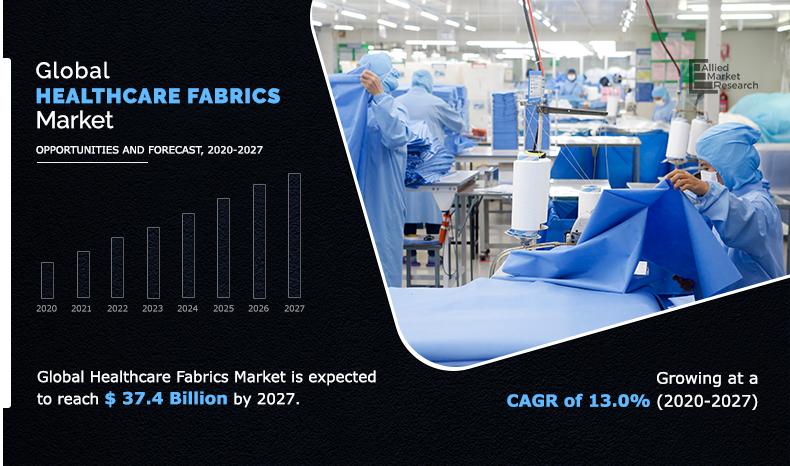
The global healthcare fabrics market size was valued at $15.9 billion in 2019, and is projected to reach $37.4 billion by 2027, growing at a CAGR of 13.0% from 2020 to 2027.

The ongoing spread of COVID-19, has increased the demand for protective masks, gowns, gloves and so on. Thus, supporting healthcare fabrics market growth.

The primary goal of healthcare fabrics is to reduce the risk of contamination and the transmission of pathogens and diseases within the tissue. Health care fabrics are in high demand due to their waterproof, highly flexible, flame retardant, strain-resistance, and antimicrobial properties. Healthcare fabrics are made especially for various applications in the healthcare industry. These fabrics were created for use in medical and hygiene applications. Polypropylene, polyester, cotton, viscose, polyamide, and other fibers can be used to make healthcare fabrics. The fibers used in the healthcare industry should possess antimicrobial, fire-resistant, non-allergic, and non-carcinogenic properties. 

Global Healthcare Fabrics Market

One of the fastest growing segments of the medical textile industry is healthcare fabrics. The growth of the sector has been aided by the emergence of medical and healthcare facilities in developing countries.

Healthcare fabrics are mostly used in hospitals to avoid the spread and expansion of bacterial diseases, due to rising number of hospitalizations. Increased spending on personal hygiene items such as sanitary napkins, baby diapers, and adult diapers as well as continued technical advancements aimed at improving quality and performance parameters, are expected to drive the global market. Moreover, the number of working women around the world as well as government campaigns to encourage use of sanitary napkins even in rural areas are expected to propel the healthcare fabrics market during the forecast period.

However, a marginal decrease in duty drawback rates could hamper market expansion. The availability of menstrual cups as a substitute for sanitary napkins is expected to limit the healthcare fabrics market growth. Product developments also contribute to the introduction of high-end goods to the market through increasing competition among market leaders.

The global healthcare fabrics market is segmented based on raw material, fabric type, application, and region. By raw material, the market is classified into polypropylene, cotton, polyester, viscose, polyamide, others. Based on fabric type, the market is segmented into non-woven, woven and knitted. Based on application, the market is divided into hygiene products, dressing products, clothing, blanket & bedding, upholstery, privacy curtains, and others. Based on region, the market is analyzed across North America, Europe, Asia-Pacific, and LAMEA.

Some of the key players operating in the global healthcare fabrics market are Ahlstrom Munksjo OYJ, Asahi Kasei Corporation, Avgol Ltd, Berry Global Group Inc., Carnegie Fabrics LLC, Eximius Incorporation, Freudenberg Group, Kimberly-Clark Corporation, Knoll Inc., and Paramount Tech Fab Industries.

Global Healthcare Fabrics Market, By Raw Materials

By raw material, because of the high demand for use in hygiene products, polypropylene had the largest share in the healthcare fabrics market in 2019. Since polypropylene is used in the top sheet of hygiene products, increased demand for sanitary napkins and baby wraps is driving the demand for the material.

Healthcare Fabrics Market
By Raw Material

Your browser does not support the canvas element.

Polypropylene is projected as the most lucrative segment.

Get more information on this report : Request Sample Pages

Global Healthcare Fabrics Market, By Fabric Type

By fabric type, because of their excellent absorption properties, softness, smoothness, strength, comfort and fit, stretch ability, and cost-effectiveness, nonwoven fabrics are used as a substitute for conventional textiles.

Healthcare Fabrics Market
By Fabric Type

Your browser does not support the canvas element.

Non-woven is projected as the most lucrative segment.

Get more information on this report : Request Sample Pages

Global Healthcare Fabrics Market, By Application 

By application, in 2019, the hygiene application segment accounted for the largest share of the healthcare fabrics market, with an expected CAGR of 11.6% over the forecast period. This is primarily due to rising consumption of sanitary napkins and baby diapers globally.

Healthcare Fabrics Market
By Applications

Your browser does not support the canvas element.

Hygiene Products is projected as the most lucrative segment.

Get more information on this report : Request Sample Pages

Global Healthcare Fabrics Market, By Region

By region, Europe held the largest share in the healthcare fabrics market in 2019 up to 39.6%, due to the increasing adoption of female hygiene products in countries, such as India, and China.

Healthcare Fabrics Market
By Region

2027
Europe 
North America
Asia-Pacific
LAMEA

Europe holds a dominant position in 2019 and would continue to maintain the lead over the forecast period.

Get more information on this report : Request Sample Pages

Key Benefits For Stakeholders

  • The report provides an in-depth analysis of the healthcare fabrics market forecast along with the current and future market trends.
  • This report highlights the key drivers, opportunities, and restraints of the market along with the impact analyses during the forecast period.
  • Porter’s five forces analysis helps analyze the potential of the buyers & suppliers and the competitive scenario of the global healthcare fabrics industry for strategy building.
  • A comprehensive healthcare fabrics market analysis covers factors that drive and restrain market growth.
  • The qualitative data in this report aims on market dynamics, trends, and developments.

Impact Of Covid-19 On The Global Healthcare Fabrics Market

The COVID-19 pandemic has resulted in an increase in patient inflows. As a result, healthcare fabrics such as PPE kits, bed sheets, masks, and other items, are in high demand. In April 2020, the Supreme Court of India ordered the government to provide protective gear to healthcare staff. To prevent the spread of coronavirus infection, people are wearing face masks. During the COVID-19 outbreak, the high consumption rate of medical garments and other fabrics-based items is expected to fuel the demand in the global healthcare fabrics market.

Key Market Segments

By Raw Material

  • Polypropylene
  • Cotton
  • Polyester
  • Viscose
  • Polyamide
  • Others

By Fabric Type

  • Non-woven
  • Woven
  • Knitted

By Application

  • Hygiene products
  • Dressing products
  • Clothing
  • Blanket & bedding
  • Upholstery
  • Privacy curtains
  • Others

By Region

  • North America
    • U.S.
    • Canada
    • Mexico
  • Europe
    • Germany
    • France
    • Italy
    • Spain
    • UK
    • Rest of Europe
  • Asia-Pacific
    • China
    • Japan
    • India
    • South Korea
    • Australia
    • Rest of Asia-Pacific
  • LAMEA
    • Brazil
    • Saudi Arabia
    • South Africa
    • Rest of LAMEA

Healthcare Fabrics Market Report Highlights

Aspects Details
By RAW MATERIAL
  • Polypropylene
  • Cotton
  • Polyester
  • Viscose
  • Polyamide
  • Others
By FABRIC TYPE
  • Non-woven
  • .Woven
  • knitted
By APPLICATION
  • Hygiene products
  • Dressing products
  • Clothing
  • Blanket & bedding
  • Upholstery
  • Privacy curtains
  • Others
By Region
  • North America  (U.S., Canada, Mexico)
  • Europe  (France, Germany, Italy, Spain, UK, Russia, Rest of Europe)
  • Asia-Pacific  (China, Japan, India, South Korea, Australia, Thailand, Malaysia, Indonesia, Rest of Asia-Pacific)
  • LAMEA  (Brazil, South Africa, Saudi Arabia, UAE, Argentina, Rest of LAMEA)
Key Market Players Kimberly-Clark Corporation, Freudenberg Group, ASAHI KASEI CORPORATION, Knoll Inc., Avgol Ltd, AHLSTROM-MUNKSJÖ, .Eximius Incorporation, Paramount Tech Fab Industries, .Carnegie Fabrics LLC, Berry Global Group Inc.
 

CHAPTER 1:INTRODUCTION

1.1.Report description
1.2.Key benefits for stakeholders
1.3.Key market segments
1.4.Research methodology

1.4.1.Secondary research
1.4.2.Primary research

1.5.Analyst tools and models

CHAPTER 2:EXECUTIVE SUMMARY

2.1.Key findings of the study
2.2.CXO perspective

CHAPTER 3:MARKET OVERVIEW

3.1.Market definition and scope
3.2.Key findings

3.2.1.Top investment pockets

3.3.Porter’s five forces analysis
3.4.Market dynamics

3.4.1.Drivers

3.4.1.1.Increasing consumer awareness regarding hygiene products
3.4.1.2.Improved quality of healthcare fabrics

3.4.2.Restraint

3.4.2.1.Increased carbon-footprint due to use of female hygiene products

3.4.3.Opportunity

3.4.3.1.Growing consumer awareness

3.5.Patent analysis

3.5.1.Patent analysis by country (2015-2020)

3.6.Impact of government rules and regulations
3.7.Impact of corona (COVID-19) outbreak on the global healthcare fabrics market
3.8.Pricing analysis

CHAPTER 4:HEALTHCARE FABRICS MARKET, BY RAW MATERIAL

4.1.Overview

4.1.1.Market size and forecast

4.2.Polypropylene

4.2.1.Key market trends, growth factors, and opportunities
4.2.2.Market size and forecast, by region
4.2.3.Market share analysis, by country

4.3.Cotton

4.3.1.Key market trends, growth factors, and opportunities
4.3.2.Market size and forecast, by region
4.3.3.Market share analysis, by country

4.4.Polyester

4.4.1.Key market trends, growth factors, and opportunities
4.4.2.Market size and forecast, by region
4.4.3.Market share analysis, by country

4.5.Viscose

4.5.1.Key market trends, growth factors, and opportunities
4.5.2.Market size and forecast, by region
4.5.3.Market share analysis, by country

4.6.Polyamide

4.6.1.Key market trends, growth factors, and opportunities
4.6.2.Market size and forecast, by region
4.6.3.Market share analysis, by country

4.7.Others

4.7.1.Key market trends, growth factors, and opportunities
4.7.2.Market size and forecast, by region
4.7.3.Market share analysis, by country

CHAPTER 5:HEALTHCARE FABRICS MARKET, BY FABRIC TYPE

5.1.Overview

5.1.1.Market size and forecast

5.2.Non-woven

5.2.1.Key market trends, growth factors, and opportunities
5.2.2.Market size and forecast, by region
5.2.3.Market share analysis, by country

5.3.Woven

5.3.1.Key market trends, growth factors, and opportunities
5.3.2.Market size and forecast, by region
5.3.3.Market share analysis, by country

5.4.knitted

5.4.1.Key market trends, growth factors, and opportunities
5.4.2.Market size and forecast, by region
5.4.3.Market share analysis, by country

CHAPTER 6:HEALTHCARE FABRICS MARKET, BY APPLICATION

6.1.Overview

6.1.1.Market size and forecast

6.2.Hygiene products

6.2.1.Key market trends, growth factors, and opportunities
6.2.2.Market size and forecast, by region
6.2.3.Market share analysis, by country

6.3.Dressing products

6.3.1.Key market trends, growth factors, and opportunities
6.3.2.Market size and forecast, by region
6.3.3.Market share analysis, by country

6.4.Clothing

6.4.1.Key market trends, growth factors, and opportunities
6.4.2.Market size and forecast, by region
6.4.3.Market share analysis, by country

6.5.Blanket & bedding

6.5.1.Key market trends, growth factors, and opportunities
6.5.2.Market size and forecast, by region
6.5.3.Market share analysis, by country

6.6.Upholstery

6.6.1.Key market trends, growth factors, and opportunities
6.6.2.Market size and forecast, by region
6.6.3.Market share analysis, by country

6.7.Privacy curtains

6.7.1.Key market trends, growth factors, and opportunities
6.7.2.Market size and forecast, by region
6.7.3.Market share analysis, by country

6.8.Others

6.8.1.Key market trends, growth factors, and opportunities
6.8.2.Market size and forecast, by region
6.8.3.Market share analysis, by country

CHAPTER 7:HEALTHCARE FABRICS MARKET, BY REGION

7.1.Overview

7.1.1.Market size and forecast, by region

7.2.North America

7.2.1.Key market trends, growth factors, and opportunities
7.2.2.Market size and forecast, by raw material
7.2.3.Market size and forecast, by fabric types
7.2.4.Market size and forecast, by application
7.2.5.Market size and forecast, by country
7.2.6.U.S.

7.2.6.1.Market size and forecast, by raw material
7.2.6.2.Market size and forecast, by fabric types
7.2.6.3.Market size and forecast, by application

7.2.7.Canada

7.2.7.1.Market size and forecast, by raw material
7.2.7.2.Market size and forecast, by fabric types
7.2.7.3.Market size and forecast, by application

7.2.8.Mexico

7.2.8.1.Market size and forecast, by raw material
7.2.8.2.Market size and forecast, by fabric types
7.2.8.3.Market size and forecast, by application

7.3.Europe

7.3.1.Key market trends, growth factors, and opportunities
7.3.2.Market size and forecast, by raw material
7.3.3.Market size and forecast, by fabric types
7.3.4.Market size and forecast, by application
7.3.5.Market size and forecast, by country
7.3.6.Germany

7.3.6.1.Market size and forecast, by raw material
7.3.6.2.Market size and forecast, by fabric types
7.3.6.3.Market size and forecast, by application

7.3.7.UK

7.3.7.1.Market size and forecast, by raw material
7.3.7.2.Market size and forecast, by fabric types
7.3.7.3.Market size and forecast, by application

7.3.8.France

7.3.8.1.market size and forecast, by raw material
7.3.8.2.Market size and forecast, by fabric types
7.3.8.3.Market size and forecast, by application

7.3.9.Italy

7.3.9.1.market size and forecast, by raw material
7.3.9.2.Market size and forecast, by fabric types
7.3.9.3.Market size and forecast, by application

7.3.10.Spain

7.3.10.1.market size and forecast, by raw material
7.3.10.2.Market size and forecast, by fabric types
7.3.10.3.Market size and forecast, by application

7.3.11.Rest of Europe

7.3.11.1.market size and forecast, by raw material
7.3.11.2.Market size and forecast, by fabric types
7.3.11.3.Market size and forecast, by application

7.4.Asia-Pacific

7.4.1.Key market trends, growth factors, and opportunities
7.4.2.Market size and forecast, by raw material
7.4.3.Market size and forecast, by fabric types
7.4.4.Market size and forecast, by application
7.4.5.Market size and forecast, by country
7.4.6.China

7.4.6.1.Market size and forecast, by raw material
7.4.6.2.Market size and forecast, by fabric types
7.4.6.3.Market size and forecast, by application

7.4.7.Japan

7.4.7.1.Market size and forecast, by raw material
7.4.7.2.Market size and forecast, by fabric types
7.4.7.3.Market size and forecast, by application

7.4.8.India

7.4.8.1.Market size and forecast, by raw material
7.4.8.2.Market size and forecast, by fabric types
7.4.8.3.Market size and forecast, by application

7.4.9.South Korea

7.4.9.1.Market size and forecast, by raw material
7.4.9.2.Market size and forecast, by fabric types
7.4.9.3.Market size and forecast, by application

7.4.10.Australia

7.4.10.1.Market size and forecast, by raw material
7.4.10.2.Market size and forecast, by fabric types
7.4.10.3.Market size and forecast, by application

7.4.11.Rest of Asia-Pacific

7.4.11.1.Market size and forecast, by raw material
7.4.11.2.Market size and forecast, by fabric types
7.4.11.3.Market size and forecast, by application

7.5.LAMEA

7.5.1.Key market trends, growth factors, and opportunities
7.5.2.Market size and forecast, by raw material
7.5.3.Market size and forecast, by fabric types
7.5.4.Market size and forecast, by application
7.5.5.Market size and forecast, by country
7.5.6.Brazil

7.5.6.1.Market size and forecast, by raw material
7.5.6.2.Market size and forecast, by fabric types
7.5.6.3.Market size and forecast, by application

7.5.7.Saudi Arabia

7.5.7.1.Market size and forecast, by raw material
7.5.7.2.Market size and forecast, by fabric types
7.5.7.3.Market size and forecast, by application

7.5.8.South Africa

7.5.8.1.Market size and forecast, by raw material
7.5.8.2.Market size and forecast, by fabric types
7.5.8.3.Market size and forecast, by application

7.5.9.Rest of LAMEA

7.5.9.1.Market size and forecast, by raw material
7.5.9.2.Market size and forecast, by fabric types
7.5.9.3.Market size and forecast, by application

CHAPTER 8:COMPETITIVE LANDSCAPE

8.1.Introduction

8.1.1.Market Player Positioning, 2019

8.2.Top Winning Strategies

8.2.1.Top winning strategies, by year
8.2.2.Top winning strategies, by development
8.2.3.Top winning strategies, by company

8.3.Product Mapping of Top 10 Player
8.4.Competitive Heatmap
8.5.Key Developments

8.5.1.New product launches
8.5.2.Expansions
8.5.3.Acquisition
8.5.4.Collaboration
8.5.5.Agreement

CHAPTER 9:COMPANY PROFILES:

9.1.AHLSTROM-MUNKSJÖ

9.1.1.Company overview
9.1.2.Company snapshot
9.1.3.Operating business segments
9.1.4.Product portfolio
9.1.5.Business performance
9.1.6.Key strategic moves and developments

9.2.ASAHI KASEI CORPORATION

9.2.1.Company overview
9.2.2.Company snapshot
9.2.3.Operating business segments
9.2.4.Product portfolio
9.2.5.Business performance

9.3.Avgol Ltd

9.3.1.Company overview
9.3.2.Company snapshot
9.3.3.Product portfolio
9.3.4.Key strategic moves and developments

9.4.Berry Global Group Inc.

9.4.1.Company overview
9.4.2.Company snapshot
9.4.3.Operating business segments
9.4.4.Product portfolio
9.4.5.Business performance
9.4.6.Key strategic moves and developments

9.5.Carnegie Fabrics LLC

9.5.1.Company overview
9.5.2.Company snapshot
9.5.3.Product portfolio

9.6.Eximius Incorporation

9.6.1.Company overview
9.6.2.Company snapshot
9.6.3.Product portfolio

9.7.Freudenberg Group

9.7.1.Company overview
9.7.2.Company snapshot
9.7.3.Product portfolio
9.7.4.Business performance
9.7.5.Key strategic moves and developments

9.8.Kimberly-Clark Corporation

9.8.1.Company overview
9.8.2.Company snapshot
9.8.3.Operating business segments
9.8.4.Product portfolio
9.8.5.Business performance
9.8.6.Key strategic moves and developments

9.9.Knoll Inc.

9.9.1.Company overview
9.9.2.Company snapshot
9.9.3.Operating business segments
9.9.4.Product portfolio
9.9.5.Business performance
9.9.6.Key strategic moves and developments

9.10.Paramount Tech Fab Industries

9.10.1.Company overview
9.10.2.Company snapshot
9.10.3.Product portfolio

LIST OF TABLES

TABLE 01.HEALTHCARE FABRICS PRICING FORECAST BY FABRIC TYPE,2019–2027 ($/TON)
TABLE 02.HEALTHCARE FABRICS PRICING FORECAST BY REGION,2019–2027 ($/TON)
TABLE 03.HEALTHCARE FABRICS MARKET REVENUE, BY RAW MATERIAL, 2019–2027($BILLION)
TABLE 04.HEALTHCARE FABRICS MARKET, BY RAW MATERIAL, 2019–2027(KILOTONS)
TABLE 05.HEALTHCARE FABRICS MARKET, BY RAW MATERIAL, 2019–2027 ($BILLION)
TABLE 06.HEALTHCARE FABRICS MARKET FOR POLYPROPYLENE, BY REGION, 2019–2027(KILOTONS)
TABLE 07.HEALTHCARE FABRICS MARKET FOR POLYPROPYLENE, BY REGION, 2019–2027 ($BILLION)
TABLE 08.HEALTHCARE FABRICS MARKET FOR COTTON, BY REGION, 2019–2027(KILOTONS)
TABLE 09.HEALTHCARE FABRICS MARKET FOR GLASS FIBER , BY REGION, 2019–2027 ($BILLION)
TABLE 10.HEALTHCARE FABRICS MARKET FOR POLYESTER, BY REGION, 2019–2027(KILOTONS)
TABLE 11.HEALTHCARE FABRICS MARKET FOR POLYESTER, BY REGION, 2019–2027 ($BILLION)
TABLE 12.HEALTHCARE FABRICS MARKET FOR VISCOSE, BY REGION, 2019–2027(KILOTONS)
TABLE 13.HEALTHCARE FABRICS MARKET FOR VISCOSE, BY REGION, 2019–2027 ($BILLION)
TABLE 14.HEALTHCARE FABRICS MARKET FOR POLYAMIDE, BY REGION, 2019–2027(KILOTONS)
TABLE 15.HEALTHCARE FABRICS MARKET FOR POLYAMIDE, BY REGION, 2019–2027 ($BILLION)
TABLE 16.HEALTHCARE FABRICS MARKET FOR OTHERS, BY REGION, 2019–2027(KILOTONS)
TABLE 17.HEALTHCARE FABRICS MARKET FOR OTHERS , BY REGION, 2019–2027 ($BILLION)
TABLE 18.HEALTHCARE FABRICS MARKET REVENUE, BY FABRIC TYPE 2019–2027, ($BILLION)
TABLE 19.HEALTHCARE FABRICS MARKET, BY FABRIC TYPE, 2019–2027(KILOTONS)
TABLE 20.HEALTHCARE FABRICS MARKET, BY FABRIC TYPE, 2019–2027 ($BILLION)
TABLE 21.HEALTHCARE FABRICS MARKET FOR NON-WOVEN, BY REGION, 2019–2027(KILOTONS)
TABLE 22.HEALTHCARE FABRICS MARKET FOR NON-WOVEN, BY REGION, 2019–2027 ($BILLION)
TABLE 23.HEALTHCARE FABRICS MARKET FOR WOVEN, BY REGION, 2019–2027(KILOTONS)
TABLE 24.HEALTHCARE FABRICS MARKET FOR THERMOPLASTIC, BY REGION, 2019–2027 ($BILLION)
TABLE 25.HEALTHCARE FABRICS MARKET FOR KNITTED, BY REGION, 2019–2027(KILOTONS)
TABLE 26.HEALTHCARE FABRICS MARKET FOR KNITTED, BY REGION, 2019–2027 ($BILLION)
TABLE 27.HEALTHCARE FABRICS MARKET REVENUE, BY APPLICATION 2019–2027, ($BILLION)
TABLE 28.HEALTHCARE FABRICS MARKET, BY APPLICATION, 2019–2027(KILOTONS)
TABLE 29.HEALTHCARE FABRICS MARKET, BY APPLICATION, 2019–2027 ($BILLION)
TABLE 30.HEALTHCARE FABRICS MARKET FOR HYGIENE PRODUCTS, BY REGION, 2019–2027(KILOTONS)
TABLE 31.HEALTHCARE FABRICS MARKET FOR HYGIENE PRODUCTS, BY REGION, 2019–2027 ($BILLION)
TABLE 32.HEALTHCARE FABRICS MARKET FOR DRESSING PRODUCTS, BY REGION, 2019–2027(KILOTONS)
TABLE 33.HEALTHCARE FABRICS MARKET FOR DRESSING PRODUCTS, BY REGION, 2019–2027 ($BILLION)
TABLE 34.HEALTHCARE FABRICS MARKET FOR CLOTHING, BY REGION, 2019–2027(KILOTONS)
TABLE 35.HEALTHCARE FABRICS MARKET FOR CLOTHING, BY REGION, 2019–2027 ($BILLION)
TABLE 36.HEALTHCARE FABRICS MARKET FOR BLANKET & BEDDING, BY REGION, 2019–2027(KILOTONS)
TABLE 37.HEALTHCARE FABRICS MARKET FOR BLANKET & BEDDING, BY REGION, 2019–2027 ($BILLION)
TABLE 38.HEALTHCARE FABRICS MARKET FOR UPHOLSTERY, BY REGION, 2019–2027(KILOTONS)
TABLE 39.HEALTHCARE FABRICS MARKET FOR UPHOLSTERY, BY REGION, 2019–2027 ($BILLION)
TABLE 40.HEALTHCARE FABRICS MARKET FOR PRIVACY CURTAINS, BY REGION, 2019–2027(KILOTONS)
TABLE 41.HEALTHCARE FABRICS MARKET FOR PRIVACY CURTAINS, BY REGION, 2019–2027 ($BILLION)
TABLE 42.HEALTHCARE FABRICS MARKET FOR OTHERS, BY REGION, 2019–2027(KILOTONS)
TABLE 43.HEALTHCARE FABRICS MARKET FOR OTHERS, BY REGION, 2019–2027 ($BILLION)
TABLE 44.HEALTHCARE FABRICS MARKET, BY REGION 2019–2027(KILOTONS)
TABLE 45.HEALTHCARE FABRICS MARKET, BY REGION 2019–2027 ($BILLION)
TABLE 46.NORTH AMERICA HEALTHCARE FABRICS MARKET, BY RAW MATERIAL, 2019–2027(KILOTONS)
TABLE 47.NORTH AMERICA HEALTHCARE FABRICS MARKET, BY RAW MATERIAL, 2019–2027 ($BILLION)
TABLE 48.NORTH AMERICA HEALTHCARE FABRICS MARKET, BY FABRIC TYPES, 2019–2027(KILOTONS)
TABLE 49.NORTH AMERICA HEALTHCARE FABRICS MARKET, BY FABRIC TYPES, 2019–2027 ($BILLION)
TABLE 50.NORTH AMERICA HEALTHCARE FABRICS MARKET, BY APPLICATION, 2019–2027(KILOTONS)
TABLE 51.NORTH AMERICA HEALTHCARE FABRICS MARKET, BY APPLICATION, 2019–2027 ($BILLION)
TABLE 52.NORTH AMERICA HEALTHCARE FABRICS MARKET, BY COUNTRY 2019–2027(KILOTONS)
TABLE 53.NORTH AMERICA HEALTHCARE FABRICS MARKET, BY COUNTRY 2019–2027 ($BILLION)
TABLE 54.U.S. HEALTHCARE FABRICS MARKET, BY RAW MATERIAL, 2019–2027(KILOTONS)
TABLE 55.U.S. HEALTHCARE FABRICS MARKET, BY RAW MATERIAL, 2019–2027 ($BILLION)
TABLE 56.U.S. HEALTHCARE FABRICS MARKET, BY FABRIC TYPES, 2019–2027(KILOTONS)
TABLE 57.U.S. HEALTHCARE FABRICS MARKET, BY FABRIC TYPES, 2019–2027 ($BILLION)
TABLE 58.U.S. HEALTHCARE FABRICS MARKET, BY APPLICATION, 2019–2027(KILOTONS)
TABLE 59.U.S. HEALTHCARE FABRICS MARKET, BY APPLICATION, 2019–2027 ($BILLION)
TABLE 60.CANADA HEALTHCARE FABRICS MARKET, BY RAW MATERIAL, 2019–2027(KILOTONS)
TABLE 61.CANADA HEALTHCARE FABRICS MARKET, BY RAW MATERIAL, 2019–2027 ($BILLION)
TABLE 62.CANADA HEALTHCARE FABRICS MARKET, BY FABRIC TYPES, 2019–2027(KILOTONS)
TABLE 63.CANADA HEALTHCARE FABRICS MARKET, BY FABRIC TYPES, 2019–2027 ($BILLION)
TABLE 64.CANADA HEALTHCARE FABRICS MARKET, BY APPLICATION, 2019–2027(KILOTONS)
TABLE 65.CANADA HEALTHCARE FABRICS MARKET, BY APPLICATION, 2019–2027 ($BILLION)
TABLE 66.MEXICO HEALTHCARE FABRICS MARKET, BY RAW MATERIAL, 2019–2027(KILOTONS)
TABLE 67.MEXICO HEALTHCARE FABRICS MARKET, BY RAW MATERIAL, 2019–2027 ($BILLION)
TABLE 68.MEXICO HEALTHCARE FABRICS MARKET, BY FABRIC TYPES, 2019–2027(KILOTONS)
TABLE 69.MEXICO HEALTHCARE FABRICS MARKET, BY FABRIC TYPES, 2019–2027 ($BILLION)
TABLE 70.MEXICO HEALTHCARE FABRICS MARKET, BY APPLICATION, 2019–2027(KILOTONS)
TABLE 71.MEXICO HEALTHCARE FABRICS MARKET, BY APPLICATION, 2019–2027 ($BILLION)
TABLE 72.EUROPE HEALTHCARE FABRICS MARKET, BY RAW MATERIAL, 2019–2027(KILOTONS)
TABLE 73.EUROPE HEALTHCARE FABRICS MARKET, BY RAW MATERIAL, 2019–2027 ($BILLION)
TABLE 74.EUROPE HEALTHCARE FABRICS MARKET, BY FABRIC TYPES, 2019–2027(KILOTONS)
TABLE 75.EUROPE HEALTHCARE FABRICS MARKET, BY FABRIC TYPES, 2019–2027 ($BILLION)
TABLE 76.EUROPE HEALTHCARE FABRICS MARKET, BY APPLICATION, 2019–2027(KILOTONS)
TABLE 77.EUROPE HEALTHCARE FABRICS MARKET, BY APPLICATION, 2019–2027 ($BILLION)
TABLE 78.EUROPE HEALTHCARE FABRICS MARKET, BY COUNTRY 2019–2027(KILOTONS)
TABLE 79.EUROPE HEALTHCARE FABRICS MARKET, BY COUNTRY 2019–2027 ($BILLION)
TABLE 80.GERMANY HEALTHCARE FABRICS MARKET, BY RAW MATERIAL, 2019–2027(KILOTONS)
TABLE 81.GERMANY HEALTHCARE FABRICS MARKET, BY RAW MATERIAL, 2019–2027 ($BILLION)
TABLE 82.GERMANY HEALTHCARE FABRICS MARKET, BY FABRIC TYPES, 2019–2027(KILOTONS)
TABLE 83.GERMANY HEALTHCARE FABRICS MARKET, BY FABRIC TYPES, 2019–2027 ($BILLION)
TABLE 84.GERMANY HEALTHCARE FABRICS MARKET, BY APPLICATION, 2019–2027(KILOTONS)
TABLE 85.GERMANY HEALTHCARE FABRICS MARKET, BY APPLICATION, 2019–2027 ($BILLION)
TABLE 86.UK HEALTHCARE FABRICS MARKET, BY RAW MATERIAL, 2019–2027(KILOTONS)
TABLE 87.UK HEALTHCARE FABRICS MARKET, BY RAW MATERIAL, 2019–2027 ($BILLION)
TABLE 88.UK HEALTHCARE FABRICS MARKET, BY FABRIC TYPES, 2019–2027(KILOTONS)
TABLE 89.UK HEALTHCARE FABRICS MARKET, BY FABRIC TYPES, 2019–2027 ($BILLION)
TABLE 90.UK HEALTHCARE FABRICS MARKET, BY APPLICATION, 2019–2027(KILOTONS)
TABLE 91.UK HEALTHCARE FABRICS MARKET, BY APPLICATION, 2019–2027 ($BILLION)
TABLE 92.FRANCE HEALTHCARE FABRICS MARKET, BY RAW MATERIAL, 2019–2027(KILOTONS)
TABLE 93.FRANCE HEALTHCARE FABRICS MARKET, BY RAW MATERIAL, 2019–2027 ($BILLION)
TABLE 94.FRANCE HEALTHCARE FABRICS MARKET, BY FABRIC TYPES, 2019–2027(KILOTONS)
TABLE 95.FRANCE HEALTHCARE FABRICS MARKET, BY FABRIC TYPES, 2019–2027 ($BILLION)
TABLE 96.FRANCE HEALTHCARE FABRICS MARKET, BY APPLICATION, 2019–2027(KILOTONS)
TABLE 97.FRANCE HEALTHCARE FABRICS MARKET, BY APPLICATION, 2019–2027 ($BILLION)
TABLE 98.ITALY HEALTHCARE FABRICS MARKET, BY RAW MATERIAL, 2019–2027(KILOTONS)
TABLE 99.ITALY HEALTHCARE FABRICS MARKET, BY RAW MATERIAL, 2019–2027 ($BILLION)
TABLE 100.ITALY HEALTHCARE FABRICS MARKET, BY FABRIC TYPES, 2019–2027(KILOTONS)
TABLE 101.ITALY HEALTHCARE FABRICS MARKET, BY FABRIC TYPES, 2019–2027 ($BILLION)
TABLE 102.ITALYHEALTHCARE FABRICS MARKET, BY APPLICATION, 2019–2027(KILOTONS)
TABLE 103.ITALYHEALTHCARE FABRICS MARKET, BY APPLICATION, 2019–2027 ($BILLION)
TABLE 104.SPAIN HEALTHCARE FABRICS MARKET, BY RAW MATERIAL, 2019–2027(KILOTONS)
TABLE 105.SPAIN HEALTHCARE FABRICS MARKET, BY RAW MATERIAL, 2019–2027 ($BILLION)
TABLE 106.SPAIN HEALTHCARE FABRICS MARKET, BY FABRIC TYPES, 2019–2027(KILOTONS)
TABLE 107.SPAIN HEALTHCARE FABRICS MARKET, BY FABRIC TYPES, 2019–2027 ($BILLION)
TABLE 108.SPAIN HEALTHCARE FABRICS MARKET, BY APPLICATION, 2019–2027(KILOTONS)
TABLE 109.SPAIN HEALTHCARE FABRICS MARKET, BY APPLICATION, 2019–2027 ($BILLION)
TABLE 110.REST OF EUROPE HEALTHCARE FABRICS MARKET, BY RAW MATERIAL, 2019–2027(KILOTONS)
TABLE 111.REST OF EUROPE HEALTHCARE FABRICS MARKET, BY RAW MATERIAL, 2019–2027 ($BILLION)
TABLE 112.REST OF EUROPE HEALTHCARE FABRICS MARKET, BY FABRIC TYPES, 2019–2027(KILOTONS)
TABLE 113.REST OF EUROPE HEALTHCARE FABRICS MARKET, BY FABRIC TYPES, 2019–2027 ($BILLION)
TABLE 114.REST OF EUROPE HEALTHCARE FABRICS MARKET, BY APPLICATION, 2019–2027(KILOTONS)
TABLE 115.REST OF EUROPE HEALTHCARE FABRICS MARKET, BY APPLICATION, 2019–2027 ($BILLION)
TABLE 116.ASIA-PACIFIC HEALTHCARE FABRICS MARKET, BY RAW MATERIAL, 2019–2027(KILOTONS)
TABLE 117.ASIA-PACIFIC HEALTHCARE FABRICS MARKET, BY RAW MATERIAL, 2019–2027 ($BILLION)
TABLE 118.ASIA-PACIFIC HEALTHCARE FABRICS MARKET, BY FABRIC TYPES, 2019–2027(KILOTONS)
TABLE 119.ASIA-PACIFIC HEALTHCARE FABRICS MARKET, BY FABRIC TYPES, 2019–2027 ($BILLION)
TABLE 120.ASIA-PACIFIC HEALTHCARE FABRICS MARKET, BY APPLICATION, 2019–2027(KILOTONS)
TABLE 121.ASIA-PACIFIC HEALTHCARE FABRICS MARKET, BY APPLICATION, 2019–2027 ($BILLION)
TABLE 122.ASIA-PACIFIC HEALTHCARE FABRICS MARKET, BY COUNTRY 2019–2027(KILOTONS)
TABLE 123.ASIA-PACIFIC HEALTHCARE FABRICS MARKET, BY COUNTRY 2019–2027 ($BILLION)
TABLE 124.CHINA HEALTHCARE FABRICS MARKET, BY RAW MATERIAL, 2019–2027(KILOTONS)
TABLE 125.CHINA HEALTHCARE FABRICS MARKET, BY RAW MATERIAL, 2019–2027 ($BILLION)
TABLE 126.CHINA HEALTHCARE FABRICS MARKET, BY FABRIC TYPES, 2019–2027(KILOTONS)
TABLE 127.CHINA HEALTHCARE FABRICS MARKET, BY FABRIC TYPES, 2019–2027 ($BILLION)
TABLE 128.CHINA HEALTHCARE FABRICS MARKET, BY APPLICATION, 2019–2027(KILOTONS)
TABLE 129.CHINA HEALTHCARE FABRICS MARKET, BY APPLICATION, 2019–2027 ($BILLION)
TABLE 130.JAPAN HEALTHCARE FABRICS MARKET, BY RAW MATERIAL, 2019–2027(KILOTONS)
TABLE 131.JAPAN HEALTHCARE FABRICS MARKET, BY RAW MATERIAL, 2019–2027 ($BILLION)
TABLE 132.JAPAN HEALTHCARE FABRICS MARKET, BY FABRIC TYPES, 2019–2027(KILOTONS)
TABLE 133.JAPAN HEALTHCARE FABRICS MARKET, BY FABRIC TYPES, 2019–2027 ($BILLION)
TABLE 134.JAPAN HEALTHCARE FABRICS MARKET, BY APPLICATION, 2019–2027(KILOTONS)
TABLE 135.JAPAN HEALTHCARE FABRICS MARKET, BY APPLICATION, 2019–2027 ($BILLION)
TABLE 136.INDIA HEALTHCARE FABRICS MARKET, BY RAW MATERIAL, 2019–2027(KILOTONS)
TABLE 137.INDIA HEALTHCARE FABRICS MARKET, BY RAW MATERIAL, 2019–2027 ($BILLION)
TABLE 138.INDIA HEALTHCARE FABRICS MARKET, BY FABRIC TYPES, 2019–2027(KILOTONS)
TABLE 139.INDIA HEALTHCARE FABRICS MARKET, BY FABRIC TYPES, 2019–2027 ($BILLION)
TABLE 140.INDIA HEALTHCARE FABRICS MARKET, BY APPLICATION, 2019–2027(KILOTONS)
TABLE 141.INDIA HEALTHCARE FABRICS MARKET, BY APPLICATION, 2019–2027 ($BILLION)
TABLE 142.SOUTH KOREA HEALTHCARE FABRICS MARKET, BY RAW MATERIAL, 2019–2027(KILOTONS)
TABLE 143.SOUTH KOREA HEALTHCARE FABRICS MARKET, BY RAW MATERIAL, 2019–2027 ($BILLION)
TABLE 144.SOUTH KOREA HEALTHCARE FABRICS MARKET, BY FABRIC TYPES, 2019–2027(KILOTONS)
TABLE 145.SOUTH KOREA HEALTHCARE FABRICS MARKET, BY FABRIC TYPES, 2019–2027 ($BILLION)
TABLE 146.SOUTH KOREA HEALTHCARE FABRICS MARKET, BY APPLICATION, 2019–2027(KILOTONS)
TABLE 147.SOUTH KOREA HEALTHCARE FABRICS MARKET, BY APPLICATION, 2019–2027 ($BILLION)
TABLE 148.AUSTRALIA HEALTHCARE FABRICS MARKET, BY RAW MATERIAL, 2019–2027(KILOTONS)
TABLE 149.AUSTRALIA HEALTHCARE FABRICS MARKET, BY RAW MATERIAL, 2019–2027 ($BILLION)
TABLE 150.AUSTRALIA HEALTHCARE FABRICS MARKET, BY FABRIC TYPES, 2019–2027(KILOTONS)
TABLE 151.AUSTRALIA HEALTHCARE FABRICS MARKET, BY FABRIC TYPES, 2019–2027 ($BILLION)
TABLE 152.AUSTRALIA HEALTHCARE FABRICS MARKET, BY APPLICATION, 2019–2027(KILOTONS)
TABLE 153.AUSTRALIA HEALTHCARE FABRICS MARKET, BY APPLICATION, 2019–2027 ($BILLION)
TABLE 154.REST OF ASIA-PACIFIC HEALTHCARE FABRICS MARKET, BY RAW MATERIAL, 2019–2027(KILOTONS)
TABLE 155.REST OF ASIA-PACIFIC HEALTHCARE FABRICS MARKET, BY RAW MATERIAL, 2019–2027 ($BILLION)
TABLE 156.REST OF ASIA-PACIFIC HEALTHCARE FABRICS MARKET, BY FABRIC TYPES, 2019–2027(KILOTONS)
TABLE 157.REST OF ASIA-PACIFIC HEALTHCARE FABRICS MARKET, BY FABRIC TYPES, 2019–2027 ($BILLION)
TABLE 158.REST OF ASIA-PACIFIC HEALTHCARE FABRICS MARKET, BY APPLICATION, 2019–2027(KILOTONS)
TABLE 159.REST OF ASIA-PACIFIC HEALTHCARE FABRICS MARKET, BY APPLICATION, 2019–2027 ($BILLION)
TABLE 160.LAMEA HEALTHCARE FABRICS MARKET, BY RAW MATERIAL, 2019–2027(KILOTONS)
TABLE 161.LAMEA HEALTHCARE FABRICS MARKET, BY RAW MATERIAL, 2019–2027 ($BILLION)
TABLE 162.LAMEA HEALTHCARE FABRICS MARKET, BY FABRIC TYPES, 2019–2027(KILOTONS)
TABLE 163.LAMEA HEALTHCARE FABRICS MARKET, BY FABRIC TYPES, 2019–2027 ($BILLION)
TABLE 164.LAMEA HEALTHCARE FABRICS MARKET, BY APPLICATION, 2019–2027(KILOTONS)
TABLE 165.LAMEA HEALTHCARE FABRICS MARKET, BY APPLICATION, 2019–2027 ($BILLION)
TABLE 166.LAMEA HEALTHCARE FABRICS MARKET, BY COUNTRY 2019–2027(KILOTONS)
TABLE 167.LAMEA HEALTHCARE FABRICS MARKET, BY COUNTRY 2019–2027 ($BILLION)
TABLE 168.BRAZIL HEALTHCARE FABRICS MARKET, BY RAW MATERIAL, 2019–2027(KILOTONS)
TABLE 169.BRAZIL HEALTHCARE FABRICS MARKET, BY RAW MATERIAL, 2019–2027 ($BILLION)
TABLE 170.BRAZIL HEALTHCARE FABRICS MARKET, BY FABRIC TYPES, 2019–2027(KILOTONS)
TABLE 171.BRAZIL HEALTHCARE FABRICS MARKET, BY FABRIC TYPES, 2019–2027 ($BILLION)
TABLE 172.BRAZIL HEALTHCARE FABRICS MARKET, BY APPLICATION, 2019–2027(KILOTONS)
TABLE 173.BRAZIL HEALTHCARE FABRICS MARKET, BY APPLICATION, 2019–2027 ($BILLION)
TABLE 174.SAUDI ARABIA HEALTHCARE FABRICS MARKET, BY RAW MATERIAL, 2019–2027(KILOTONS)
TABLE 175.SAUDI ARABIA HEALTHCARE FABRICS MARKET, BY RAW MATERIAL, 2019–2027 ($BILLION)
TABLE 176.SAUDI ARABIA HEALTHCARE FABRICS MARKET, BY FABRIC TYPES, 2019–2027(KILOTONS)
TABLE 177.SAUDI ARABIA HEALTHCARE FABRICS MARKET, BY FABRIC TYPES, 2019–2027 ($BILLION)
TABLE 178.SAUDI ARABIA HEALTHCARE FABRICS MARKET, BY APPLICATION, 2019–2027(KILOTONS)
TABLE 179.SAUDI ARABIA HEALTHCARE FABRICS MARKET, BY APPLICATION, 2019–2027 ($BILLION)
TABLE 180.SOUTH AFRICA HEALTHCARE FABRICS MARKET, BY RAW MATERIAL, 2019–2027(KILOTONS)
TABLE 181.SOUTH AFRICA HEALTHCARE FABRICS MARKET, BY RAW MATERIAL, 2019–2027 ($BILLION)
TABLE 182.SOUTH AFRICA HEALTHCARE FABRICS MARKET, BY FABRIC TYPES, 2019–2027(KILOTONS)
TABLE 183.SOUTH AFRICA HEALTHCARE FABRICS MARKET, BY FABRIC TYPES, 2019–2027 ($BILLION)
TABLE 184.SOUTH AFRICA HEALTHCARE FABRICS MARKET, BY APPLICATION, 2019–2027(KILOTONS)
TABLE 185.SOUTH AFRICA HEALTHCARE FABRICS MARKET, BY APPLICATION, 2019–2027 ($BILLION)
TABLE 186.REST OF LAMEA HEALTHCARE FABRICS MARKET, BY RAW MATERIAL, 2019–2027(KILOTONS)
TABLE 187.REST OF LAMEA HEALTHCARE FABRICS MARKET, BY RAW MATERIAL, 2019–2027 ($BILLION)
TABLE 188.REST OF LAMEA HEALTHCARE FABRICS MARKET, BY FABRIC TYPES, 2019–2027(KILOTONS)
TABLE 189.REST OF LAMEA HEALTHCARE FABRICS MARKET, BY FABRIC TYPES, 2019–2027 ($BILLION)
TABLE 190.REST OF LAMEA HEALTHCARE FABRICS MARKET, BY APPLICATION, 2019–2027(KILOTONS)
TABLE 191.REST OF LAMEA HEALTHCARE FABRICS MARKET, BY APPLICATION, 2019–2027 ($BILLION)
TABLE 192.KEY NEW PRODUCT LAUNCHES (2017-2021)
TABLE 193.KEY EXPANSIONS (2017-2021)
TABLE 194.KEY ACQUISITION (2017-2021)
TABLE 195.KEY COLLABORATION (2017-2021)
TABLE 196.KEY AGREEMENT (2017-2021)
TABLE 197.AHLSTROM-MUNKSJÖ: COMPANY SNAPSHOT
TABLE 198.AHLSTROM-MUNKSJÖ: OPERATING SEGMENTS
TABLE 199.AHLSTROM-MUNKSJÖ: PRODUCT PORTFOLIO
TABLE 200.OVERALL FINANCIAL STATUS ($MILLION)
TABLE 201.AHLSTROM-MUNKSJÖ: KEY STRATEGIC MOVES AND DEVELOPMENTS
TABLE 202.ASAHI KASEI CORPORATION: COMPANY SNAPSHOT
TABLE 203.ASAHI KASEI CORPORATION: OPERATING SEGMENTS
TABLE 204.ASAHI KASEI CORPORATION: PRODUCT PORTFOLIO
TABLE 205.OVERALL FINANCIAL STATUS ($MILLION)
TABLE 206.AVGOL: COMPANY SNAPSHOT
TABLE 207.AVGOL: PRODUCT PORTFOLIO
TABLE 208.AVGOL: KEY STRATEGIC MOVES AND DEVELOPMENTS
TABLE 209.BERRY: COMPANY SNAPSHOT
TABLE 210.BERRY: OPERATING SEGMENTS
TABLE 211.BERRY: PRODUCT PORTFOLIO
TABLE 212.OVERALL FINANCIAL STATUS ($MILLION)
TABLE 213.BERRY: KEY STRATEGIC MOVES AND DEVELOPMENTS
TABLE 214.CARNEGIE: COMPANY SNAPSHOT
TABLE 215.CARNEGIE: PRODUCT PORTFOLIO
TABLE 216.EXIMIUS INCORPORATION: COMPANY SNAPSHOT
TABLE 217.EXIMIUS INCORPORATION: PRODUCT PORTFOLIO
TABLE 218.FREUDENBERG GROUP: COMPANY SNAPSHOT
TABLE 219.FREUDENBERG GROUP: PRODUCT PORTFOLIO
TABLE 220.OVERALL FINANCIAL STATUS ($MILLION)
TABLE 221.FREUDENBERG GROUP: KEY STRATEGIC MOVES AND DEVELOPMENTS
TABLE 222.KIMBERLY-CLARK: COMPANY SNAPSHOT
TABLE 223.KIMBERLY-CLARK: OPERATING SEGMENTS
TABLE 224.KIMBERLY-CLARK: PRODUCT PORTFOLIO
TABLE 225.OVERALL FINANCIAL STATUS ($MILLION)
TABLE 226.KIMBERLY-CLARK: KEY STRATEGIC MOVES AND DEVELOPMENTS
TABLE 227.KNOLL: COMPANY SNAPSHOT
TABLE 228.KNOLL: OPERATING SEGMENTS
TABLE 229.KNOLL: PRODUCT PORTFOLIO
TABLE 230.OVERALL FINANCIAL STATUS ($MILLION)
TABLE 231.KNOLL: KEY STRATEGIC MOVES AND DEVELOPMENTS
TABLE 232.PARAMOUNT TECH FAB INDUSTRIES: COMPANY SNAPSHOT
TABLE 233.PARAMOUNT TECH FAB INDUSTRIES: PRODUCT PORTFOLIO

LIST OF FIGURES

FIGURE 01.GLOBAL HEALTHCARE FABRICS MARKET SEGMENTATION
FIGURE 02.TOP INVESTMENT POCKETS, BY FABRIC TYPE (2019)
FIGURE 03.MODERATE BARGAINING POWER OF SUPPLIERS
FIGURE 04.LOW BARGAINING POWER OF BUYERS
FIGURE 05.MODERATE THREAT OF NEW ENTRANTS
FIGURE 06.MODERATE THREAT OF SUBSTITUTES
FIGURE 07.HIGH INTENSITY OF COMPETITIVE RIVALRY
FIGURE 08.HEALTHCARE FABRICS MARKET DYNAMICS
FIGURE 09.PATENT ANALYSIS, BY COUNTRY
FIGURE 10.COMPARATIVE ANALYSIS OF HEALTHCARE FABRICS MARKET FOR POLYPROPYLENE, BY COUNTRY,  2019& 2027($BILLION)
FIGURE 11.COMPARATIVE ANALYSIS OF HEALTHCARE FABRICS MARKET FOR COTTON, BY COUNTRY, 2019& 2027 ($BILLION)
FIGURE 12.COMPARATIVE ANALYSIS OF HEALTHCARE FABRICS MARKET FOR POLYESTER, BY COUNTRY,  2019& 2027($BILLION)
FIGURE 13.COMPARATIVE ANALYSIS OF HEALTHCARE FABRICS MARKET FOR VISCOSE, BY COUNTRY,  2019& 2027($BILLION)
FIGURE 14.COMPARATIVE ANALYSIS OF HEALTHCARE FABRICS MARKET FOR POLYAMIDE, BY COUNTRY, 2019& 2027 ($BILLION)
FIGURE 15.COMPARATIVE ANALYSIS OF HEALTHCARE FABRICS MARKET FOR OTHERS , BY COUNTRY, 2019& 2027 ($BILLION)
FIGURE 16.COMPARATIVE ANALYSIS OF HEALTHCARE FABRICS MARKET FOR NON-WOVEN, BY COUNTRY, 2019& 2027 ($BILLION)
FIGURE 17.COMPARATIVE ANALYSIS OF HEALTHCARE FABRICS MARKET FOR WOVEN, BY COUNTRY, 2019& 2027 ($BILLION)
FIGURE 18.COMPARATIVE ANALYSIS OF HEALTHCARE FABRICS MARKET FOR KNITTED, BY COUNTRY, 2019& 2027 ($BILLION)
FIGURE 19.COMPARATIVE ANALYSIS OF HEALTHCARE FABRICS MARKET FOR HYGIENE PRODUCTS, BY COUNTRY, 2019 & 2027 ($BILLION)
FIGURE 20.COMPARATIVE ANALYSIS OF HEALTHCARE FABRICS MARKET FOR DRESSING PRODUCTS, BY COUNTRY, 2019& 2027 ($BILLION)
FIGURE 21.COMPARATIVE ANALYSIS OF HEALTHCARE FABRICS MARKET FOR CLOTHING, BY COUNTRY,  2019& 2027 ($BILLION)
FIGURE 22.COMPARATIVE ANALYSIS OF HEALTHCARE FABRICS MARKET FOR BLANKET & BEDDING, BY COUNTRY, 2019& 2027 ($BILLION)
FIGURE 23.COMPARATIVE ANALYSIS OF HEALTHCARE FABRICS MARKET FOR UPHOLSTERY, BY COUNTRY, 2019& 2027 ($BILLION)
FIGURE 24.COMPARATIVE ANALYSIS OF HEALTHCARE FABRICS MARKET FOR PRIVACY CURTAINS, BY COUNTRY, 2019& 2027 ($BILLION)
FIGURE 25.COMPARATIVE ANALYSIS OF HEALTHCARE FABRICS MARKET FOR OTHERS, BY COUNTRY, 2019& 2027 ($BILLION)
FIGURE 26.U.S. REVENUE FOR HEALTHCARE FABRICS 2019–2027, ($BILLION)
FIGURE 27.CANADA REVENUE FOR HEALTHCARE FABRICS 2019–2027, ($BILLION)
FIGURE 28.MEXICO REVENUE FOR HEALTHCARE FABRICS 2019–2027, ($BILLION)
FIGURE 29.GERMANY REVENUE FOR HEALTHCARE FABRICS 2019–2027, ($BILLION)
FIGURE 30.UK REVENUE FOR HEALTHCARE FABRICS 2019–2027, ($BILLION)
FIGURE 31.FRANCE REVENUE FOR HEALTHCARE FABRICS 2019–2027, ($BILLION)
FIGURE 32.ITALY REVENUE FOR HEALTHCARE FABRICS 2019–2027, ($BILLION)
FIGURE 33.SPAIN REVENUE FOR HEALTHCARE FABRICS 2019–2027, ($BILLION)
FIGURE 34.REST OF EUROPE REVENUE FOR HEALTHCARE FABRICS 2019–2027, ($BILLION)
FIGURE 35.CHINA REVENUE FOR HEALTHCARE FABRICS 2019–2027, ($BILLION)
FIGURE 36.JAPAN REVENUE FOR HEALTHCARE FABRICS 2019–2027, ($BILLION)
FIGURE 37.INDIA REVENUE FOR HEALTHCARE FABRICS 2019–2027, ($BILLION)
FIGURE 38.SOUTH KOREA REVENUE FOR HEALTHCARE FABRICS 2019–2027, ($BILLION)
FIGURE 39.AUSTRALIA REVENUE FOR HEALTHCARE FABRICS 2019–2027, ($BILLION)
FIGURE 40.REST OF ASIA-PACIFIC REVENUE FOR HEALTHCARE FABRICS 2019–2027, ($BILLION)
FIGURE 41.BRAZIL REVENUE FOR HEALTHCARE FABRICS 2019–2027, ($BILLION)
FIGURE 42.SAUDI ARABIA REVENUE FOR HEALTHCARE FABRICS 2019–2027, ($BILLION)
FIGURE 43.SOUTH AFRICA REVENUE FOR HEALTHCARE FABRICS 2019–2027, ($BILLION)
FIGURE 44.REST OF LAMEA REVENUE FOR HEALTHCARE FABRICS 2019–2027, ($BILLION)
FIGURE 45.MARKET PLAYER POSITIONING, 2019
FIGURE 46.TOP WINNING STRATEGIES, BY YEAR, 2017–2021
FIGURE 47.TOP WINNING STRATEGIES, BY DEVELOPMENT, 2017–2021 (%)
FIGURE 48.TOP WINNING STRATEGIES, BY COMPANY, 2017–2021
FIGURE 49.PRODUCT MAPPING OF TOP 10 PLAYERS
FIGURE 50.COMPETITIVE HEATMAP OF KEY PLAYERS
FIGURE 51.AHLSTROM-MUNKSJÖ: REVENUE, 2017–2019 ($MILLION)
FIGURE 52.AHLSTROM-MUNKSJÖ: REVENUE SHARE BY SEGMENT, 2019 (%)
FIGURE 53.AHLSTROM-MUNKSJÖ: REVENUE SHARE BY REGION, 2019 (%)
FIGURE 54.ASAHI KASEI CORPORATION: REVENUE, 2017–2019 ($MILLION)
FIGURE 55.ASAHI KASEI CORPORATION: REVENUE SHARE BY SEGMENT, 2019 (%)
FIGURE 56.ASAHI KASEI CORPORATION: REVENUE SHARE BY REGION, 2019 (%)
FIGURE 57.BERRY: REVENUE, 2018–2020 ($MILLION)
FIGURE 58.BERRY: REVENUE SHARE BY SEGMENT, 2020 (%)
FIGURE 59.BERRY: REVENUE SHARE BY REGION, 2020 (%)
FIGURE 60.FREUDENBERG GROUP: REVENUE, 2018–2020 ($MILLION)
FIGURE 61.FREUDENBERG GROUP: REVENUE SHARE BY REGION, 2020 (%)
FIGURE 62.KIMBERLY-CLARK: REVENUE, 2018–2020 ($MILLION)
FIGURE 63.KIMBERLY-CLARK: REVENUE SHARE BY SEGMENT, 2020 (%)
FIGURE 64.KIMBERLY-CLARK: REVENUE SHARE BY REGION, 2020 (%)
FIGURE 65.KNOLL: REVENUE, 2018–2020 ($MILLION)
FIGURE 66.KNOLL: REVENUE SHARE BY SEGMENT, 2020 (%)
FIGURE 67.KNOLL: REVENUE SHARE BY REGION, 2020 (%)


According to the CXO of the leading companies, in its business life cycle, the global demand for healthcare fabrics is heading toward a period of growth stabilization. Increased knowledge of hygiene products through promotions is primarily driving the healthcare fabrics market, and advertisement is primarily driving the healthcare fabrics market. Polypropylene is the most important raw material used in healthcare fabrics. Since polypropylene is used to make the top sheet of hygiene items, such as sanitary napkins and baby diapers, the polypropylene segment is expected to witness growth during the forecast period.

The non-woven fabric segment was the largest segment in 2019, and is expected to remain dominant during the forecast period.  Because of their excellent absorption properties, softness, smoothness, strength, comfort and fit, stretch ability, and cost-effectiveness, nonwoven fabrics are used as a substitute for conventional textiles. Hygiene is the largest application of the healthcare fabrics market. The demand for hygiene products is being driven by the growing importance of healthcare fabrics in the manufacturing of baby diapers and sanitary napkins. Furthermore, increase in disposable income, and surge in birth rates are expected to drive the healthcare fabrics market in hygiene products. However, during the forecast period, Europe is expected to have the highest CAGR. Increasing health and hygiene awareness is driving the demand for feminine hygiene products, which is expected to boost the demand for healthcare fabrics in Europe.

PURCHASE OPTIONS

Call or Email us

U.S.-Canada Toll-free: +1-800-792-5285
Int'l : +1-503-894-6022
Europe : +44-845-528-1300
Email : help@alliedmarketresearch.com
 
FREQUENTLY ASKED QUESTIONS?

A. The global healthcare fabric Market is projected to grow at CAGR of 13.0% during the forecast period

A. Hygiene products, dressing products and clothing application is projected to increase the demand for healthcare fabrics market

A. Non-woven fabric is the leading segment in the healthcare fabric market

A. The number of working women around the world as well as government campaigns to encourage use of sanitary napkins even in rural areas are expected to propel the healthcare fabrics market during the forecast period

A. Asahi Kasei Corporation, Avgol Ltd, Berry Global Group Inc., Carnegie Fabrics LLC, Eximius Incorporation, Freudenberg Group, and Kimberly-Clark Corporation are the leading players in healthcare fabric market

A. During the COVID-19 outbreak, the high consumption rate of medical garments and other fabrics-based items is expected to fuel the demand in the global healthcare fabrics market

A. Europe region hold the highest share in the healthcare fabric market

A. The market growth is primarily due to the growing awareness of hygiene products coupled with the availability of highly efficient and innovative products in the market.

Looking for Customization?

 Customization Request

Have a Question?

 Speak with Analyst

Any Confusion?

 Inquire Before Buying

Have a glance of the Report

  Request Sample
RELATED TAGS

Purchase Full Report of
Healthcare Fabrics Market

Start reading instantly.
This Report and over 67,404+ more Reports, Available with Avenue Library. T&C*.

  • Online Only
  • $3,456
  • Online cloud access only
  • Restricted print, copy, paste & download
  • Read only
  • Free industry update
    (Within 180 days)
  • Free report update in next update cycle
    (Apr 2022 - Apr 2023)
  • Data Pack
  • $3,840
  • Restricted to one authorized user
  • One print only
  • Available in
    Excel
  • Free industry update
    (Within 180 days)
  •   Free report update in next update cycle
    (Apr 2022 - Apr 2023)
  • Single User
  • $5,769
  • Restricted to one authorized user
  • One print only
  • Available in
    PDF
  • Free industry update
    (Within 180 days)
  •   Free report update in next update cycle
    (Apr 2022 - Apr 2023)
  • Five Users
  • $6,450
  • Limited to five authorized users
  • Print upto five copies
  • Available in
    PDF
  • Free industry update
    (Within 180 days)
  •   Free report update in next update cycle
    (Apr 2022 - Apr 2023)
  • Enterprise
    License/PDF

  • $10,995
  • Unlimited
    within
    company/enterprise
  • Available in Excel & PDF
  • Free industry update
    (Within 180 days)
  •   Free report update in next update cycle
    (Apr 2022 - Apr 2023)
  • Library
    Membership

  • $999 $ 1,175
    Per User/ Per month/ Billed annually
  • Published Content
    E-access
  • Company Profiles
    E-access
  • Newly Added Content Access
  • 10 PDF
    Downloads
  • 5 Excel Data
    Pack Downloads
  • 250 Company Profiles PDF Downloads
  • Buy Now

*Taxes/Fees, if applicable will be added during checkout. All prices in USD

RELATED REPORTS
 

Why Allied Market Research?


Infallible Methodology

To ensure high-level data integrity, accurate analysis, and impeccable forecasts

Analyst Support

For complete satisfaction

Customization

On-demand customization of scope of the report to exactly meet your needs

TARGETED MARKET VIEW

Targeted market view to provide pertinent information and save time of readers

Get fresh content delivered

Get insights on topics that are crucial for your business. Stay abreast of your interest areas.

Get Industry Data Alerts

Why Allied Market Research?

Infallible Methodology

To ensure high-level data integrity, accurate analysis, and impeccable forecasts

Analyst Support

For complete satisfaction

Customization

On-demand customization of scope of the report to exactly meet your needs

TARGETED MARKET VIEW

Targeted market view to provide pertinent information and save time of readers