
Healthcare Wipes Market Research, 2033
Market Introduction and Definition
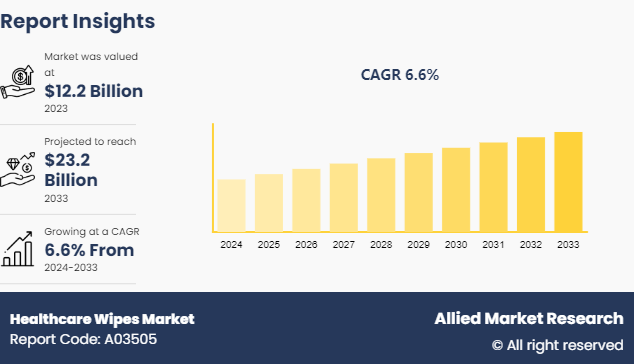
The global healthcare wipes market was valued at $12.2 billion in 2023, and is projected to reach $23.2 billion by 2033, growing at a CAGR of 6.6% from 2024 to 2033. Healthcare wipes are disposable cloths utilized to clean and disinfect surfaces, skin, and medical equipment at facilities including hospitals, clinics, and nursing homes. These wipes contain antiseptic solutions to lower the risk of infection and are widely used for patient care, surface cleaning, and hand sanitation. The growing public awareness of hospital-acquired infections (HAIs) and the need to maintain high hygiene standards in healthcare institutions has boosted the need for efficient disinfection products. Furthermore, the aging population and the growth in chronic conditions need more regular and thorough cleaning regimens, which further propels the healthcare wipes market growth. Technological improvements have led to the creation of more effective and safer disinfection formulas, hence increasing the attractiveness and efficacy of healthcare wipes.
Key Takeaways
The healthcare wipes market study covers 20 countries. The research includes a segment analysis of each country in terms of value ($Billion) for the projected period 2024-2033.
More than 1, 500 product literatures, industry releases, annual reports, and other such documents of major healthcare wipes industry participants along with authentic industry journals, trade associations' releases, and government websites have been reviewed for generating high-value industry insights.
The study integrated high-quality data, professional opinions and analysis, and critical independent perspectives. The research approach is intended to provide a balanced view of global markets and to assist stakeholders in making educated decisions in order to achieve their most ambitious growth objectives.
Key market dynamics
The increased emphasis on cleanliness and infection control has considerably fueled the expansion of the healthcare wipes market in the past couple of years, as indicated by increased demand during the COVID-19 pandemic. The rise was fueled by the requirement to keep sterile conditions to avoid viral transmission. Furthermore, statistics from the U.S. Centers for Disease Control and Prevention (CDC) found that healthcare-associated infections (HAIs) decreased by around 30% in institutions that employed stringent cleaning processes, including regular application of healthcare wipes. These findings highlight the importance of healthcare wipes in the prevention of infection.
The disposal of single-use healthcare wipes raises serious environmental problems, impeding the expansion during the healthcare wipes market forecast period. These wipes are mostly composed of synthetic fibers such as polyester and polypropylene, that are nonbiodegradable which leads to landfill trash and marine contamination. This problem has prompted increased governmental attention and popular pushback against single-use plastics. For instance, in 2023, the European Union implemented stronger limits on single-use plastics, such as healthcare wipes, to reduce plastic waste by 50% by 2025. Furthermore, environmental organizations have actively campaigned against the consumption of disposable wipes, highlighting their long-term environmental effect. These issues have motivated healthcare practitioners and customers to seek out more environment-friendly options, which include reusable cloth wipes or compostable choices.
Material science and production innovations are resulting in more effective, environmentally friendly, and cost-effective healthcare wipes which are acting as a opportunity healthcare wipes market demand. Recent breakthroughs in nanotechnology?have helped make it possible to produce antimicrobial wipes with improved germ-killing characteristics, providing greater protection against healthcare-associated illnesses. Furthermore, the creation of compostable and biodegradable wipes manufactured from natural fibers like bamboo and cotton answers rising environmental concerns. These technical improvements not only match the growing need for effective hygiene solutions but also correlate with global environmental goals, resulting in significant growth in the healthcare wipes industry.
Value Chain Analysis of Global Healthcare Wipes Market
Raw Material Sourcing
The healthcare wipes market value chain begins with the procurement of raw materials, which comprise both natural fibers (such as cotton and bamboo) and synthetic fibers. Suppliers of?raw ingredients must ensure that the ingredients fulfill particular quality criteria to?ensure the finished product's safety and effectiveness.??
Manufacturing
During the production stage, raw materials are converted into healthcare wipes using methods such as spinning, weaving, or non-woven technologies, then cut, treated with disinfectants or antiseptics, and packaged. This stage necessitates specialized equipment and procedures to guarantee that the wipes are manufactured effectively and follow strict health and safety regulations.??
Packaging
Packaging is an important step in the value chain since it assures the quality, sterility, and accessibility of healthcare wipes. The package materials need to be carefully chosen to ensure the wipes' efficiency, avoid contamination, and make it easy for healthcare personnel to use. Packaging options frequently include resealable pouches, boxes, or single-use packages.
Distribution
Distribution is the process of transferring healthcare wipes from producers to various sites of sale, such as hospitals, clinics, pharmacies, and retail outlets. This stage needs an effective supply chain system to enable timely and safe delivery, especially in major healthcare institutions that rely on continuous supplies for daily operations.??
Sales and Marketing
The final phase of the value chain is sales and marketing, which is responsible for promoting healthcare wipes to end users and driving market demand. This includes methods such as marketing, sales promotions, and instructional efforts aimed at healthcare providers and institutions. Marketing initiatives can include attendance at healthcare trade fairs, webinars, and direct contact with significant stakeholders in healthcare companies.

Market Segmentation
The healthcare wipes market is segmented into product, distribution channel, and region. On the basis of product, the market is divided into dry wipes and wet wipes. On the basis of distribution channel, the market is classified into supermarkets/hypermarkets, departmental stores, drug stores & pharmacies, online, and others. Region wise, the market is analyzed across North America, Europe, Asia-Pacific, and LAMEA.
Regional/Country Market Outlook
In North America, the COVID-19 pandemic increased awareness of cleanliness and prevention of infections, hastening the introduction of disinfectant wipes in healthcare and residential settings. The region also benefits from a strong healthcare infrastructure and ongoing technology breakthroughs, which promote the creation of novel and high-performing wipes.
Europe is witnessing growth in demand as a result of strict infection control and sustainable development laws. The European Union's campaign for environment-friendly products has boosted the popularity of compostable and biodegradable healthcare wipes. Furthermore, an aging population in Europe is increasing the demand for appropriate hygiene solutions in institutions for long-term care.
Rapid urbanization, growth in healthcare costs, and increased hygiene awareness are significant growth factors in Asia-Pacific. Countries such as China and India are seeing tremendous market growth as they spend considerably on healthcare infrastructure and advanced medical techniques. Furthermore, the increased frequency of chronic conditions in the region drives the requirements for healthcare wipes.
LAMEA (Latin America, the Middle East, and Africa) provides new prospects as healthcare systems improve and government efforts focusing on public health expand. In these regions, the marketplace is additionally driven by a need to battle infectious illnesses, with healthcare wipes serving an important role in infection?control and prevention.
Industry Trends:
In 2021, PDI Healthcare introduced Sani-Cloth Prime Germicidal Disposable Wipes, which offer protection against a wide range of infections, including the SARS-CoV-2 virus. This product introduction sought to address growing concerns about the transmission of viruses in hospital settings.
In 2022, Kimberly-Clark Professional introduced Kleenex Eco Wipes, which are 100% plant-based and biodegradable. This development addresses the increased need for ecologically friendly goods in the healthcare business.
In 2022, Reckitt Benckiser has extended its healthcare wipes product portfolio, which includes Lysol® Disinfectant Wipes, across Southeast Asia and Africa. This planned development was intended to meet the expanding demand for hygiene goods in these rapidly emerging countries.
Competitive Landscape
The major players operating in the market contributing to the healthcare wipes market size include Procter and Gamble, 3M, Johnson & Johnson Private Limited, Diamond Wipes International Inc, The Clorox Company, Kimberly-Clark Corporation, Ecolab Inc., Reckitt Benckiser Group PLC, Kleen-Pak Products Pte Ltd., and Beiersdorf AG.
Other players in the market to increase their healthcare wipes market share includes 2XL Corporation, Albaad Massuot Yitzhak Ltd., American Hygienics Corporation, Becton, Dickinson and Company, Cardinal Health, Inc., Colgate-Palmolive Company, Contec, Inc., Edgewell Personal Care Company, Essity AB, GAMA Healthcare Ltd., GOJO Industries, Inc., Interweave Textiles Ltd., Johnson & Johnson Services, Inc., Medline Industries, LP, Nice-Pak Products, Inc., Professional Disposables International, Inc., Rockline Industries, Inc., and others
Recent Key Strategies and Developments
In 2022, Johnson & Johnson introduced a new kind of antimicrobial wipes?that can kill 99.9% of microorganisms.
In May 2021, Glatfelter?completed its acquisition of G-P's U.S. nonwovens business. The transaction was over $175 million and included an air-laid manufacturing plant in North Carolina as well as a nonwovens product research center. The strategic movement was to improve the quality of the healthcare wipes.
In 2020, NATHEALTH and Africa Healthcare Federation reached an agreement. This resulted in the inaugural India Africa Health Summit on World UHC Day, which paved the way for cooperation, partnership, technology exchange, and innovation. The improvement in healthcare services will encourage the use of medical supplies such as healthcare cleaners and wipes to curb the spread of infections.
Key Benefits For Stakeholders
- This report provides a quantitative analysis of the market segments, current trends, estimations, and dynamics of the healthcare wipes market analysis from 2024 to 2033 to identify the prevailing healthcare wipes market opportunities.
- The market research is offered along with information related to key drivers, restraints, and opportunities.
- Porter's five forces analysis highlights the potency of buyers and suppliers to enable stakeholders make profit-oriented business decisions and strengthen their supplier-buyer network.
- In-depth analysis of the healthcare wipes market segmentation assists to determine the prevailing market opportunities.
- Major countries in each region are mapped according to their revenue contribution to the global market.
- Market player positioning facilitates benchmarking and provides a clear understanding of the present position of the market players.
- The report includes the analysis of the regional as well as global healthcare wipes market trends, key players, market segments, application areas, and market growth strategies.
Healthcare Wipes Market Report Highlights
| Aspects | Details |
| Market Size By 2033 | USD 23.2 Billion |
| Growth Rate | CAGR of 6.6% |
| Forecast period | 2024 - 2033 |
| Report Pages | 235 |
| By Product Type |
|
| By Distribution Channel |
|
| By Region |
|
| Key Market Players | The Clorox Company, Beiersdorf AG., The Procter And Gamble Company, Johnson and Johnson, 3M, Kimberly-Clark Corporation, Diamond Wipes International Inc, Ecolab Inc., Reckitt Benckiser Group PLC, Kleen-Pak Products Pte Ltd. |
The global healthcare wipes market was valued at $12.2 billion in 2023, and is projected to reach $23.2 billion by 2033, growing at a CAGR of 6.6% from 2024 to 2033.
The healthcare wipes market registered a CAGR of 6.6% from 2024 to 2033.
The forecast period in the healthcare wipes market report is from 2024 to 2033.
The top companies that hold the market share in the healthcare wipes market include Procter and Gamble, 3M, Johnson & Johnson Private Limited, Diamond Wipes International Inc, The Clorox Company, and others.
The healthcare wipes market report has 2 segments. The segments are product and distribution channel.
Loading Table Of Content...

