
Hedge Fund Market Research, 2032
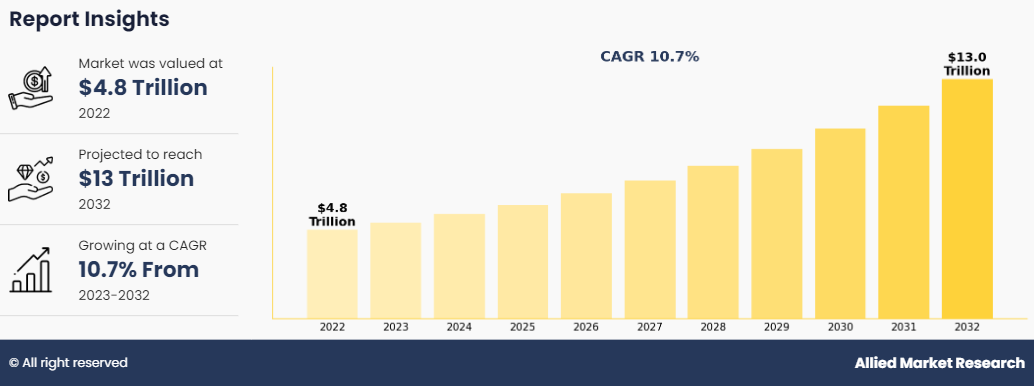
The Global Hedge Fund Market was valued at $4.8 trillion in 2022, and is projected to reach $13 trillion by 2032, growing at a CAGR of 10.7% from 2023 to 2032.
The hedge fund market refers to a segment of the financial industry where investment funds, known as hedge funds, pool capital from various investors to employ a diverse range of investment strategies. These funds are typically managed by professional investment managers or teams who aim to generate returns for investors while mitigating risk. Hedge funds have flexibility in their investment approach, allowing them to invest in a variety of assets such as stocks, bonds, currencies, commodities, and derivatives.
Key Takeaways
By strategy, the long/short equity segment accounted for the largest hedge fund market size in 2022.
Region-wise, North America generated the highest revenue in 2022.
By type, the offshore segment accounted for the largest hedge fund market share in 2022.
The increasing investments in digital assets and rise in advancements in technology boost the growth of the global hedge fund market. In addition, factors such as the evolving regulatory landscape have positively impacted the market growth. However, high fees charged by hedge funds and regulatory scrutiny & compliance costs are expected to hamper market growth. On the contrary, rise of quantitative and systematic strategies is expected to offer remunerative opportunities for the expansion of the market during the forecast period. Each of these factors is projected to have a definite impact on the global hedge fund market's growth.
The report focuses on the growth prospects, restraints, and trends of the global hedge fund market outlook. The study provides Porter's five forces analysis to understand the impact of various factors such as the bargaining power of suppliers, competitive rivalry, threat of new entrants, threat of substitutes, and bargaining power of buyers on the global hedge fund market.
Hedge Fund Market Segment Review
The global hedge fund industry is segmented by strategy, type, and region. In terms of strategy, the market is fragmented into long/short equity, event driven, currency counterfeit detector, managed futures/CTA, and others. Depending on the type, it is divided into offshore, fund of funds, and domestic. Region-wise, it is analyzed across North America, Europe, Asia-Pacific, and LAMEA.

By type, the global hedge fund market was led by the fund of funds segment in 2022 and is projected to maintain its dominance during the forecast period, as it offers investors a diversified portfolio of funds. By spreading investments across different funds and helps to reduce risk. However, the offshore segment is expected to grow at the highest rate during the forecast period, owing to technological advancement and rise in awareness among the people, which is projected to attract many new consumers, which boost the global market.

Region-wise, the global hedge fund market was dominated by North America in 2022 and is expected to retain its position during the forecast period. This is attributed to surge in demand for sophisticated risk management techniques in the region. However, Asia-Pacific is expected to witness significant growth during the forecast period, owing to the increase in prominent fund managers and substantial hedge fund assets under management (AUM) driving the industry market.
Key players that operate in the global hedge fund market are Bridgewater Associates, Renaissance Technologies, Man Group, AQR Capital Management, Two Sigma Investments, Millennium Management, Citadel LLC, Elliott Management Corporation, Brevan Howard, and BlackRock. These players have adopted various strategies to increase their market penetration and strengthen their position in the industry.
Market Landscape and Trends
The hedge fund market landscape is characterized by a dynamic interplay of various factors, reflecting the ever-evolving nature of the financial industry. Several trends and features define the current scenario in the hedge fund market. Moreover, hedge funds are known for their diverse range of investment strategies. Managers employ approaches such as long/short equity, global macro, event-driven, and quantitative strategies. This diversity allows investors to access different sources of alpha and provides flexibility in navigating changing market conditions. Furthermore, technology plays a crucial role in the industry. Firms are increasingly leveraging advanced data analytics, artificial intelligence, and machine learning to gain insights, identify investment opportunities, and manage risks more effectively. Technological advancements contribute to improved decision-making processes and operational efficiency.
Competition Analysis
Recent Strategies in the Global Hedge Fund Market
November 8, 2024, TS Imagine partnered with Kayenta to offer treasury management services to hedge fund clients. In addition, strategic partnership allowed hedge fund clients to control their financing relationships across their portfolios through TS Imagine comprehensive multi-asset trading and risk management solution, TS One.
On February 8, 2024, Ackman launched a cheaper hedge fund aimed at a wider investor pool. According to a regulatory filing which suggests the fund mimics its existing hedge fund but offers lower fees and quicker access to capital. Pershing Square USA is expected to be listed on the New York Stock Exchange and available to anyone who invest in the U.S., including pension funds, endowments, and retail investors who are normally excluded from hedge funds.
On November 3, 2023, BlackRock Alternatives (BlackRock), through a fund managed by its diversified infrastructure business, agreed to acquire Jupiter Power LLC (Jupiter). Jupiter Power is a leading United States operator and developer of stand-alone, utility-scale battery energy storage systems.
Top Impacting Factors
The Increasing Investments in Digital Assets
Investors are increasingly seeking diversification beyond traditional asset classes such as stocks and bonds. Hedge funds, with their diverse strategies and focus on uncorrelated returns, offer compelling alternatives. In addition, traditional fixed-income assets struggle to provide attractive returns, prompting investors to explore alternatives, including hedge funds that seek alpha. Moreover, periods of increased market volatility create opportunities for skilled hedge fund managers to navigate complex situations and potentially generate returns. Furthermore, institutional investors and high-net-worth individuals are becoming more advanced, seeking niche strategies and customized solutions offered by hedge funds. Such factors drive the growth of the hedge fund market.
Increase in Advancements in Technology
Technology plays a pivotal role in modern hedge fund operations. Advanced data analytics, machine learning algorithms, and artificial intelligence (AI) empower managers to extract insights from vast datasets where AI analyze complex financial data, identify hidden patterns, and generate trade signals, aiding in alpha generation. Moreover, streamlining portfolio management, risk analysis, and compliance functions improves efficiency & reduces costs. Moreover, technology expands access to alternative data sources and less-traded assets, potentially generating alpha and diversifying portfolios. Technological advancements drive efficiency, enhance decision-making, and open new investment avenues, shaping the future of the hedge fund industry.
Evolving Regulatory Landscape
Regulations play a crucial role in shaping the hedge fund space. Recent years have witnessed increased regulatory scrutiny, aiming to enhance transparency, protect investors, and address perceived systemic risks. While certain regulations create compliance burdens, they present opportunities such as improved reporting and disclosure requirements increase investor confidence and attract new capital. Moreover, fairer regulations create a more equitable market, potentially benefiting smaller and niche hedge funds. Furthermore, navigating the evolving regulatory landscape fosters innovation in compliance solutions and risk management methodologies. Such factors drive the growth of the hedge fund market.
Restraints
High Fees Charged by Hedge Funds
High fees charged by hedge funds have come under increasing scrutiny, particularly during periods of underperformance. Investors demand superior returns to justify high fees, especially relative to low-cost passive alternatives. Greater visibility into fees and performance creates pressure on managers to justify their expense ratios. Moreover, the growth of exchange-traded funds (ETFs) and other low-cost investment vehicles put pressure on hedge funds to demonstrate their value proposition.
Regulatory Scrutiny and Compliance Costs
One of the main restraints facing the hedge fund market is rise in regulatory scrutiny and compliance costs imposed by regulators globally. In the aftermath of the global financial crisis, regulators have tightened oversight of the financial market, including hedge funds, to enhance transparency, mitigate systemic risk, and protect investors. Compliance with regulatory requirements, such as reporting, registration, and disclosure obligations, has become more complex & costly for hedge fund managers. In addition, regulatory changes & uncertainty create operational challenges and limit the flexibility of hedge fund strategies, constraining market growth.
Opportunities
Rise of Quantitative and Systematic Strategies
One of the major opportunities includes rise in the adoption of quantitative and systematic investment strategies. Advances in technology, data analytics, and machine learning have enabled hedge fund managers to develop advanced quantitative models and algorithms for generating alpha and managing risk. Quantitative and systematic hedge funds leverage quantitative techniques to identify patterns, exploit market inefficiencies, and execute trades systematically based on predefined rules. As investors seek innovative and systematic approaches to investment management, hedge funds that specialize in quantitative strategies are well-positioned to capitalize on this trend and attract investor capital. Moreover, proliferation of alternative data sources and democratization of quantitative tools offer new avenues for hedge fund managers to differentiate themselves and generate alpha in a competitive hedge fund market landscape.
Report Coverage & Deliverables
Regional Insights
North America leads the hedge fund size, with the U.S. accounting for the largest share due to a high concentration of fund managers and investors. Europe follows closely, particularly with significant contributions from the UK. Asia-Pacific is seeing rapid growth, driven by rising investor interest in China and Hong Kong.
Solution Insights
The hedge fund market is driven by innovative fund strategies, AI-based trading solutions, and risk management tools that enhance portfolio diversification and returns. These solutions are adopted to optimize fund performance and manage market volatility.
Key Companies & Market Share Insights
Top players include Bridgewater Associates, Man Group, and AQR Capital, holding significant market shares through diversified investment strategies and technological innovations.
Major companies in the hedge fund market are competing for revenue share through strategic partnerships, innovative investment solutions, and the continuous expansion of assets under management. By enhancing offerings to garner a broader investor base and solidify their market positions.
For instance, In July 2023, The Scotia Private Client Group introduced the Scotia Long Short Equity Fund, an inaugural alternative investment within its private investment counsel. This fund empowers accredited investors to manage volatility and downside risk while capitalizing on the potential upside of equity market.
Key Benefits for Stakeholders
This report provides a quantitative analysis of the market segments, current trends, estimations, and dynamics of the global Hedge fund market analysis from 2023 to 2032 to identify the prevailing global hedge fund market opportunity.
The market research is offered along with information related to key drivers, restraints, and opportunities.
Porter's five forces analysis highlights the potency of buyers and suppliers to enable stakeholders to make profit-oriented business decisions and strengthen their supplier-buyer network.
In-depth analysis of the global Hedge fund market segmentation assists to determine the prevailing market opportunities.
Major countries in each region are mapped according to their revenue contribution to the global hedge fund market forecast.
Market player positioning facilitates benchmarking and provides a clear understanding of the present position of the market players.
The report includes the analysis of the regional as well as global Hedge fund market trends, key players, market segments, application areas, and market growth strategies.
Hedge Fund Market Report Highlights
| Aspects | Details |
| Forecast period | 2022 - 2032 |
| Report Pages | 264 |
| By Strategy |
|
| By Type |
|
| By Region |
|
| Key Market Players | ridgewater Associates LP, Davidson Kempner Capital Management LP, Citadel Enterprise Americas LLC, AQR Capital Management LLC, Two Sigma Investments LP, Man Group Ltd, Millennium Management LLC, Renaissance Technologies LLC, Elliott Investment Management LP, Black Rock Inc |
Analyst Review
Hedge funds are investment vehicles managed by professional portfolio managers who seek to generate returns for investors by employing a wide range of investment strategies. These strategies often aim to generate positive returns regardless of market conditions, hence the term "hedging" against market risks. Hedge funds, in contrast to mutual funds, generally serve advanced and experienced investors, including high-net-worth individuals, institutional investors, and pension funds.
Key providers in the market are Millennium Management, Citadel LLC, Elliott Management Corporation, Brevan Howard, and BlackRock. With the growth in demand for hedge fund solutions, various companies have established partnership strategies to increase their solutions offerings in AI solutions. For instance, in November 2023, Millennium Management partnered with Schonfeld to manage money for Millennium, giving Englander’s fund access to its more than 100 investment teams. Further, such strategies drive the market growth.
In addition, with the surge in demand for usage-based insurance, several companies have acquisition to continue with the rising demand in the market. For instance, in November 2022, BlackRock Alternatives (BlackRock), through a fund managed by its diversified infrastructure business, agreed to acquire Jupiter Power LLC (Jupiter). Jupiter Power is a leading U.S. operator and developer of stand-alone, utility-scale battery energy storage systems.
For instance, in August 2022, Two Sigma acquired Hivemind Software. which combined automation and distributed human intelligence to distill semi- and unstructured data sources into high-quality, machine-readable data sets.
The global hedge fund market was valued at $4.8 trillion in 2022 and is projected to reach $13 trillion by 2032, growing at a CAGR of 10.7% from 2023 to 2032.
The hedge fund market comprises investment funds that pool capital from various investors to employ diverse investment strategies, aiming to generate returns while mitigating risk.
Key players that operate in the global hedge fund market are Bridgewater Associates, Renaissance Technologies, Man Group, AQR Capital Management, Two Sigma Investments, Millennium Management, Citadel LLC, Elliott Management Corporation, Brevan Howard, and BlackRock
North America generated the highest revenue in the hedge fund market in 2022, indicating its leading position in the industry.
Factors such as increasing investments in digital assets, technological advancements, and an evolving regulatory landscape are boosting the growth of the hedge fund market.
Challenges include high fees charged by hedge funds, regulatory scrutiny, and compliance costs, which may hinder market growth.
Loading Table Of Content...
Loading Research Methodology...

