0
New
New
2023
Helicobacter Pylori Diagnostics Market

Helicobacter Pylori Diagnostics Market

by Test Type (Non-Invasive Test, Invasive Test), by Method (Laboratory Based Test, Point of Care Test), by End User (Hospitals, Diagnostics Laboratories, Others): Global Opportunity Analysis and Industry Forecast, 2023-2032

Report Code: A03203
May 2023 | Pages: 261
Tables: 128
Charts: 68
  • Formats*:

  • pdf

    Single User License, Five User
    License & Enterprise User License

  • xls

    Data Pack Excel License

  • ppt

    It comes with the additional cost
    of $2500.00 contact sales.


Helicobacter Pylori Diagnostics Market Research, 2032

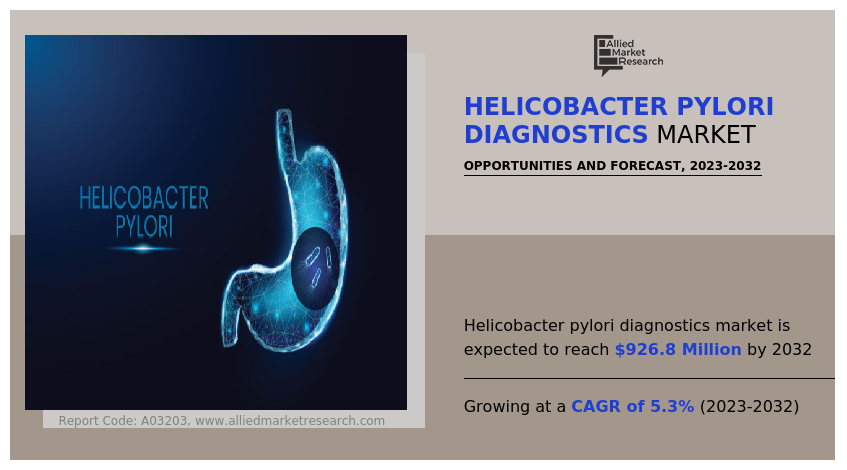
The global helicobacter pylori diagnostics market size was valued at $552.7 million in 2022 and is projected to reach $926.8 million by 2032, growing at a CAGR of 5.3% from 2023 to 2032. Helicobacter pylori (H. pylori) is a bacterium that infects the stomach and is associated with various gastrointestinal disorders, such as peptic ulcer disease and gastritis.

There are several methods for diagnosing H. pylori infection such as breath test, stool antigen test, and rapid urease test. H. pylori (Helicobacter pylori) is a type of bacteria that can infect the stomach and the small intestine. It is a common bacterial infection, with an estimated two-thirds of the world's population being infected. H. pylori causes various gastrointestinal problems, including gastritis (inflammation of the stomach lining), peptic ulcers (sores in the stomach or duodenum), and even stomach cancer in rare cases. Common symptoms of H. pylori infection include abdominal pain, nausea, vomiting, loss of appetite, and weight loss.

The helicobacter pylori diagnostics market was negatively impacted during the lockdown period owing to decrease in demand for H. pylori testing devices. In addition, decrease in patient visits to healthcare facilities due to fear of infection led to reduce the number of patients undergoing H. pylori testing, which negatively impacted the market growth.

Helicobacter Pylori Diagnostics Market

Market Dynamics

H. pylori infection is a major risk factor for gastric cancer. Increase in the incidence of gastric cancer there is a growing demand for early detection and treatment of H. pylori infections that propels helicobacter pylori diagnostics market growth. For instance, American Cancer Society’s estimated for stomach cancer (also known as gastric cancer) in the U.S. 2023. Thus, the rise in cases of gastric cancer drives the demand for H. pylori diagnostic testing and further propels market growth.

In addition, growing demand for non-invasive tests boosts market growth. Patients prefer non-invasive diagnostic tests such as breath tests and stool antigen tests over invasive tests such as endoscopy. Thus, demand for non-invasive tests has driven the development of new diagnostic technologies which further fuel the growth during helicobacter pylori diagnostics market forecast.

The growth of the helicobacter pylori diagnostics market is expected to be driven by high potential in untapped, emerging markets, due to availability of improved healthcare infrastructure, increase in unmet healthcare needs, and rise in prevalence of infectious diseases. 

Furthermore, the healthcare industry in emerging economies is developing at a significant rate, owing to rise in demand for enhanced healthcare services, significant investments by government to improve healthcare infrastructure, and development of the medical tourism industry in emerging countries. 

Moreover, early diagnosis and treatment of H. pylori infections can help to prevent the development of more serious complications, such as gastric cancer that supports market growth. As a result, there is an increase in demand for H. pylori testing to facilitate early detection and treatment. H. pylori infections are associated with several gastrointestinal diseases, including peptic ulcer disease and gastric cancer. Thus, a rise in awareness of these diseases led to an increase in the demand for H. pylori testing and further boost the grwoth of the helicobacter pylori diagnostics market size.

The demand for helicobacter pylori diagnostics is not only limited to developed countries but is also being witnessed in the developing countries, such as China, Brazil, and India, which fuel the growth of the market. Factors such as rise in adoption of point of care testing, and increase in awareness toward early diagnosis, further drive the growth of the market.  

Lack of awareness about the H. pylori infection among the general population is a restraining factor for the growth of the H. pylori diagnostics market. Many people are not aware of the symptoms and complications associated with H. pylori infection, which leads to delayed diagnosis and treatment. Regulatory issues related to the approval of new diagnostic tests for H. pylori may also act as a restraining factor for market growth. The regulatory approval process is time-consuming and expensive, which may limit the availability of new and innovative H. pylori diagnostics tests in the market.

The outbreak of COVID-19 has disrupted workflows in the health care sector around the world. The disease has forced a number of industries to shut their doors temporarily, including several sub-domains of health care. The global helicobacter pylori diagnostics industry experienced a decline in 2021 due to global economic recession led by COVID-19. The COVID-19 pandemic has led to the postponement or cancellation of non-urgent diagnostic procedures, including H. pylori testing. This has resulted in a decline in the demand for H. pylori testing, which has affected the revenue of companies operating in this market. In addition, pandemic also led to a decrease in patient visits to healthcare facilities due to fear of infection and the implementation of social distancing measures. This reduced the number of patients undergoing H. pylori testing, which impacted the market negatively.

However, the market is recovering after 2022, and show stable growth for the Helicobacter pylori diagnostics market in the coming future. This is attributed to the development of innovative and cost-effective diagnostic technologies and the availability of effective treatment options for H. pylori infection are expected to drive the growth of the H. pylori diagnostics market in the coming years.

Segmental Overview

The helicobacter pylori diagnostics market is segmented into test type, method, end user, and region. By test type, the market is categorized into non-invasive test and invasive test. The non-invasive test segment is further divided into the serology test, stool antigen test, and carbon urea breath test. On the basis of method, the market is segregated into laboratory-based test and point of care test. By end user, the market is classified into hospitals, diagnostic laboratories, and others. Region wise, the market is analyzed across North America, Europe, Asia-Pacific, and LAMEA.

By Test Type:

The non-invasive tests segment dominated the global helicobacter pylori diagnostics market share in 2022 and is expected to remain dominant throughout the forecast period, owing to several advantages over invasive tests, the development of advanced non-invasive testing technologies, and the increase in cases of gastric ulcers associated with H. pylori gastritis.

Helicobacter Pylori Diagnostics Market

By Method: 

The laboratory-based tests segment dominated the global market in 2022 owing to high adoption of laboratory-based tests such as immunoassay due to their accuracy, easy to use, and easy availability. However, the point of care (POC) test segment is expected to register the highest CAGR during the forecast period owing to its easy accessibility, high portability, and increasing adoption by healthcare providers.

Helicobacter Pylori Diagnostics Market

By End User: 

The diagnostic laboratories segment held the largest market share in 2022 and is expected to remain dominant throughout the forecast period, owing to the availability of advanced laboratory facilities, the expertise of laboratory professionals, regulatory compliance, range of testing services, and easy accessibility. In addition, diagnostic laboratories offer a wide range of testing services, including non-invasive and invasive tests, which allows healthcare providers to choose the most appropriate test for each individual patient that supports the market growth.

Helicobacter Pylori Diagnostics Market

 
By Region: 

The Helicobacter pylori diagnostics market is analyzed across North America, Europe, Asia-Pacific, and LAMEA. North America accounted for a major helicobacter pylori diagnostics market share in 2022 and is expected to maintain its dominance during the forecast period.

Increase in the incidence of gastric diseases such as H. pylori infection is a risk factor for gastric diseases that fuels the demand for H. pylori diagnostic tests. In addition, early detection of H pylori infection is crucial for effective management and prevention of associated complications which drives the demand for H pylori diagnostics tests and propels the market growth in this region. In addition, rise in awareness among patients and healthcare providers about the diagnosis of H. pylori infection leading to an increase in demand for H. pylori tests and further support the market growth.

Furthermore, North America has the highest healthcare spending which enables better access to diagnosis tests for H pylori testing is expected to contribute towards the market growth. Furthermore, the presence of well-established healthcare infrastructure, high purchasing power, and rise in adoption rate of helicobacter pylori diagnostics tests are expected to drive the market growth. Moreover, product approvals, acquisitions, and agreement adopted by the key players in this region boost the growth of the market.

Asia-Pacific is expected to grow at the highest rate during the forecast period. The market growth in this region is attributable to high incidences of gastric ulcer fuels the demand for H pylori diagnostic tests as well as growth in the purchasing power of populated countries, such as China and India. In addition, significant advancements in diagnostic technologies for H. pylori infection such as urea breath test drive the market growth. These technologies offer convenient and reliable alternatives to invasive methods which increase their adoption and drive the growth of the helicobacter pylori diagnostics industry. 

Helicobacter Pylori Diagnostics Market

Competition Analysis

Competitive analysis and profiles of the major players in the helicobacter pylori diagnostics, such as Abbott Laboratories, Avanos Medical, Inc., Biohit Oyj, Bio-Rad Laboratories, Inc., Cardinal Health Inc., F. Hoffmann-La Roche Ltd., Gulf Coast Scientific, Meridian Bioscience, Inc., Quidel Corporation, and Thermo Fisher Scientific Inc. are provided in this report. Major players have adopted product approval, agreement and acquisition as key developmental strategies to improve the product portfolio of the helicobacter pylori diagnostics market.  

Recent Product Approval in the Helicobacter Pylori Diagnostics Market

  • In March 2020, Meridian Bioscience, Inc. announced that it received FDA-clearance for Meridian’s new Curian and Curian HpSA assay. 
  • In August 2021, the latest innovation in the unique Biohit GastroPanel product family, GastroPanel quick test, received the CE marked approval.

Acquisition in the Helicobacter Pylori Diagnostics Market

  • In January 2023, Meridian Bioscience, Inc. and SD Biosensor, Inc. and SJL Partners LLC announced that they have completed the transaction to acquire Meridian.

Agreement in the Helicobacter Pylori Diagnostics Market

  • In July 2021, Meridian Bioscience, Inc., a leading global provider of diagnostic testing solutions and life science raw materials, announced that it signed a definitive agreement to acquire the North American BreathTek business from Otsuka America Pharmaceutical, Inc.

Key Benefits For Stakeholders

  • This report provides a quantitative analysis of the market segments, current trends, estimations, and dynamics of the helicobacter pylori diagnostics market analysis from 2022 to 2032 to identify the prevailing helicobacter pylori diagnostics market opportunity.
  • The market research is offered along with information related to key drivers, restraints, and opportunities.
  • Porter's five forces analysis highlights the potency of buyers and suppliers to enable stakeholders make profit-oriented business decisions and strengthen their supplier-buyer network.
  • In-depth analysis of the helicobacter pylori diagnostics market segmentation assists to determine the prevailing market opportunities.
  • Major countries in each region are mapped according to their revenue contribution to the global market.
  • Market player positioning facilitates benchmarking and provides a clear understanding of the present position of the market players.
  • The report includes the analysis of the regional as well as global helicobacter pylori diagnostics market trends, key players, market segments, application areas, and market growth strategies.

Helicobacter Pylori Diagnostics Market Report Highlights

Aspects Details
Market Size By 2032 USD 926.8 million
Growth Rate CAGR of 5.3%
Forecast period 2022 - 2032
Report Pages 261
By Test Type
  • Non-Invasive Test
    • Type
      • Serology Test
      • Stool Antigen Test
      • Carbon Urea Breath Test
  • Invasive Test
By Method
  • Laboratory Based Test
  • Point of Care Test
By End User
  • Diagnostics Laboratories
  • Others
  • Hospitals
By Region
  • North America  (U.S., Canada, Mexico)
  • Europe  (Germany, France, UK, Italy, Spain, Rest of Europe)
  • Asia-Pacific  (Japan, China, India, Australia, South Korea, Rest of Asia-Pacific)
  • LAMEA  (Brazil, Saudi Arabia, South Africa, Rest of LAMEA)
Key Market Players Avanos Medical, Inc., Cardinal Health Inc., Quidel Corporation, Bio-Rad Laboratories, Inc. , Thermo Fisher Scientific Inc. , Meridian Bioscience, Inc., Gulf Coast Scientific, Abbott Laboratories, F. Hoffmann-La Roche Ltd., Biohit Oyj
 
  • CHAPTER 1: INTRODUCTION

    • 1.1. Report description

    • 1.2. Key market segments

    • 1.3. Key benefits to the stakeholders

    • 1.4. Research Methodology

      • 1.4.1. Primary research

      • 1.4.2. Secondary research

      • 1.4.3. Analyst tools and models

  • CHAPTER 2: EXECUTIVE SUMMARY

    • 2.1. CXO Perspective

  • CHAPTER 3: MARKET OVERVIEW

    • 3.1. Market definition and scope

    • 3.2. Key findings

      • 3.2.1. Top impacting factors

      • 3.2.2. Top investment pockets

    • 3.3. Porter’s five forces analysis

      • 3.3.1. Bargaining power of suppliers

      • 3.3.2. Bargaining power of buyers

      • 3.3.3. Threat of substitutes

      • 3.3.4. Threat of new entrants

      • 3.3.5. Intensity of rivalry

    • 3.4. Market dynamics

      • 3.4.1. Drivers

        • 3.4.1.1. Rise in prevalence of infectious diseases
        • 3.4.1.2. Increase in demand for non-invasive diagnostic procedures
        • 3.4.1.3. Development of new and improved testing methods

      • 3.4.2. Restraints

        • 3.4.2.1. Lack of awareness and shortage of skilled professionals

      • 3.4.3. Opportunities

        • 3.4.3.1. Rise in demand for point of care H. pylori testing

    • 3.5. COVID-19 Impact Analysis on the market

  • CHAPTER 4: HELICOBACTER PYLORI DIAGNOSTICS MARKET, BY TEST TYPE

    • 4.1. Overview

      • 4.1.1. Market size and forecast

    • 4.2. Non-Invasive Test

      • 4.2.1. Key market trends, growth factors and opportunities

      • 4.2.2. Market size and forecast, by region

      • 4.2.3. Market share analysis by country

      • 4.2.4. Non-Invasive Test Helicobacter Pylori Diagnostics Market by Type

    • 4.3. Invasive Test

      • 4.3.1. Key market trends, growth factors and opportunities

      • 4.3.2. Market size and forecast, by region

      • 4.3.3. Market share analysis by country

  • CHAPTER 5: HELICOBACTER PYLORI DIAGNOSTICS MARKET, BY METHOD

    • 5.1. Overview

      • 5.1.1. Market size and forecast

    • 5.2. Laboratory Based Test

      • 5.2.1. Key market trends, growth factors and opportunities

      • 5.2.2. Market size and forecast, by region

      • 5.2.3. Market share analysis by country

    • 5.3. Point of Care Test

      • 5.3.1. Key market trends, growth factors and opportunities

      • 5.3.2. Market size and forecast, by region

      • 5.3.3. Market share analysis by country

  • CHAPTER 6: HELICOBACTER PYLORI DIAGNOSTICS MARKET, BY END USER

    • 6.1. Overview

      • 6.1.1. Market size and forecast

    • 6.2. Hospitals

      • 6.2.1. Key market trends, growth factors and opportunities

      • 6.2.2. Market size and forecast, by region

      • 6.2.3. Market share analysis by country

    • 6.3. Diagnostics Laboratories

      • 6.3.1. Key market trends, growth factors and opportunities

      • 6.3.2. Market size and forecast, by region

      • 6.3.3. Market share analysis by country

    • 6.4. Others

      • 6.4.1. Key market trends, growth factors and opportunities

      • 6.4.2. Market size and forecast, by region

      • 6.4.3. Market share analysis by country

  • CHAPTER 7: HELICOBACTER PYLORI DIAGNOSTICS MARKET, BY REGION

    • 7.1. Overview

      • 7.1.1. Market size and forecast By Region

    • 7.2. North America

      • 7.2.1. Key trends and opportunities

      • 7.2.2. Market size and forecast, by Test Type

      • 7.2.3. Market size and forecast, by Method

      • 7.2.4. Market size and forecast, by End User

      • 7.2.5. Market size and forecast, by country

        • 7.2.5.1. U.S.
          • 7.2.5.1.1. Key market trends, growth factors and opportunities
          • 7.2.5.1.2. Market size and forecast, by Test Type
          • 7.2.5.1.3. Market size and forecast, by Method
          • 7.2.5.1.4. Market size and forecast, by End User
        • 7.2.5.2. Canada
          • 7.2.5.2.1. Key market trends, growth factors and opportunities
          • 7.2.5.2.2. Market size and forecast, by Test Type
          • 7.2.5.2.3. Market size and forecast, by Method
          • 7.2.5.2.4. Market size and forecast, by End User
        • 7.2.5.3. Mexico
          • 7.2.5.3.1. Key market trends, growth factors and opportunities
          • 7.2.5.3.2. Market size and forecast, by Test Type
          • 7.2.5.3.3. Market size and forecast, by Method
          • 7.2.5.3.4. Market size and forecast, by End User
    • 7.3. Europe

      • 7.3.1. Key trends and opportunities

      • 7.3.2. Market size and forecast, by Test Type

      • 7.3.3. Market size and forecast, by Method

      • 7.3.4. Market size and forecast, by End User

      • 7.3.5. Market size and forecast, by country

        • 7.3.5.1. Germany
          • 7.3.5.1.1. Key market trends, growth factors and opportunities
          • 7.3.5.1.2. Market size and forecast, by Test Type
          • 7.3.5.1.3. Market size and forecast, by Method
          • 7.3.5.1.4. Market size and forecast, by End User
        • 7.3.5.2. France
          • 7.3.5.2.1. Key market trends, growth factors and opportunities
          • 7.3.5.2.2. Market size and forecast, by Test Type
          • 7.3.5.2.3. Market size and forecast, by Method
          • 7.3.5.2.4. Market size and forecast, by End User
        • 7.3.5.3. UK
          • 7.3.5.3.1. Key market trends, growth factors and opportunities
          • 7.3.5.3.2. Market size and forecast, by Test Type
          • 7.3.5.3.3. Market size and forecast, by Method
          • 7.3.5.3.4. Market size and forecast, by End User
        • 7.3.5.4. Italy
          • 7.3.5.4.1. Key market trends, growth factors and opportunities
          • 7.3.5.4.2. Market size and forecast, by Test Type
          • 7.3.5.4.3. Market size and forecast, by Method
          • 7.3.5.4.4. Market size and forecast, by End User
        • 7.3.5.5. Spain
          • 7.3.5.5.1. Key market trends, growth factors and opportunities
          • 7.3.5.5.2. Market size and forecast, by Test Type
          • 7.3.5.5.3. Market size and forecast, by Method
          • 7.3.5.5.4. Market size and forecast, by End User
        • 7.3.5.6. Rest of Europe
          • 7.3.5.6.1. Key market trends, growth factors and opportunities
          • 7.3.5.6.2. Market size and forecast, by Test Type
          • 7.3.5.6.3. Market size and forecast, by Method
          • 7.3.5.6.4. Market size and forecast, by End User
    • 7.4. Asia-Pacific

      • 7.4.1. Key trends and opportunities

      • 7.4.2. Market size and forecast, by Test Type

      • 7.4.3. Market size and forecast, by Method

      • 7.4.4. Market size and forecast, by End User

      • 7.4.5. Market size and forecast, by country

        • 7.4.5.1. Japan
          • 7.4.5.1.1. Key market trends, growth factors and opportunities
          • 7.4.5.1.2. Market size and forecast, by Test Type
          • 7.4.5.1.3. Market size and forecast, by Method
          • 7.4.5.1.4. Market size and forecast, by End User
        • 7.4.5.2. China
          • 7.4.5.2.1. Key market trends, growth factors and opportunities
          • 7.4.5.2.2. Market size and forecast, by Test Type
          • 7.4.5.2.3. Market size and forecast, by Method
          • 7.4.5.2.4. Market size and forecast, by End User
        • 7.4.5.3. India
          • 7.4.5.3.1. Key market trends, growth factors and opportunities
          • 7.4.5.3.2. Market size and forecast, by Test Type
          • 7.4.5.3.3. Market size and forecast, by Method
          • 7.4.5.3.4. Market size and forecast, by End User
        • 7.4.5.4. Australia
          • 7.4.5.4.1. Key market trends, growth factors and opportunities
          • 7.4.5.4.2. Market size and forecast, by Test Type
          • 7.4.5.4.3. Market size and forecast, by Method
          • 7.4.5.4.4. Market size and forecast, by End User
        • 7.4.5.5. South Korea
          • 7.4.5.5.1. Key market trends, growth factors and opportunities
          • 7.4.5.5.2. Market size and forecast, by Test Type
          • 7.4.5.5.3. Market size and forecast, by Method
          • 7.4.5.5.4. Market size and forecast, by End User
        • 7.4.5.6. Rest of Asia-Pacific
          • 7.4.5.6.1. Key market trends, growth factors and opportunities
          • 7.4.5.6.2. Market size and forecast, by Test Type
          • 7.4.5.6.3. Market size and forecast, by Method
          • 7.4.5.6.4. Market size and forecast, by End User
    • 7.5. LAMEA

      • 7.5.1. Key trends and opportunities

      • 7.5.2. Market size and forecast, by Test Type

      • 7.5.3. Market size and forecast, by Method

      • 7.5.4. Market size and forecast, by End User

      • 7.5.5. Market size and forecast, by country

        • 7.5.5.1. Brazil
          • 7.5.5.1.1. Key market trends, growth factors and opportunities
          • 7.5.5.1.2. Market size and forecast, by Test Type
          • 7.5.5.1.3. Market size and forecast, by Method
          • 7.5.5.1.4. Market size and forecast, by End User
        • 7.5.5.2. Saudi Arabia
          • 7.5.5.2.1. Key market trends, growth factors and opportunities
          • 7.5.5.2.2. Market size and forecast, by Test Type
          • 7.5.5.2.3. Market size and forecast, by Method
          • 7.5.5.2.4. Market size and forecast, by End User
        • 7.5.5.3. South Africa
          • 7.5.5.3.1. Key market trends, growth factors and opportunities
          • 7.5.5.3.2. Market size and forecast, by Test Type
          • 7.5.5.3.3. Market size and forecast, by Method
          • 7.5.5.3.4. Market size and forecast, by End User
        • 7.5.5.4. Rest of LAMEA
          • 7.5.5.4.1. Key market trends, growth factors and opportunities
          • 7.5.5.4.2. Market size and forecast, by Test Type
          • 7.5.5.4.3. Market size and forecast, by Method
          • 7.5.5.4.4. Market size and forecast, by End User
  • CHAPTER 8: COMPETITIVE LANDSCAPE

    • 8.1. Introduction

    • 8.2. Top winning strategies

    • 8.3. Product Mapping of Top 10 Player

    • 8.4. Competitive Dashboard

    • 8.5. Competitive Heatmap

    • 8.6. Top player positioning, 2022

  • CHAPTER 9: COMPANY PROFILES

    • 9.1. Thermo Fisher Scientific Inc. 

      • 9.1.1. Company overview

      • 9.1.2. Key Executives

      • 9.1.3. Company snapshot

      • 9.1.4. Operating business segments

      • 9.1.5. Product portfolio

      • 9.1.6. Business performance

    • 9.2. Meridian Bioscience, Inc.

      • 9.2.1. Company overview

      • 9.2.2. Key Executives

      • 9.2.3. Company snapshot

      • 9.2.4. Operating business segments

      • 9.2.5. Product portfolio

      • 9.2.6. Key strategic moves and developments

    • 9.3. Bio-Rad Laboratories, Inc. 

      • 9.3.1. Company overview

      • 9.3.2. Key Executives

      • 9.3.3. Company snapshot

      • 9.3.4. Operating business segments

      • 9.3.5. Product portfolio

      • 9.3.6. Business performance

    • 9.4. Abbott Laboratories

      • 9.4.1. Company overview

      • 9.4.2. Key Executives

      • 9.4.3. Company snapshot

      • 9.4.4. Operating business segments

      • 9.4.5. Product portfolio

      • 9.4.6. Business performance

    • 9.5. F. Hoffmann-La Roche Ltd.

      • 9.5.1. Company overview

      • 9.5.2. Key Executives

      • 9.5.3. Company snapshot

      • 9.5.4. Operating business segments

      • 9.5.5. Product portfolio

      • 9.5.6. Business performance

    • 9.6. Cardinal Health Inc.

      • 9.6.1. Company overview

      • 9.6.2. Key Executives

      • 9.6.3. Company snapshot

      • 9.6.4. Operating business segments

      • 9.6.5. Product portfolio

      • 9.6.6. Business performance

    • 9.7. Avanos Medical, Inc.

      • 9.7.1. Company overview

      • 9.7.2. Key Executives

      • 9.7.3. Company snapshot

      • 9.7.4. Operating business segments

      • 9.7.5. Product portfolio

      • 9.7.6. Business performance

    • 9.8. Gulf Coast Scientific

      • 9.8.1. Company overview

      • 9.8.2. Key Executives

      • 9.8.3. Company snapshot

      • 9.8.4. Operating business segments

      • 9.8.5. Product portfolio

    • 9.9. Quidel Corporation

      • 9.9.1. Company overview

      • 9.9.2. Key Executives

      • 9.9.3. Company snapshot

      • 9.9.4. Operating business segments

      • 9.9.5. Product portfolio

      • 9.9.6. Business performance

    • 9.10. Biohit Oyj

      • 9.10.1. Company overview

      • 9.10.2. Key Executives

      • 9.10.3. Company snapshot

      • 9.10.4. Operating business segments

      • 9.10.5. Product portfolio

      • 9.10.6. Business performance

      • 9.10.7. Key strategic moves and developments

  • LIST OF TABLES

  • TABLE 01. GLOBAL HELICOBACTER PYLORI DIAGNOSTICS MARKET, BY TEST TYPE, 2022-2032 ($MILLION)
    TABLE 02. HELICOBACTER PYLORI DIAGNOSTICS MARKET FOR NON-INVASIVE TEST, BY REGION, 2022-2032 ($MILLION)
    TABLE 03. GLOBAL NON-INVASIVE TEST HELICOBACTER PYLORI DIAGNOSTICS MARKET, BY TYPE, 2022-2032 ($MILLION)
    TABLE 04. HELICOBACTER PYLORI DIAGNOSTICS MARKET FOR INVASIVE TEST, BY REGION, 2022-2032 ($MILLION)
    TABLE 05. GLOBAL HELICOBACTER PYLORI DIAGNOSTICS MARKET, BY METHOD, 2022-2032 ($MILLION)
    TABLE 06. HELICOBACTER PYLORI DIAGNOSTICS MARKET FOR LABORATORY BASED TEST, BY REGION, 2022-2032 ($MILLION)
    TABLE 07. HELICOBACTER PYLORI DIAGNOSTICS MARKET FOR POINT OF CARE TEST, BY REGION, 2022-2032 ($MILLION)
    TABLE 08. GLOBAL HELICOBACTER PYLORI DIAGNOSTICS MARKET, BY END USER, 2022-2032 ($MILLION)
    TABLE 09. HELICOBACTER PYLORI DIAGNOSTICS MARKET FOR HOSPITALS, BY REGION, 2022-2032 ($MILLION)
    TABLE 10. HELICOBACTER PYLORI DIAGNOSTICS MARKET FOR DIAGNOSTICS LABORATORIES, BY REGION, 2022-2032 ($MILLION)
    TABLE 11. HELICOBACTER PYLORI DIAGNOSTICS MARKET FOR OTHERS, BY REGION, 2022-2032 ($MILLION)
    TABLE 12. HELICOBACTER PYLORI DIAGNOSTICS MARKET, BY REGION, 2022-2032 ($MILLION)
    TABLE 13. NORTH AMERICA HELICOBACTER PYLORI DIAGNOSTICS MARKET, BY TEST TYPE, 2022-2032 ($MILLION)
    TABLE 14. NORTH AMERICA HELICOBACTER PYLORI DIAGNOSTICS MARKET, BY METHOD, 2022-2032 ($MILLION)
    TABLE 15. NORTH AMERICA HELICOBACTER PYLORI DIAGNOSTICS MARKET, BY END USER, 2022-2032 ($MILLION)
    TABLE 16. NORTH AMERICA HELICOBACTER PYLORI DIAGNOSTICS MARKET, BY COUNTRY, 2022-2032 ($MILLION)
    TABLE 17. U.S. HELICOBACTER PYLORI DIAGNOSTICS MARKET, BY TEST TYPE, 2022-2032 ($MILLION)
    TABLE 18. U.S. HELICOBACTER PYLORI DIAGNOSTICS MARKET, BY METHOD, 2022-2032 ($MILLION)
    TABLE 19. U.S. HELICOBACTER PYLORI DIAGNOSTICS MARKET, BY END USER, 2022-2032 ($MILLION)
    TABLE 20. CANADA HELICOBACTER PYLORI DIAGNOSTICS MARKET, BY TEST TYPE, 2022-2032 ($MILLION)
    TABLE 21. CANADA HELICOBACTER PYLORI DIAGNOSTICS MARKET, BY METHOD, 2022-2032 ($MILLION)
    TABLE 22. CANADA HELICOBACTER PYLORI DIAGNOSTICS MARKET, BY END USER, 2022-2032 ($MILLION)
    TABLE 23. MEXICO HELICOBACTER PYLORI DIAGNOSTICS MARKET, BY TEST TYPE, 2022-2032 ($MILLION)
    TABLE 24. MEXICO HELICOBACTER PYLORI DIAGNOSTICS MARKET, BY METHOD, 2022-2032 ($MILLION)
    TABLE 25. MEXICO HELICOBACTER PYLORI DIAGNOSTICS MARKET, BY END USER, 2022-2032 ($MILLION)
    TABLE 26. EUROPE HELICOBACTER PYLORI DIAGNOSTICS MARKET, BY TEST TYPE, 2022-2032 ($MILLION)
    TABLE 27. EUROPE HELICOBACTER PYLORI DIAGNOSTICS MARKET, BY METHOD, 2022-2032 ($MILLION)
    TABLE 28. EUROPE HELICOBACTER PYLORI DIAGNOSTICS MARKET, BY END USER, 2022-2032 ($MILLION)
    TABLE 29. EUROPE HELICOBACTER PYLORI DIAGNOSTICS MARKET, BY COUNTRY, 2022-2032 ($MILLION)
    TABLE 30. GERMANY HELICOBACTER PYLORI DIAGNOSTICS MARKET, BY TEST TYPE, 2022-2032 ($MILLION)
    TABLE 31. GERMANY HELICOBACTER PYLORI DIAGNOSTICS MARKET, BY METHOD, 2022-2032 ($MILLION)
    TABLE 32. GERMANY HELICOBACTER PYLORI DIAGNOSTICS MARKET, BY END USER, 2022-2032 ($MILLION)
    TABLE 33. FRANCE HELICOBACTER PYLORI DIAGNOSTICS MARKET, BY TEST TYPE, 2022-2032 ($MILLION)
    TABLE 34. FRANCE HELICOBACTER PYLORI DIAGNOSTICS MARKET, BY METHOD, 2022-2032 ($MILLION)
    TABLE 35. FRANCE HELICOBACTER PYLORI DIAGNOSTICS MARKET, BY END USER, 2022-2032 ($MILLION)
    TABLE 36. UK HELICOBACTER PYLORI DIAGNOSTICS MARKET, BY TEST TYPE, 2022-2032 ($MILLION)
    TABLE 37. UK HELICOBACTER PYLORI DIAGNOSTICS MARKET, BY METHOD, 2022-2032 ($MILLION)
    TABLE 38. UK HELICOBACTER PYLORI DIAGNOSTICS MARKET, BY END USER, 2022-2032 ($MILLION)
    TABLE 39. ITALY HELICOBACTER PYLORI DIAGNOSTICS MARKET, BY TEST TYPE, 2022-2032 ($MILLION)
    TABLE 40. ITALY HELICOBACTER PYLORI DIAGNOSTICS MARKET, BY METHOD, 2022-2032 ($MILLION)
    TABLE 41. ITALY HELICOBACTER PYLORI DIAGNOSTICS MARKET, BY END USER, 2022-2032 ($MILLION)
    TABLE 42. SPAIN HELICOBACTER PYLORI DIAGNOSTICS MARKET, BY TEST TYPE, 2022-2032 ($MILLION)
    TABLE 43. SPAIN HELICOBACTER PYLORI DIAGNOSTICS MARKET, BY METHOD, 2022-2032 ($MILLION)
    TABLE 44. SPAIN HELICOBACTER PYLORI DIAGNOSTICS MARKET, BY END USER, 2022-2032 ($MILLION)
    TABLE 45. REST OF EUROPE HELICOBACTER PYLORI DIAGNOSTICS MARKET, BY TEST TYPE, 2022-2032 ($MILLION)
    TABLE 46. REST OF EUROPE HELICOBACTER PYLORI DIAGNOSTICS MARKET, BY METHOD, 2022-2032 ($MILLION)
    TABLE 47. REST OF EUROPE HELICOBACTER PYLORI DIAGNOSTICS MARKET, BY END USER, 2022-2032 ($MILLION)
    TABLE 48. ASIA-PACIFIC HELICOBACTER PYLORI DIAGNOSTICS MARKET, BY TEST TYPE, 2022-2032 ($MILLION)
    TABLE 49. ASIA-PACIFIC HELICOBACTER PYLORI DIAGNOSTICS MARKET, BY METHOD, 2022-2032 ($MILLION)
    TABLE 50. ASIA-PACIFIC HELICOBACTER PYLORI DIAGNOSTICS MARKET, BY END USER, 2022-2032 ($MILLION)
    TABLE 51. ASIA-PACIFIC HELICOBACTER PYLORI DIAGNOSTICS MARKET, BY COUNTRY, 2022-2032 ($MILLION)
    TABLE 52. JAPAN HELICOBACTER PYLORI DIAGNOSTICS MARKET, BY TEST TYPE, 2022-2032 ($MILLION)
    TABLE 53. JAPAN HELICOBACTER PYLORI DIAGNOSTICS MARKET, BY METHOD, 2022-2032 ($MILLION)
    TABLE 54. JAPAN HELICOBACTER PYLORI DIAGNOSTICS MARKET, BY END USER, 2022-2032 ($MILLION)
    TABLE 55. CHINA HELICOBACTER PYLORI DIAGNOSTICS MARKET, BY TEST TYPE, 2022-2032 ($MILLION)
    TABLE 56. CHINA HELICOBACTER PYLORI DIAGNOSTICS MARKET, BY METHOD, 2022-2032 ($MILLION)
    TABLE 57. CHINA HELICOBACTER PYLORI DIAGNOSTICS MARKET, BY END USER, 2022-2032 ($MILLION)
    TABLE 58. INDIA HELICOBACTER PYLORI DIAGNOSTICS MARKET, BY TEST TYPE, 2022-2032 ($MILLION)
    TABLE 59. INDIA HELICOBACTER PYLORI DIAGNOSTICS MARKET, BY METHOD, 2022-2032 ($MILLION)
    TABLE 60. INDIA HELICOBACTER PYLORI DIAGNOSTICS MARKET, BY END USER, 2022-2032 ($MILLION)
    TABLE 61. AUSTRALIA HELICOBACTER PYLORI DIAGNOSTICS MARKET, BY TEST TYPE, 2022-2032 ($MILLION)
    TABLE 62. AUSTRALIA HELICOBACTER PYLORI DIAGNOSTICS MARKET, BY METHOD, 2022-2032 ($MILLION)
    TABLE 63. AUSTRALIA HELICOBACTER PYLORI DIAGNOSTICS MARKET, BY END USER, 2022-2032 ($MILLION)
    TABLE 64. SOUTH KOREA HELICOBACTER PYLORI DIAGNOSTICS MARKET, BY TEST TYPE, 2022-2032 ($MILLION)
    TABLE 65. SOUTH KOREA HELICOBACTER PYLORI DIAGNOSTICS MARKET, BY METHOD, 2022-2032 ($MILLION)
    TABLE 66. SOUTH KOREA HELICOBACTER PYLORI DIAGNOSTICS MARKET, BY END USER, 2022-2032 ($MILLION)
    TABLE 67. REST OF ASIA-PACIFIC HELICOBACTER PYLORI DIAGNOSTICS MARKET, BY TEST TYPE, 2022-2032 ($MILLION)
    TABLE 68. REST OF ASIA-PACIFIC HELICOBACTER PYLORI DIAGNOSTICS MARKET, BY METHOD, 2022-2032 ($MILLION)
    TABLE 69. REST OF ASIA-PACIFIC HELICOBACTER PYLORI DIAGNOSTICS MARKET, BY END USER, 2022-2032 ($MILLION)
    TABLE 70. LAMEA HELICOBACTER PYLORI DIAGNOSTICS MARKET, BY TEST TYPE, 2022-2032 ($MILLION)
    TABLE 71. LAMEA HELICOBACTER PYLORI DIAGNOSTICS MARKET, BY METHOD, 2022-2032 ($MILLION)
    TABLE 72. LAMEA HELICOBACTER PYLORI DIAGNOSTICS MARKET, BY END USER, 2022-2032 ($MILLION)
    TABLE 73. LAMEA HELICOBACTER PYLORI DIAGNOSTICS MARKET, BY COUNTRY, 2022-2032 ($MILLION)
    TABLE 74. BRAZIL HELICOBACTER PYLORI DIAGNOSTICS MARKET, BY TEST TYPE, 2022-2032 ($MILLION)
    TABLE 75. BRAZIL HELICOBACTER PYLORI DIAGNOSTICS MARKET, BY METHOD, 2022-2032 ($MILLION)
    TABLE 76. BRAZIL HELICOBACTER PYLORI DIAGNOSTICS MARKET, BY END USER, 2022-2032 ($MILLION)
    TABLE 77. SAUDI ARABIA HELICOBACTER PYLORI DIAGNOSTICS MARKET, BY TEST TYPE, 2022-2032 ($MILLION)
    TABLE 78. SAUDI ARABIA HELICOBACTER PYLORI DIAGNOSTICS MARKET, BY METHOD, 2022-2032 ($MILLION)
    TABLE 79. SAUDI ARABIA HELICOBACTER PYLORI DIAGNOSTICS MARKET, BY END USER, 2022-2032 ($MILLION)
    TABLE 80. SOUTH AFRICA HELICOBACTER PYLORI DIAGNOSTICS MARKET, BY TEST TYPE, 2022-2032 ($MILLION)
    TABLE 81. SOUTH AFRICA HELICOBACTER PYLORI DIAGNOSTICS MARKET, BY METHOD, 2022-2032 ($MILLION)
    TABLE 82. SOUTH AFRICA HELICOBACTER PYLORI DIAGNOSTICS MARKET, BY END USER, 2022-2032 ($MILLION)
    TABLE 83. REST OF LAMEA HELICOBACTER PYLORI DIAGNOSTICS MARKET, BY TEST TYPE, 2022-2032 ($MILLION)
    TABLE 84. REST OF LAMEA HELICOBACTER PYLORI DIAGNOSTICS MARKET, BY METHOD, 2022-2032 ($MILLION)
    TABLE 85. REST OF LAMEA HELICOBACTER PYLORI DIAGNOSTICS MARKET, BY END USER, 2022-2032 ($MILLION)
    TABLE 86. THERMO FISHER SCIENTIFIC INC. : KEY EXECUTIVES
    TABLE 87. THERMO FISHER SCIENTIFIC INC. : COMPANY SNAPSHOT
    TABLE 88. THERMO FISHER SCIENTIFIC INC. : PRODUCT SEGMENTS
    TABLE 89. THERMO FISHER SCIENTIFIC INC. : SERVICE SEGMENTS
    TABLE 90. THERMO FISHER SCIENTIFIC INC. : PRODUCT PORTFOLIO
    TABLE 91. MERIDIAN BIOSCIENCE, INC.: KEY EXECUTIVES
    TABLE 92. MERIDIAN BIOSCIENCE, INC.: COMPANY SNAPSHOT
    TABLE 93. MERIDIAN BIOSCIENCE, INC.: PRODUCT SEGMENTS
    TABLE 94. MERIDIAN BIOSCIENCE, INC.: PRODUCT PORTFOLIO
    TABLE 95. MERIDIAN BIOSCIENCE, INC.: KEY STRATERGIES
    TABLE 96. BIO-RAD LABORATORIES, INC. : KEY EXECUTIVES
    TABLE 97. BIO-RAD LABORATORIES, INC. : COMPANY SNAPSHOT
    TABLE 98. BIO-RAD LABORATORIES, INC. : PRODUCT SEGMENTS
    TABLE 99. BIO-RAD LABORATORIES, INC. : PRODUCT PORTFOLIO
    TABLE 100. ABBOTT LABORATORIES: KEY EXECUTIVES
    TABLE 101. ABBOTT LABORATORIES: COMPANY SNAPSHOT
    TABLE 102. ABBOTT LABORATORIES: PRODUCT SEGMENTS
    TABLE 103. ABBOTT LABORATORIES: PRODUCT PORTFOLIO
    TABLE 104. F. HOFFMANN-LA ROCHE LTD.: KEY EXECUTIVES
    TABLE 105. F. HOFFMANN-LA ROCHE LTD.: COMPANY SNAPSHOT
    TABLE 106. F. HOFFMANN-LA ROCHE LTD.: PRODUCT SEGMENTS
    TABLE 107. F. HOFFMANN-LA ROCHE LTD.: PRODUCT PORTFOLIO
    TABLE 108. CARDINAL HEALTH INC.: KEY EXECUTIVES
    TABLE 109. CARDINAL HEALTH INC.: COMPANY SNAPSHOT
    TABLE 110. CARDINAL HEALTH INC.: PRODUCT SEGMENTS
    TABLE 111. CARDINAL HEALTH INC.: PRODUCT PORTFOLIO
    TABLE 112. AVANOS MEDICAL, INC.: KEY EXECUTIVES
    TABLE 113. AVANOS MEDICAL, INC.: COMPANY SNAPSHOT
    TABLE 114. AVANOS MEDICAL, INC.: PRODUCT SEGMENTS
    TABLE 115. AVANOS MEDICAL, INC.: PRODUCT PORTFOLIO
    TABLE 116. GULF COAST SCIENTIFIC: KEY EXECUTIVES
    TABLE 117. GULF COAST SCIENTIFIC: COMPANY SNAPSHOT
    TABLE 118. GULF COAST SCIENTIFIC: PRODUCT SEGMENTS
    TABLE 119. GULF COAST SCIENTIFIC: PRODUCT PORTFOLIO
    TABLE 120. QUIDEL CORPORATION: KEY EXECUTIVES
    TABLE 121. QUIDEL CORPORATION: COMPANY SNAPSHOT
    TABLE 122. QUIDEL CORPORATION: PRODUCT SEGMENTS
    TABLE 123. QUIDEL CORPORATION: PRODUCT PORTFOLIO
    TABLE 124. BIOHIT OYJ: KEY EXECUTIVES
    TABLE 125. BIOHIT OYJ: COMPANY SNAPSHOT
    TABLE 126. BIOHIT OYJ: PRODUCT SEGMENTS
    TABLE 127. BIOHIT OYJ: PRODUCT PORTFOLIO
    TABLE 128. BIOHIT OYJ: KEY STRATERGIES
  • LIST OF FIGURES

  • FIGURE 01. HELICOBACTER PYLORI DIAGNOSTICS MARKET, 2022-2032
    FIGURE 02. SEGMENTATION OF HELICOBACTER PYLORI DIAGNOSTICS MARKET, 2022-2032
    FIGURE 03. TOP INVESTMENT POCKETS IN HELICOBACTER PYLORI DIAGNOSTICS MARKET (2023-2032)
    FIGURE 04. MODERATE BARGAINING POWER OF SUPPLIERS
    FIGURE 05. MODERATE BARGAINING POWER OF BUYERS
    FIGURE 06. MODERATE THREAT OF SUBSTITUTES
    FIGURE 07. MODERATE THREAT OF NEW ENTRANTS
    FIGURE 08. MODERATE INTENSITY OF RIVALRY
    FIGURE 09. DRIVERS, RESTRAINTS AND OPPORTUNITIES: GLOBALHELICOBACTER PYLORI DIAGNOSTICS MARKET
    FIGURE 10. HELICOBACTER PYLORI DIAGNOSTICS MARKET, BY TEST TYPE, 2022(%)
    FIGURE 11. COMPARATIVE SHARE ANALYSIS OF HELICOBACTER PYLORI DIAGNOSTICS MARKET FOR NON-INVASIVE TEST, BY COUNTRY 2022 AND 2032(%)
    FIGURE 12. COMPARATIVE SHARE ANALYSIS OF HELICOBACTER PYLORI DIAGNOSTICS MARKET FOR INVASIVE TEST, BY COUNTRY 2022 AND 2032(%)
    FIGURE 13. HELICOBACTER PYLORI DIAGNOSTICS MARKET, BY METHOD, 2022(%)
    FIGURE 14. COMPARATIVE SHARE ANALYSIS OF HELICOBACTER PYLORI DIAGNOSTICS MARKET FOR LABORATORY BASED TEST, BY COUNTRY 2022 AND 2032(%)
    FIGURE 15. COMPARATIVE SHARE ANALYSIS OF HELICOBACTER PYLORI DIAGNOSTICS MARKET FOR POINT OF CARE TEST, BY COUNTRY 2022 AND 2032(%)
    FIGURE 16. HELICOBACTER PYLORI DIAGNOSTICS MARKET, BY END USER, 2022(%)
    FIGURE 17. COMPARATIVE SHARE ANALYSIS OF HELICOBACTER PYLORI DIAGNOSTICS MARKET FOR HOSPITALS, BY COUNTRY 2022 AND 2032(%)
    FIGURE 18. COMPARATIVE SHARE ANALYSIS OF HELICOBACTER PYLORI DIAGNOSTICS MARKET FOR DIAGNOSTICS LABORATORIES, BY COUNTRY 2022 AND 2032(%)
    FIGURE 19. COMPARATIVE SHARE ANALYSIS OF HELICOBACTER PYLORI DIAGNOSTICS MARKET FOR OTHERS, BY COUNTRY 2022 AND 2032(%)
    FIGURE 20. HELICOBACTER PYLORI DIAGNOSTICS MARKET BY REGION, 2022
    FIGURE 21. U.S. HELICOBACTER PYLORI DIAGNOSTICS MARKET, 2022-2032 ($MILLION)
    FIGURE 22. CANADA HELICOBACTER PYLORI DIAGNOSTICS MARKET, 2022-2032 ($MILLION)
    FIGURE 23. MEXICO HELICOBACTER PYLORI DIAGNOSTICS MARKET, 2022-2032 ($MILLION)
    FIGURE 24. GERMANY HELICOBACTER PYLORI DIAGNOSTICS MARKET, 2022-2032 ($MILLION)
    FIGURE 25. FRANCE HELICOBACTER PYLORI DIAGNOSTICS MARKET, 2022-2032 ($MILLION)
    FIGURE 26. UK HELICOBACTER PYLORI DIAGNOSTICS MARKET, 2022-2032 ($MILLION)
    FIGURE 27. ITALY HELICOBACTER PYLORI DIAGNOSTICS MARKET, 2022-2032 ($MILLION)
    FIGURE 28. SPAIN HELICOBACTER PYLORI DIAGNOSTICS MARKET, 2022-2032 ($MILLION)
    FIGURE 29. REST OF EUROPE HELICOBACTER PYLORI DIAGNOSTICS MARKET, 2022-2032 ($MILLION)
    FIGURE 30. JAPAN HELICOBACTER PYLORI DIAGNOSTICS MARKET, 2022-2032 ($MILLION)
    FIGURE 31. CHINA HELICOBACTER PYLORI DIAGNOSTICS MARKET, 2022-2032 ($MILLION)
    FIGURE 32. INDIA HELICOBACTER PYLORI DIAGNOSTICS MARKET, 2022-2032 ($MILLION)
    FIGURE 33. AUSTRALIA HELICOBACTER PYLORI DIAGNOSTICS MARKET, 2022-2032 ($MILLION)
    FIGURE 34. SOUTH KOREA HELICOBACTER PYLORI DIAGNOSTICS MARKET, 2022-2032 ($MILLION)
    FIGURE 35. REST OF ASIA-PACIFIC HELICOBACTER PYLORI DIAGNOSTICS MARKET, 2022-2032 ($MILLION)
    FIGURE 36. BRAZIL HELICOBACTER PYLORI DIAGNOSTICS MARKET, 2022-2032 ($MILLION)
    FIGURE 37. SAUDI ARABIA HELICOBACTER PYLORI DIAGNOSTICS MARKET, 2022-2032 ($MILLION)
    FIGURE 38. SOUTH AFRICA HELICOBACTER PYLORI DIAGNOSTICS MARKET, 2022-2032 ($MILLION)
    FIGURE 39. REST OF LAMEA HELICOBACTER PYLORI DIAGNOSTICS MARKET, 2022-2032 ($MILLION)
    FIGURE 40. TOP WINNING STRATEGIES, BY YEAR
    FIGURE 41. TOP WINNING STRATEGIES, BY DEVELOPMENT
    FIGURE 42. TOP WINNING STRATEGIES, BY COMPANY
    FIGURE 43. PRODUCT MAPPING OF TOP 10 PLAYERS
    FIGURE 44. COMPETITIVE DASHBOARD
    FIGURE 45. COMPETITIVE HEATMAP: HELICOBACTER PYLORI DIAGNOSTICS MARKET
    FIGURE 46. TOP PLAYER POSITIONING, 2022
    FIGURE 47. THERMO FISHER SCIENTIFIC INC. : NET REVENUE, 2020-2022 ($MILLION)
    FIGURE 48. THERMO FISHER SCIENTIFIC INC. : REVENUE SHARE BY SEGMENT, 2022 (%)
    FIGURE 49. THERMO FISHER SCIENTIFIC INC. : REVENUE SHARE BY REGION, 2022 (%)
    FIGURE 50. BIO-RAD LABORATORIES, INC. : NET SALES, 2020-2022 ($MILLION)
    FIGURE 51. BIO-RAD LABORATORIES, INC. : REVENUE SHARE BY SEGMENT, 2022 (%)
    FIGURE 52. BIO-RAD LABORATORIES, INC. : REVENUE SHARE BY REGION, 2022 (%)
    FIGURE 53. ABBOTT LABORATORIES: NET SALES, 2020-2022 ($MILLION)
    FIGURE 54. ABBOTT LABORATORIES: REVENUE SHARE BY SEGMENT, 2022 (%)
    FIGURE 55. ABBOTT LABORATORIES: REVENUE SHARE BY REGION, 2022 (%)
    FIGURE 56. F. HOFFMANN-LA ROCHE LTD.: NET REVENUE, 2020-2022 ($MILLION)
    FIGURE 57. F. HOFFMANN-LA ROCHE LTD.: REVENUE SHARE BY SEGMENT, 2022 (%)
    FIGURE 58. F. HOFFMANN-LA ROCHE LTD.: REVENUE SHARE BY REGION, 2022 (%)
    FIGURE 59. CARDINAL HEALTH INC.: NET REVENUE, 2020-2022 ($MILLION)
    FIGURE 60. CARDINAL HEALTH INC.: REVENUE SHARE BY SEGMENT, 2022 (%)
    FIGURE 61. CARDINAL HEALTH INC.: REVENUE SHARE BY REGION, 2022 (%)
    FIGURE 62. AVANOS MEDICAL, INC.: NET SALES, 2020-2022 ($MILLION)
    FIGURE 63. AVANOS MEDICAL, INC.: REVENUE SHARE BY REGION, 2022 (%)
    FIGURE 64. QUIDEL CORPORATION: NET REVENUE, 2019-2021 ($MILLION)
    FIGURE 65. QUIDEL CORPORATION: REVENUE SHARE BY SEGMENT, 2021 (%)
    FIGURE 66. QUIDEL CORPORATION: REVENUE SHARE BY REGION, 2021 (%)
    FIGURE 67. BIOHIT OYJ: NET REVENUE, 2020-2022 ($MILLION)
    FIGURE 68. BIOHIT OYJ: REVENUE SHARE BY REGION, 2022 (%)


PURCHASE OPTIONS

Call or Email us

U.S.-Canada Toll-free: +1-800-792-5285
Int'l : +1-503-894-6022
Europe : +44-845-528-1300
Email : help@alliedmarketresearch.com
 
FREQUENTLY ASKED QUESTIONS?

A. Increase in awareness about the importance of early diagnosis of H. pylori infection, rise in advancements in Helicobacter pylori diagnostics led to the development of more accurate and reliable tools, and surge in demand for minimally invasive methods for H. pylori testing are the factors responsible for the market growth.

A. The non-invasive test segment is the most influencing segment owing to high adoption of non-invasive tests such as serology and stool antigen tests as they are easy to perform and requires only a blood or stool sample.

A. Helicobacter pylori diagnostics refer to the various methods and tests used to detect the presence of H. pylori bacteria or associated antibodies in individuals of having H. pylori infection.

A. Top companies such as Abbott Laboratories, Thermo Fisher Scientific Inc., F. Hoffamann-La-Roche Ltd., and Bio-Rad Laboratories Inc. held high market share in 2022.

A. The base year is 2022 in Helicobacter pylori diagnostics market.

A. North America is the largest regional market for Helicobacter pylori diagnostics owing to easy availability of products for diagnosis of H. pylori bacteria, advanced healthcare infrastructure, rise in adoption of non-invasive method, and surge in adoption of advanced tools for H. pylori testing.

A. The estimated industry size of Helicobacter pylori diagnostics in 2032 is $926.79 million.

A. The forcast period for Helicobacter pylori diagnostics market is 2023 to 2032

Looking for Customization?

 Customization Request

Have a Question?

 Speak with Analyst

Any Confusion?

 Inquire Before Buying

Have a glance of the Report

  Request Sample
RELATED TAGS

Purchase Full Report of
Helicobacter Pylori Diagnostics Market

Start reading instantly.
This Report and over 67,069+ more Reports, Available with Avenue Library. T&C*.

  • Online Only
  • $3,570
  • Online cloud access only
  • Restricted print, copy, paste & download
  • Read only
  • Free industry update
    (Within 180 days)
  • Free report update in next update cycle
    (May 2024 - May 2025)
  • Data Pack
  • $3,840
  • Restricted to one authorized user
  • One print only
  • Available in
    Excel
  • Free industry update
    (Within 180 days)
  •   Free report update in next update cycle
    (May 2024 - May 2025)
  • Single User
  • $5,730
  • Restricted to one authorized user
  • One print only
  • Available in
    PDF
  • Free industry update
    (Within 180 days)
  •   Free report update in next update cycle
    (May 2024 - May 2025)
  • Five Users
  • $6,450
  • Limited to five authorized users
  • Print upto five copies
  • Available in
    PDF
  • Free industry update
    (Within 180 days)
  •   Free report update in next update cycle
    (May 2024 - May 2025)
  • Enterprise
    License/PDF

  • $9,600
  • Unlimited
    within
    company/enterprise
  • Available in Excel & PDF
  • Free industry update
    (Within 180 days)
  •   Free report update in next update cycle
    (May 2024 - May 2025)
  • Library
    Membership

  • $999 $ 1,175
    Per User/ Per month/ Billed annually
  • Published Content
    E-access
  • Company Profiles
    E-access
  • Newly Added Content Access
  • 10 PDF
    Downloads
  • 5 Excel Data
    Pack Downloads
  • 250 Company Profiles PDF Downloads
  • Buy Now

*Taxes/Fees, if applicable will be added during checkout. All prices in USD

RELATED REPORTS
 

Why Allied Market Research?


Infallible Methodology

To ensure high-level data integrity, accurate analysis, and impeccable forecasts

Analyst Support

For complete satisfaction

Customization

On-demand customization of scope of the report to exactly meet your needs

TARGETED MARKET VIEW

Targeted market view to provide pertinent information and save time of readers

Get fresh content delivered

Get insights on topics that are crucial for your business. Stay abreast of your interest areas.

Get Industry Data Alerts

Why Allied Market Research?

Infallible Methodology

To ensure high-level data integrity, accurate analysis, and impeccable forecasts

Analyst Support

For complete satisfaction

Customization

On-demand customization of scope of the report to exactly meet your needs

TARGETED MARKET VIEW

Targeted market view to provide pertinent information and save time of readers