
Herbicides Market Outlook - 2025
The global herbicides market size is expected to reach an overall market revenue of $7,998.9 million by 2025, by growing at a CAGR of 4.8% during the forecast period.
Report Key Highlighters:
- The herbicides market study covers 20 countries. The research includes a segment analysis of each country in terms of both value ($million) and volume (kilo tons) for the projected period 2018-2025.
- The study integrated high-quality data, professional opinions and analysis, and critical independent perspectives. The research approach is intended to provide a balanced view of global markets and to assist stakeholders in making educated decisions in order to achieve their most ambitious growth objectives.
- Over 3,700 product literatures, annual reports, industry statements, and other comparable materials from major industry participants were reviewed to gain a better understanding of the market.
- The biocides market is highly fragmented, with several players including BASF, Bayer AG, DowDupont, Syngenta AG, FMC Corporation, Adama Agricultural Solutions Ltd, and Nufarm Ltd. To Also tracked key strategies such as acquisitions, product launches, mergers, expansion etc. of the players operating in the biocides market.
Herbicides are specific category of pesticides used to control unwanted plants during cultivation. Also known as weedkillers, herbicides are of two types, selective and non-selective herbicides. Selective herbicides control specific weed species, leaving the desired crop unharmed, whereas non-selective herbicides can be used to clear industrial and construction sites, railways and railway ridges as they kill all plant material with which they come into contact.
The aim of using herbicides is to improve agricultural productivity by killing unwanted herbs and weeds in the plantation. Hence, increase in demand for high agricultural productivity to meet the global food demands majorly drives the growth of the herbicides market. In addition, surge in population and rise in disposable income of a developing region such as Asia-Pacific increases the demand for herbicides. However, the hazards associated with synthetic herbicides lead to stringent regulations on the use of herbicides, which majorly hampers the growth of the global herbicides market.

The regulations lead to increase in the demand for bio-based herbicides. To meet the stringent regulations and to improve efficiency of herbicides, major players invest in research and development (R&D) activities to develop new herbicides. Chemical industry is gradually shifting from synthetic chemicals to bio-based chemicals by referring its eco-friendly nature. Biocides is very fast and highly effective product to control over thousands of weed species. Most importantly, it has the potential to control the glyphosate tolerant and resistant weeds by using the existing spraying technology.
Advanced Technology, and Adoption of Modern Farming Practices
The world's population continues to grow, leading to increased demand for food production. Herbicides play a crucial role in agriculture by controlling weeds, which compete with crops for nutrients, water, and sunlight. The need to maximize crop yields and ensure food security drives the demand for effective herbicides. The agriculture industry is undergoing a transformation with the adoption of modern farming practices, including mechanization, precision agriculture, and genetically modified crops. These practices often require the use of herbicides to manage weed growth effectively, reduce labor costs, and optimize crop production.
Continuous advancements in herbicide technologies drive market growth. The development of new active ingredients, formulations, and application methods leads to more efficient and targeted weed control. Herbicide innovations that offer improved efficacy, lower environmental impact, and reduced application rates are sought after by farmers and agronomists. With increasing awareness of environmental sustainability and the impact of agriculture on ecosystems, there is a growing demand for herbicides that have minimal environmental footprint. Bioherbicides and herbicides with low toxicity to non-target organisms are gaining popularity as alternatives to conventional herbicides. The market is responding to this demand by offering more sustainable herbicide options.
Herbicides are not limited to agriculture; they are also used for weed management in non-agricultural areas such as industrial sites, roadsides, railways, and lawns. As urbanization and infrastructure development continue, there is a need for effective weed control in these areas, leading to the demand for herbicides specifically formulated for non-agricultural applications. These driving factors collectively contribute to the growth and demand for herbicides, promoting the development of new products, technologies, and sustainable practices in weed management. However, it is important to ensure responsible and judicious use of herbicides to minimize potential environmental impacts and address weed resistance challenges.
Global herbicide market is anticipated to grow with a constant growth rate during the extended period of forecast (2020–2025) as most of the driving and limiting forces would have sustained effect over the global market. Decrease in number of labors, consequent rise in cost of the laborers, and shortage of arable lands are the major factors that drive the growth of the global market of herbicides. Rapid growth in urbanization creates shortage of labor, due to which farmers are adopting unconventional farming practices to increase the crop yield in less crop cultivable land. However, increase in health and environmental concerns associated with synthetic herbicides restrict the growth of the market.
Stringent Regulations and Environmental Implications
Herbicides can have environmental implications, such as contamination of water bodies, soil degradation, and impacts on non-target organisms, including beneficial insects and wildlife. Increasing concerns about the potential adverse effects of herbicides on ecosystems, biodiversity, and human health can lead to stricter regulations, public scrutiny, and a preference for more sustainable alternatives. Herbicides are subject to stringent regulations and approval processes, which can create barriers for new product development and market entry. Regulatory requirements aim to ensure the safety and efficacy of herbicides, but the lengthy and costly registration processes can delay product launches and limit innovation in the market.
Limited awareness and education about proper herbicide use, integrated weed management practices, and alternative weed control methods can hinder the adoption of sustainable and responsible weed management approaches. Improving knowledge and promoting education among farmers, agronomists, and stakeholders are important to ensure the effective and judicious use of herbicides.
Expansion of Agriculture, and Adoption of genetically modified (GM) crops
The regulations lead to an increase in the demand for bio-based herbicides. To meet the stringent regulations and to improve efficiency of herbicides, major players invest in research and development (R&D) activities to develop new herbicides. Chemical industry is gradually shifting from synthetic chemicals to bio-based chemicals by referring its eco-friendly nature. Biocides is very fast and highly effective product to control over thousands of weed species. Most importantly, it has the potential to control the glyphosate tolerant and resistant weeds by using the existing spraying technology.
The adoption of genetically modified crops, such as herbicide-tolerant varieties, has increased significantly in recent years. These crops are engineered to withstand specific herbicides, allowing farmers to apply selective weed control measures. As the adoption of GM crops continues to grow, the demand for herbicides that are compatible with these crops is likely to increase. With the agricultural sector, particularly in emerging economies, there is a growing need for effective weed control solutions. Herbicides provide farmers with cost-effective and efficient means to manage weeds and protect their crops. As agricultural practices evolve and new lands are cultivated, the demand for herbicides is expected to rise.
While conventional agriculture relies heavily on herbicides for weed control, the organic farming sector presents an opportunity for alternative herbicide solutions. Organic farmers prioritize natural and non-synthetic methods of weed management, creating a demand for organic and bio-based herbicides. Manufacturers can capitalize on this trend by developing herbicides that are compliant with organic farming standards.
The global herbicides market is segmented based on type, mode of action, crop type, and region. Based on type, the market is bifurcated into synthetic herbicide and bio herbicide. There is an increase in the awareness for alternative methods of weed control and bio-based pesticides owing to rise in health concerns and adverse effects on environment. At present, bio-based herbicide is produced from phytotoxins of microbial or non-pathogenic soil microbes. Bialaphos, Phosphinothricin, and Triketone are among few commercially available bioherbicides that are expected to hold major share in the growth of the global herbicides market. Based on mode of action, the market is categorized into selective and non-selective herbicide. Based on crop type, it is divided into corn, cotton, soybean, wheat, and others. Based on region, the market is analyzed across North America, Europe, Asia-Pacific, and LAMEA.
Some of the major players analyzed in this report are BASF, Bayer AG, DowDupont, Syngenta AG, FMC Corporation, Adama Agricultural Solutions Ltd, and Nufarm Ltd. To stay competitive, these market players are adopting different strategies such as acquisition, merger, partnership and product launch. In an instance, the Corteva Agriscience subsidiary of DowDuPont acquired the Clearfield Canola Production System (“Clearfield canola”) in Canada and the U.S. from BASF. Clearfield canola is a globally-recognized non-genetically modified herbicide tolerance (HT) system. This acquisition helped strengthen its agriculture division.
Global Herbicides Market, By Type
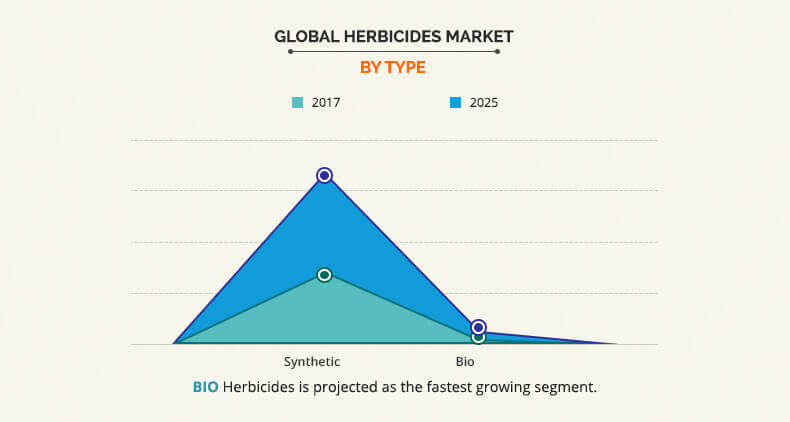
Glyphosate is the highest consumed herbicide in the prevailing market condition and also expected to retain its lead during the forecast period. The global market of glyphosate is expected to grow with a significant CAGR. Being an effective and low-cost solution, glyphosate is largely used in various applications in all geographies. Growers not only use it for weed management, but also for plant growth.
Global Herbicides Market, by Mode of Action
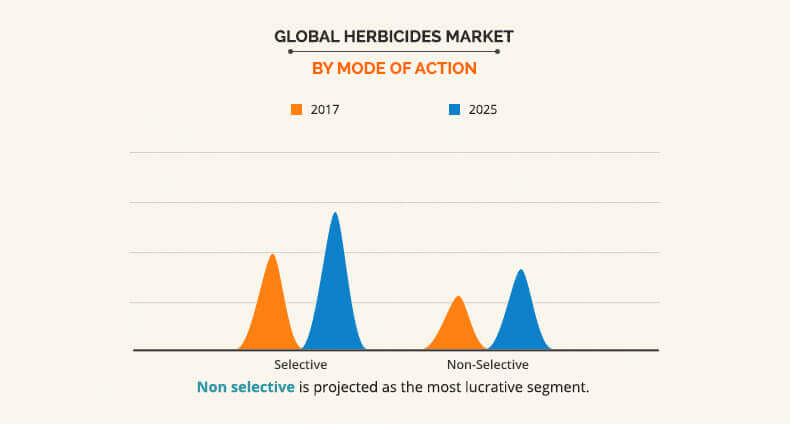
The applications segment of non-selective herbicide is more diverse than selective herbicide. In addition to weed management, the non-selective herbicides are also used for sustainable agricultural development.
Global Herbicides Market Share, by Crop type
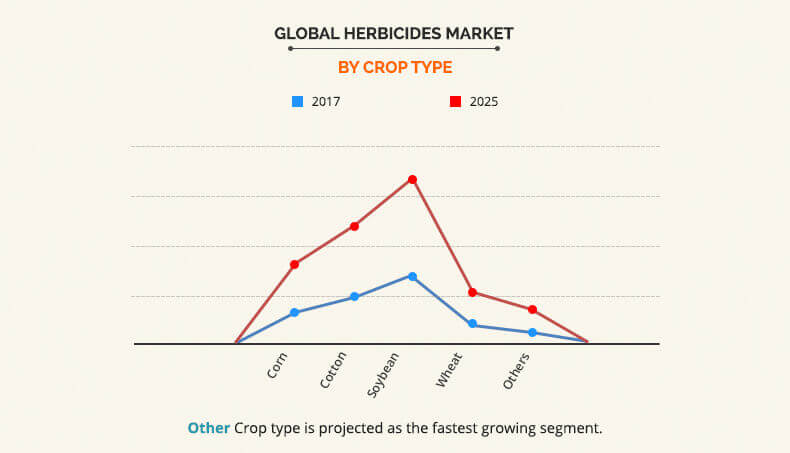
Other herbicides such as orchards & grapes, pasture & hay, rice, and vegetables & fruits are expected to be the fastest growing segment attributed to increase in use for stronger plants, higher crop yields, and higher farm profits.
Global Herbicides Market Share, by Region
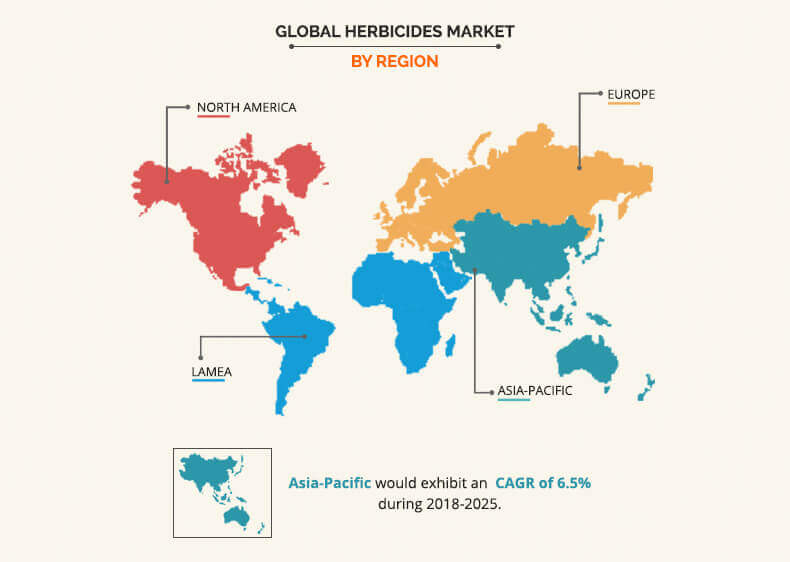
North America is and will continue to be the leading consumer of herbicides till 2025 due to the trend of early adoption of technology in the developed countries of the region. In this region, the application of herbicide is not limited to the agricultural field; it is also used for the weed management in lawns and forests. Considering this North America herbicides share expected to progress during the forecast period. In addition, North America and Asia-Pacific are expected to be the fastest growing markets at a CAGR of 3.9% and 6.5%, respectively during the forecast period.
Global Herbicides Market.
Key Benefits for Herbicide Market:
- Porter’s five forces analysis helps analyze the potential of buyers and suppliers and the competitive scenario of the Global herbicides industry for strategy building.
- It outlines the current trends and future scenario of the global herbicides market trends from 2017 to 2025 to understand the prevailing opportunities and potential investment pockets.
- Global herbicide market forecast has been provided by analyzing various macro and micro economic factors.
- Major countries in each region have been mapped according to their individual revenue contribution in the global/regional market.
- The key drivers, restrains, and opportunities and their detailed impact on herbicides market analysis are elucidated in the report.
- The profiles of key players competing in the industry along with their key strategic developments are enlisted in the report.
Herbicides Market Report Highlights
| Aspects | Details |
| By Type |
|
| By MODE OF ACTION |
|
| By CROP TYPE |
|
| By Region |
|
| Key Market Players | SYNGENTA, DOWDUPONT, NUFARM LIMITED, BAYER AG, NISSAN CHEMICAL CORPORATION, WILBUR-ELLIS HOLDINGS, INC, ADAMA AGRICULTURAL SOLUTIONS LTD, FMC CORPORATION, SUMITOMO CHEMICAL CO., LTD, BASF SE |
Analyst Review
The global herbicide market is segmented into product type, crop type, mode of action, and region. Based on product type, the market is further bifurcated into synthetic and bioherbicides. Among the all synthetic herbicides, glyphosate has the largest market share, due to its superior capacity to control GMO crops. It is majorly used in most of the developed regions, such as the U.S. and Australia.
However, due to the negative impact on health and environment, the other synthetic herbicides along with glyphosate are also prone to decline in terms of demand in various countries such as Brazil and the European Union. Bio-based herbicides are expected to evolve as an alternative to synthetic herbicides during the forecast period, owing to low toxicity, economical production method, and efficient usage in both organic and conventional farming.
Loading Table Of Content...

