0
2022
High Potency Apis Market

High Potency APIs Market

by Product Type (Innovative High-Potency API, Generic High-Potency API), by Application (Oncology, Hormonal Imbalance, Glaucoma, Others), by Type of Synthesis (Synthetic, Biotech): Global Opportunity Analysis and Industry Forecast, 2021-2031

Report Code: A31461
Oct 2022 | Pages: 310
Tables: 151
Charts: 60
  • Formats*:

  • pdf

    Single User License, Five User
    License & Enterprise User License

  • xls

    Data Pack Excel License

  • ppt

    It comes with the additional cost
    of $2500.00 contact sales.


High Potency APIs Market Research, 2031

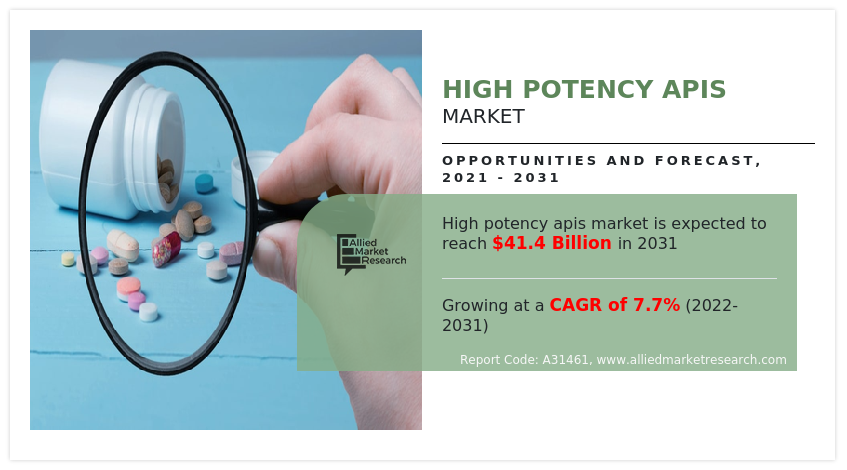
The global high potency apis market high potency APIs market size was valued at $19.7 billion in 2021, and is projected to reach $41.4 billion by 2031, growing at a CAGR of 7.7% from 2022 to 2031. High potency APIs are the active pharmaceutical ingredients which exhibit effect at a very low doses. They hold a significant share in the new drugs which are under development, which highlights their importance and application in the near future. In addition, high potency active pharmaceutical ingredients (HPAPI) are effective at much smaller dosage levels than traditional APIs, hence have a greater demand in the healthcare sector for treatment of serious ailments.
The COVID-19 witnessed a positive impact on the high potency APIs market. The pandemic has provided opportunities for the key market players to invest and develop innovative HPAPIs for the treatment of the infectious diseases. On the other hand, the market has been severely impacted by the COVID 19 epidemic. This mostly refers to the worldwide market's supply chain.

High Potency APIs Market

According to the Centers for Disease Control and Prevention, CDC, it is estimated that 12.1 million people in the U.S. will have atrial fibrillation in 2030. Many such cardiovascular disorders can be treated using these HPAPIs. Thus, the prevalence of the cardiovascular diseases in large number of population, will lead to the rise in the demand for the HPAPIs and will also propel the high potency APIs market growth. In addition, World Health Organization, WHO, states that an estimated 1.28 billion adults aged 30-79 years worldwide have hypertension, most of them belong to low- and middle-income countries, which will accelerate the growth of the market due to the rise in the demand of high potency drugs for cardiovascular disorders treatments and other diseases such as hormonal imbalance and glaucoma.

In addition, the government initiatives focusing on active pharmaceutical ingredient production are adding to the growth of the. For instance, the government scheme Production Linked Incentive (PLI) Scheme for Promotion of Domestic Manufacturing of critical Key Starting Materials (KSMs)/ Drug Intermediates and Active Pharmaceutical Ingredients (APIs) in the Country (India) which was announced in 2020, to boost domestic manufacturing of identified drug intermediates and APIs by attracting large investments in this sector, which will further boost the high potency APIs market during the forecast period.

The primary driving factors for the market includes the patent expiration of various drugs, launching of more cost effective generic substitutes, and increase in the demand for cancer treatment, along with the huge number of cancer treatment drugs in the pipeline for the future, increase in the number of contract manufacturing organizations, CMO, and is the contract development and manufacturing organizations, CDMOs. In the recent years, there is an increase in the partnerships between CMOs, CDMOs, and pharma companies, which lack the means and funds to take their product from its first phases to production and commercialization. Thus, CMOs and CDMOs collaborate with these organization for the further phases of production of the high potency APIs and leads to the growth of the market.

Furthermore, high risk of cross-contamination, huge capital investment and high technical skills required for the production are expected to provide hindrance to the market. However, patent expiry allows the generic companies to penetrate in the market and diversify product offerings, which provides a large opportunities for the market players during the forecast period.

Impact of COVID-19 on High Potency APIs Market

The COVID-19 pandemic have proved to be an incomparable global public health emergency that has affected almost every industry, and the effects are expected to impact every industry growth during the forecast period. Several changes in consumer demand and behavior, buying habits, supply chain redirection, and significant government initiatives have been seen around the globe. The COVID-19 witnessed a positive as well as negative impact on the high potency APIs market. The pandemic has provided opportunities for the key market players to invest and develop innovative HPAPIs for the treatment of the infectious diseases. On the other hand, the market has been severely impacted by the COVID 19 epidemic. This mostly refers to the worldwide market's supply chain. Additionally, India, which accounts for approximately 20% of the global market for the production of generic pharmaceutical drugs, manufactures the majority of APIs, particularly high strength active pharmaceutical ingredients was highly affected by the pandemic.

The high potency apis market is segmented into Application, Type of Synthesis and Product Type.

The high potency APIs market is segmented on the basis of product type, by application, by type of synthesis and region. On the basis of product type, the market is segmented into innovative high-potency API and generic high-potency API. On the basis of application, the market is segmented into oncology, hormonal imbalance, glaucoma and others. On the basis of type of synthesis, the market is segmented into synthetic and biotech. Further, the biotech is divided into merchant and captive.

Region wise, the market is analyzed across North America (the U.S., Canada, and Mexico), Europe (Germany, France, UK, Italy, Spain, and rest of Europe), Asia-Pacific (Japan, China, Australia, India, South Korea, and rest of Asia-Pacific), and LAMEA (Brazil, Saudi Arabia, South Africa, and rest of LAMEA).

Segment Review
High Potency APIs Market

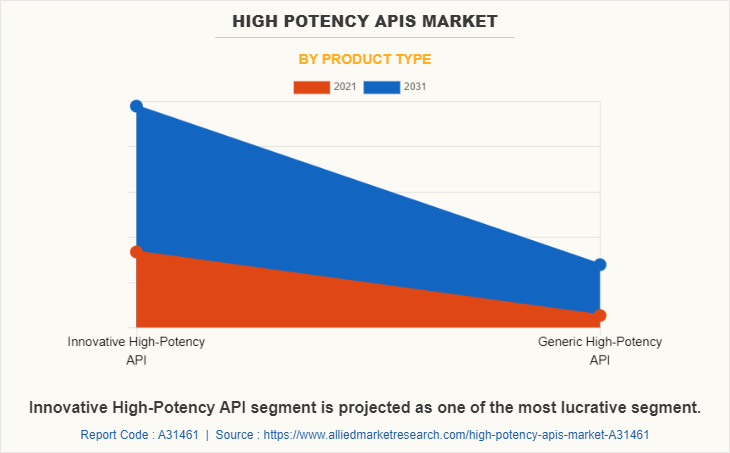
By product type, the market is segmented into innovative high-potency API and generic high-potency API. The innovative high-potency API segment generated maximum revenue in 2021, and is estimated to be the fastest growing segment, with a high CAGR owing to the increase in the R&D initiatives for novel drug development adopted by the pharmaceutical companies and favorable government policies, growing focus on personalized and precision medicines to treat specific disease conditions.
High Potency APIs Market

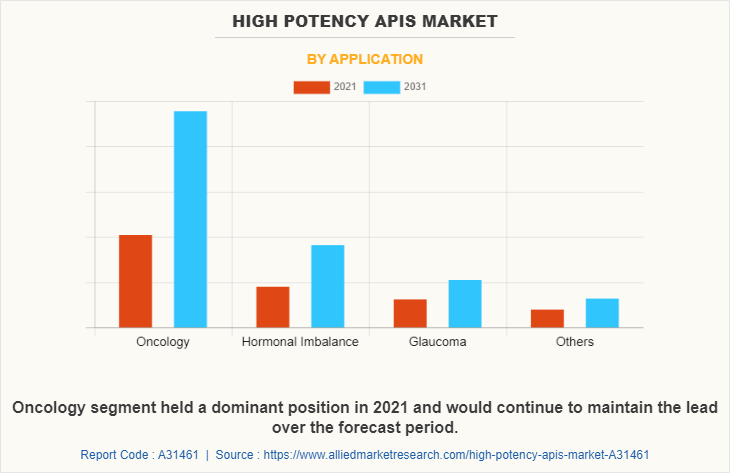
Depending on the application, the high potency APIs industry is divided into oncology, hormonal imbalance, glaucoma and others. The oncology segment dominated the market in 2021, and is estimated to grow with a high CAGR during the high potency APIs market forecast period due rise in the prevalence of cancer.
High Potency APIs Market

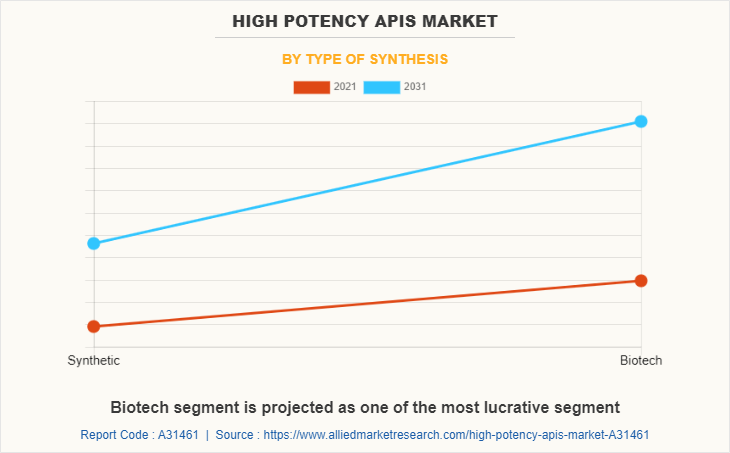
Depending on type of synthesis, the high potency APIs industry is divided into synthetic and biotech. The biotech segment owned the largest high potency APIs market share in 2021, because of the technological advancements and the high level of efficacy of these ingredients.
High Potency APIs Market

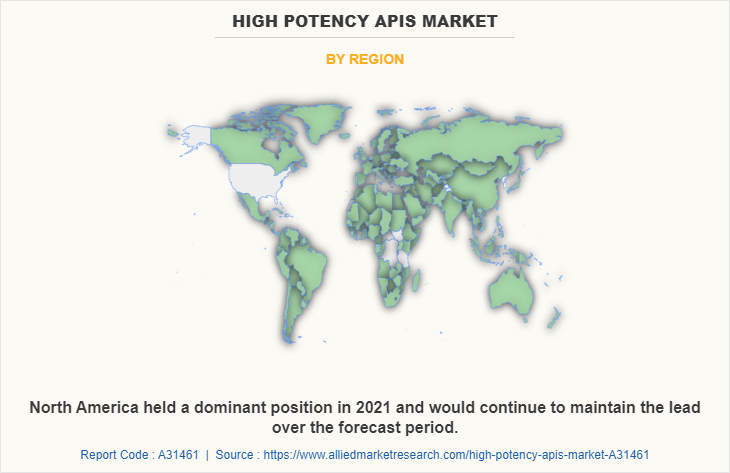
Region wise, North America acquired a major share in the year 2021, owing to the presence of key players, rising government initiatives, well-developed healthcare infrastructure, and rising awareness about the HPAPIs in the treatment of the serious ailments. The region registered the growth at a highest CAGR. However, Asia-Pacific is expected to witness the highest growth rate for the high potency APIs market throughout the forecast period. The major factors that drive the growth of the high potency APIs market share is the elevating healthcare demand for highly potent drug, unmet needs for the cancer treatment and availability of excessive raw material in this region. Also, the rise in market players investing in research and development are leveraging the high potency APIs market size.

The major companies profiled in this report include Abbvie Inc., Bayer AG, Boehringer Ingelheim International GmbH, Bristol-Myers Squibb, Eli Lilly and Company, F. Hoffmann-La Roche Ltd, Novartis AG, Pfizer Inc., Sanofi, Teva Pharmaceutical Industries Ltd. and others.

Key Benefits For Stakeholders

  • This report provides a quantitative analysis of the market segments, current trends, estimations, and dynamics of the high potency apis market analysis from 2021 to 2031 to identify the prevailing high potency apis market opportunity.
  • The market research is offered along with information related to key drivers, restraints, and opportunities.
  • Porter's five forces analysis highlights the potency of buyers and suppliers to enable stakeholders make profit-oriented business decisions and strengthen their supplier-buyer network.
  • In-depth analysis of the high potency apis market segmentation assists to determine the prevailing market opportunities.
  • Major countries in each region are mapped according to their revenue contribution to the global market.
  • Market player positioning facilitates benchmarking and provides a clear understanding of the present position of the market players.
  • The report includes the analysis of the regional as well as global high potency apis market trends, key players, market segments, application areas, and market growth strategies.

High Potency APIs Market Report Highlights

Aspects Details
Market Size By 2031 USD 41.4 billion
Growth Rate CAGR of 7.7%
Forecast period 2021 - 2031
Report Pages 310
By Application
  • Oncology
  • Hormonal Imbalance
  • Glaucoma
  • Others
By Type of Synthesis
  • Synthetic
  • Biotech
    • Type
      • Merchant
      • Captive
By Product Type
  • Innovative High-Potency API
  • Generic High-Potency API
By Region
  • North America  (U.S., Canada, Mexico)
  • Europe  (Germany, France, UK, Italy, Spain, Rest Of Europe)
  • Asia-Pacific  (Japan, China, Australia, India, South Korea, Rest Of Asia-Pacific)
  • LAMEA  (Brazil, Saudi Arabia, South Africa, Rest Of LAMEA)
Key Market Players Eli Lilly and Company, Sanofi, Pfizer, Inc., Boehringer Ingelheim International GmbH, Novartis International AG, Bristol-Myers Squibb Company, AbbVie Inc., Bayer AG, F. Hoffmann-La Roche, Teva Pharmaceutical Industries Ltd.
 
  • CHAPTER 1:INTRODUCTION

    • 1.1.Report description

    • 1.2.Key market segments

    • 1.3.Key benefits to the stakeholders

    • 1.4.Research Methodology

      • 1.4.1.Secondary research

      • 1.4.2.Primary research

      • 1.4.3.Analyst tools and models

  • CHAPTER 2:EXECUTIVE SUMMARY

    • 2.1.Key findings of the study

    • 2.2.CXO Perspective

  • CHAPTER 3:MARKET OVERVIEW

    • 3.1.Market definition and scope

    • 3.2.Key findings

      • 3.2.1.Top investment pockets

    • 3.3.Porter’s five forces analysis

    • 3.4.Top player positioning

    • 3.5.Market dynamics

      • 3.5.1.Drivers

      • 3.5.2.Restraints

      • 3.5.3.Opportunities

    • 3.6.COVID-19 Impact Analysis on the market

    • 3.7.Patent Landscape

  • CHAPTER 4: HIGH POTENCY APIS MARKET, BY PRODUCT TYPE

    • 4.1 Overview

      • 4.1.1 Market size and forecast

    • 4.2 Innovative High-Potency API

      • 4.2.1 Key market trends, growth factors and opportunities

      • 4.2.2 Market size and forecast, by region

      • 4.2.3 Market analysis by country

    • 4.3 Generic High-Potency API

      • 4.3.1 Key market trends, growth factors and opportunities

      • 4.3.2 Market size and forecast, by region

      • 4.3.3 Market analysis by country

  • CHAPTER 5: HIGH POTENCY APIS MARKET, BY APPLICATION

    • 5.1 Overview

      • 5.1.1 Market size and forecast

    • 5.2 Oncology

      • 5.2.1 Key market trends, growth factors and opportunities

      • 5.2.2 Market size and forecast, by region

      • 5.2.3 Market analysis by country

    • 5.3 Hormonal Imbalance

      • 5.3.1 Key market trends, growth factors and opportunities

      • 5.3.2 Market size and forecast, by region

      • 5.3.3 Market analysis by country

    • 5.4 Glaucoma

      • 5.4.1 Key market trends, growth factors and opportunities

      • 5.4.2 Market size and forecast, by region

      • 5.4.3 Market analysis by country

    • 5.5 Others

      • 5.5.1 Key market trends, growth factors and opportunities

      • 5.5.2 Market size and forecast, by region

      • 5.5.3 Market analysis by country

  • CHAPTER 6: HIGH POTENCY APIS MARKET, BY TYPE OF SYNTHESIS

    • 6.1 Overview

      • 6.1.1 Market size and forecast

    • 6.2 Synthetic

      • 6.2.1 Key market trends, growth factors and opportunities

      • 6.2.2 Market size and forecast, by region

      • 6.2.3 Market analysis by country

    • 6.3 Biotech

      • 6.3.1 Key market trends, growth factors and opportunities

      • 6.3.2 Market size and forecast, by region

      • 6.3.3 Market analysis by country

      • 6.3.4 Biotech High Potency APIs Market by Type

        • 6.3.4.1 Merchant Market size and forecast, by region
        • 6.3.4.2 Captive Market size and forecast, by region
  • CHAPTER 7: HIGH POTENCY APIS MARKET, BY REGION

    • 7.1 Overview

      • 7.1.1 Market size and forecast

    • 7.2 North America

      • 7.2.1 Key trends and opportunities

      • 7.2.2 North America Market size and forecast, by Product Type

      • 7.2.3 North America Market size and forecast, by Application

      • 7.2.4 North America Market size and forecast, by Type of Synthesis

        • 7.2.4.1 North America Biotech High Potency APIs Market by Type
      • 7.2.5 North America Market size and forecast, by country

        • 7.2.5.1 U.S.
          • 7.2.5.1.1 Market size and forecast, by Product Type
          • 7.2.5.1.2 Market size and forecast, by Application
          • 7.2.5.1.3 Market size and forecast, by Type of Synthesis
        • 7.2.5.2 Canada
          • 7.2.5.2.1 Market size and forecast, by Product Type
          • 7.2.5.2.2 Market size and forecast, by Application
          • 7.2.5.2.3 Market size and forecast, by Type of Synthesis
        • 7.2.5.3 Mexico
          • 7.2.5.3.1 Market size and forecast, by Product Type
          • 7.2.5.3.2 Market size and forecast, by Application
          • 7.2.5.3.3 Market size and forecast, by Type of Synthesis
    • 7.3 Europe

      • 7.3.1 Key trends and opportunities

      • 7.3.2 Europe Market size and forecast, by Product Type

      • 7.3.3 Europe Market size and forecast, by Application

      • 7.3.4 Europe Market size and forecast, by Type of Synthesis

        • 7.3.4.1 Europe Biotech High Potency APIs Market by Type
      • 7.3.5 Europe Market size and forecast, by country

        • 7.3.5.1 Germany
          • 7.3.5.1.1 Market size and forecast, by Product Type
          • 7.3.5.1.2 Market size and forecast, by Application
          • 7.3.5.1.3 Market size and forecast, by Type of Synthesis
        • 7.3.5.2 France
          • 7.3.5.2.1 Market size and forecast, by Product Type
          • 7.3.5.2.2 Market size and forecast, by Application
          • 7.3.5.2.3 Market size and forecast, by Type of Synthesis
        • 7.3.5.3 UK
          • 7.3.5.3.1 Market size and forecast, by Product Type
          • 7.3.5.3.2 Market size and forecast, by Application
          • 7.3.5.3.3 Market size and forecast, by Type of Synthesis
        • 7.3.5.4 Italy
          • 7.3.5.4.1 Market size and forecast, by Product Type
          • 7.3.5.4.2 Market size and forecast, by Application
          • 7.3.5.4.3 Market size and forecast, by Type of Synthesis
        • 7.3.5.5 Spain
          • 7.3.5.5.1 Market size and forecast, by Product Type
          • 7.3.5.5.2 Market size and forecast, by Application
          • 7.3.5.5.3 Market size and forecast, by Type of Synthesis
        • 7.3.5.6 Rest of Europe
          • 7.3.5.6.1 Market size and forecast, by Product Type
          • 7.3.5.6.2 Market size and forecast, by Application
          • 7.3.5.6.3 Market size and forecast, by Type of Synthesis
    • 7.4 Asia-Pacific

      • 7.4.1 Key trends and opportunities

      • 7.4.2 Asia-Pacific Market size and forecast, by Product Type

      • 7.4.3 Asia-Pacific Market size and forecast, by Application

      • 7.4.4 Asia-Pacific Market size and forecast, by Type of Synthesis

        • 7.4.4.1 Asia-Pacific Biotech High Potency APIs Market by Type
      • 7.4.5 Asia-Pacific Market size and forecast, by country

        • 7.4.5.1 Japan
          • 7.4.5.1.1 Market size and forecast, by Product Type
          • 7.4.5.1.2 Market size and forecast, by Application
          • 7.4.5.1.3 Market size and forecast, by Type of Synthesis
        • 7.4.5.2 China
          • 7.4.5.2.1 Market size and forecast, by Product Type
          • 7.4.5.2.2 Market size and forecast, by Application
          • 7.4.5.2.3 Market size and forecast, by Type of Synthesis
        • 7.4.5.3 Australia
          • 7.4.5.3.1 Market size and forecast, by Product Type
          • 7.4.5.3.2 Market size and forecast, by Application
          • 7.4.5.3.3 Market size and forecast, by Type of Synthesis
        • 7.4.5.4 India
          • 7.4.5.4.1 Market size and forecast, by Product Type
          • 7.4.5.4.2 Market size and forecast, by Application
          • 7.4.5.4.3 Market size and forecast, by Type of Synthesis
        • 7.4.5.5 South Korea
          • 7.4.5.5.1 Market size and forecast, by Product Type
          • 7.4.5.5.2 Market size and forecast, by Application
          • 7.4.5.5.3 Market size and forecast, by Type of Synthesis
        • 7.4.5.6 Rest of Asia-Pacific
          • 7.4.5.6.1 Market size and forecast, by Product Type
          • 7.4.5.6.2 Market size and forecast, by Application
          • 7.4.5.6.3 Market size and forecast, by Type of Synthesis
    • 7.5 LAMEA

      • 7.5.1 Key trends and opportunities

      • 7.5.2 LAMEA Market size and forecast, by Product Type

      • 7.5.3 LAMEA Market size and forecast, by Application

      • 7.5.4 LAMEA Market size and forecast, by Type of Synthesis

        • 7.5.4.1 LAMEA Biotech High Potency APIs Market by Type
      • 7.5.5 LAMEA Market size and forecast, by country

        • 7.5.5.1 Brazil
          • 7.5.5.1.1 Market size and forecast, by Product Type
          • 7.5.5.1.2 Market size and forecast, by Application
          • 7.5.5.1.3 Market size and forecast, by Type of Synthesis
        • 7.5.5.2 Saudi Arabia
          • 7.5.5.2.1 Market size and forecast, by Product Type
          • 7.5.5.2.2 Market size and forecast, by Application
          • 7.5.5.2.3 Market size and forecast, by Type of Synthesis
        • 7.5.5.3 South Africa
          • 7.5.5.3.1 Market size and forecast, by Product Type
          • 7.5.5.3.2 Market size and forecast, by Application
          • 7.5.5.3.3 Market size and forecast, by Type of Synthesis
        • 7.5.5.4 Rest of LAMEA
          • 7.5.5.4.1 Market size and forecast, by Product Type
          • 7.5.5.4.2 Market size and forecast, by Application
          • 7.5.5.4.3 Market size and forecast, by Type of Synthesis
  • CHAPTER 8: COMPANY LANDSCAPE

    • 8.1. Introduction

    • 8.2. Top winning strategies

    • 8.3. Product Mapping of Top 10 Player

    • 8.4. Competitive Dashboard

    • 8.5. Competitive Heatmap

    • 8.6. Key developments

  • CHAPTER 9: COMPANY PROFILES

    • 9.1 AbbVie Inc.

      • 9.1.1 Company overview

      • 9.1.2 Company snapshot

      • 9.1.3 Operating business segments

      • 9.1.4 Product portfolio

      • 9.1.5 Business performance

      • 9.1.6 Key strategic moves and developments

    • 9.2 Bayer AG

      • 9.2.1 Company overview

      • 9.2.2 Company snapshot

      • 9.2.3 Operating business segments

      • 9.2.4 Product portfolio

      • 9.2.5 Business performance

      • 9.2.6 Key strategic moves and developments

    • 9.3 Boehringer Ingelheim International GmbH

      • 9.3.1 Company overview

      • 9.3.2 Company snapshot

      • 9.3.3 Operating business segments

      • 9.3.4 Product portfolio

      • 9.3.5 Business performance

      • 9.3.6 Key strategic moves and developments

    • 9.4 Bristol-Myers Squibb Company

      • 9.4.1 Company overview

      • 9.4.2 Company snapshot

      • 9.4.3 Operating business segments

      • 9.4.4 Product portfolio

      • 9.4.5 Business performance

      • 9.4.6 Key strategic moves and developments

    • 9.5 Eli Lilly and Company

      • 9.5.1 Company overview

      • 9.5.2 Company snapshot

      • 9.5.3 Operating business segments

      • 9.5.4 Product portfolio

      • 9.5.5 Business performance

      • 9.5.6 Key strategic moves and developments

    • 9.6 F. Hoffmann-La Roche

      • 9.6.1 Company overview

      • 9.6.2 Company snapshot

      • 9.6.3 Operating business segments

      • 9.6.4 Product portfolio

      • 9.6.5 Business performance

      • 9.6.6 Key strategic moves and developments

    • 9.7 Novartis International AG

      • 9.7.1 Company overview

      • 9.7.2 Company snapshot

      • 9.7.3 Operating business segments

      • 9.7.4 Product portfolio

      • 9.7.5 Business performance

      • 9.7.6 Key strategic moves and developments

    • 9.8 Pfizer, Inc.

      • 9.8.1 Company overview

      • 9.8.2 Company snapshot

      • 9.8.3 Operating business segments

      • 9.8.4 Product portfolio

      • 9.8.5 Business performance

      • 9.8.6 Key strategic moves and developments

    • 9.9 Sanofi

      • 9.9.1 Company overview

      • 9.9.2 Company snapshot

      • 9.9.3 Operating business segments

      • 9.9.4 Product portfolio

      • 9.9.5 Business performance

      • 9.9.6 Key strategic moves and developments

    • 9.10 Teva Pharmaceutical Industries Ltd.

      • 9.10.1 Company overview

      • 9.10.2 Company snapshot

      • 9.10.3 Operating business segments

      • 9.10.4 Product portfolio

      • 9.10.5 Business performance

      • 9.10.6 Key strategic moves and developments

  • LIST OF TABLES

  • TABLE 1. GLOBAL HIGH POTENCY APIS MARKET, BY PRODUCT TYPE, 2021-2031 ($MILLION)
    TABLE 2. HIGH POTENCY APIS MARKET, FOR INNOVATIVE HIGH-POTENCY API, BY REGION, 2021-2031 ($MILLION)
    TABLE 3. HIGH POTENCY APIS MARKET FOR INNOVATIVE HIGH-POTENCY API, BY COUNTRY, 2021-2031 ($MILLION)
    TABLE 4. HIGH POTENCY APIS MARKET, FOR GENERIC HIGH-POTENCY API, BY REGION, 2021-2031 ($MILLION)
    TABLE 5. HIGH POTENCY APIS MARKET FOR GENERIC HIGH-POTENCY API, BY COUNTRY, 2021-2031 ($MILLION)
    TABLE 6. GLOBAL HIGH POTENCY APIS MARKET, BY APPLICATION, 2021-2031 ($MILLION)
    TABLE 7. HIGH POTENCY APIS MARKET, FOR ONCOLOGY, BY REGION, 2021-2031 ($MILLION)
    TABLE 8. HIGH POTENCY APIS MARKET FOR ONCOLOGY, BY COUNTRY, 2021-2031 ($MILLION)
    TABLE 9. HIGH POTENCY APIS MARKET, FOR HORMONAL IMBALANCE, BY REGION, 2021-2031 ($MILLION)
    TABLE 10. HIGH POTENCY APIS MARKET FOR HORMONAL IMBALANCE, BY COUNTRY, 2021-2031 ($MILLION)
    TABLE 11. HIGH POTENCY APIS MARKET, FOR GLAUCOMA, BY REGION, 2021-2031 ($MILLION)
    TABLE 12. HIGH POTENCY APIS MARKET FOR GLAUCOMA, BY COUNTRY, 2021-2031 ($MILLION)
    TABLE 13. HIGH POTENCY APIS MARKET, FOR OTHERS, BY REGION, 2021-2031 ($MILLION)
    TABLE 14. HIGH POTENCY APIS MARKET FOR OTHERS, BY COUNTRY, 2021-2031 ($MILLION)
    TABLE 15. GLOBAL HIGH POTENCY APIS MARKET, BY TYPE OF SYNTHESIS, 2021-2031 ($MILLION)
    TABLE 16. HIGH POTENCY APIS MARKET, FOR SYNTHETIC, BY REGION, 2021-2031 ($MILLION)
    TABLE 17. HIGH POTENCY APIS MARKET FOR SYNTHETIC, BY COUNTRY, 2021-2031 ($MILLION)
    TABLE 18. HIGH POTENCY APIS MARKET, FOR BIOTECH, BY REGION, 2021-2031 ($MILLION)
    TABLE 19. HIGH POTENCY APIS MARKET FOR BIOTECH, BY COUNTRY, 2021-2031 ($MILLION)
    TABLE 20. GLOBAL BIOTECH HIGH POTENCY APIS MARKET, BY TYPE, 2021-2031 ($MILLION)
    TABLE 21. HIGH POTENCY APIS MARKET, FOR MERCHANT, BY REGION, 2021-2031 ($MILLION)
    TABLE 22. HIGH POTENCY APIS MARKET, FOR CAPTIVE, BY REGION, 2021-2031 ($MILLION)
    TABLE 23. HIGH POTENCY APIS MARKET, BY REGION, 2021-2031 ($MILLION)
    TABLE 24. NORTH AMERICA HIGH POTENCY APIS MARKET, BY PRODUCT TYPE, 2021-2031 ($MILLION)
    TABLE 25. NORTH AMERICA HIGH POTENCY APIS MARKET, BY APPLICATION, 2021-2031 ($MILLION)
    TABLE 26. NORTH AMERICA HIGH POTENCY APIS MARKET, BY TYPE OF SYNTHESIS, 2021-2031 ($MILLION)
    TABLE 27. NORTH AMERICA BIOTECH HIGH POTENCY APIS MARKET, BY TYPE, 2021-2031 ($MILLION)
    TABLE 28. NORTH AMERICA HIGH POTENCY APIS MARKET, BY COUNTRY, 2021-2031 ($MILLION)
    TABLE 29. U.S. HIGH POTENCY APIS MARKET, BY PRODUCT TYPE, 2021-2031 ($MILLION)
    TABLE 30. U.S. HIGH POTENCY APIS MARKET, BY APPLICATION, 2021-2031 ($MILLION)
    TABLE 31. U.S. HIGH POTENCY APIS MARKET, BY TYPE OF SYNTHESIS, 2021-2031 ($MILLION)
    TABLE 32. CANADA HIGH POTENCY APIS MARKET, BY PRODUCT TYPE, 2021-2031 ($MILLION)
    TABLE 33. CANADA HIGH POTENCY APIS MARKET, BY APPLICATION, 2021-2031 ($MILLION)
    TABLE 34. CANADA HIGH POTENCY APIS MARKET, BY TYPE OF SYNTHESIS, 2021-2031 ($MILLION)
    TABLE 35. MEXICO HIGH POTENCY APIS MARKET, BY PRODUCT TYPE, 2021-2031 ($MILLION)
    TABLE 36. MEXICO HIGH POTENCY APIS MARKET, BY APPLICATION, 2021-2031 ($MILLION)
    TABLE 37. MEXICO HIGH POTENCY APIS MARKET, BY TYPE OF SYNTHESIS, 2021-2031 ($MILLION)
    TABLE 38. EUROPE HIGH POTENCY APIS MARKET, BY PRODUCT TYPE, 2021-2031 ($MILLION)
    TABLE 39. EUROPE HIGH POTENCY APIS MARKET, BY APPLICATION, 2021-2031 ($MILLION)
    TABLE 40. EUROPE HIGH POTENCY APIS MARKET, BY TYPE OF SYNTHESIS, 2021-2031 ($MILLION)
    TABLE 41. EUROPE BIOTECH HIGH POTENCY APIS MARKET, BY TYPE, 2021-2031 ($MILLION)
    TABLE 42. EUROPE HIGH POTENCY APIS MARKET, BY COUNTRY, 2021-2031 ($MILLION)
    TABLE 43. GERMANY HIGH POTENCY APIS MARKET, BY PRODUCT TYPE, 2021-2031 ($MILLION)
    TABLE 44. GERMANY HIGH POTENCY APIS MARKET, BY APPLICATION, 2021-2031 ($MILLION)
    TABLE 45. GERMANY HIGH POTENCY APIS MARKET, BY TYPE OF SYNTHESIS, 2021-2031 ($MILLION)
    TABLE 46. FRANCE HIGH POTENCY APIS MARKET, BY PRODUCT TYPE, 2021-2031 ($MILLION)
    TABLE 47. FRANCE HIGH POTENCY APIS MARKET, BY APPLICATION, 2021-2031 ($MILLION)
    TABLE 48. FRANCE HIGH POTENCY APIS MARKET, BY TYPE OF SYNTHESIS, 2021-2031 ($MILLION)
    TABLE 49. UK HIGH POTENCY APIS MARKET, BY PRODUCT TYPE, 2021-2031 ($MILLION)
    TABLE 50. UK HIGH POTENCY APIS MARKET, BY APPLICATION, 2021-2031 ($MILLION)
    TABLE 51. UK HIGH POTENCY APIS MARKET, BY TYPE OF SYNTHESIS, 2021-2031 ($MILLION)
    TABLE 52. ITALY HIGH POTENCY APIS MARKET, BY PRODUCT TYPE, 2021-2031 ($MILLION)
    TABLE 53. ITALY HIGH POTENCY APIS MARKET, BY APPLICATION, 2021-2031 ($MILLION)
    TABLE 54. ITALY HIGH POTENCY APIS MARKET, BY TYPE OF SYNTHESIS, 2021-2031 ($MILLION)
    TABLE 55. SPAIN HIGH POTENCY APIS MARKET, BY PRODUCT TYPE, 2021-2031 ($MILLION)
    TABLE 56. SPAIN HIGH POTENCY APIS MARKET, BY APPLICATION, 2021-2031 ($MILLION)
    TABLE 57. SPAIN HIGH POTENCY APIS MARKET, BY TYPE OF SYNTHESIS, 2021-2031 ($MILLION)
    TABLE 58. REST OF EUROPE HIGH POTENCY APIS MARKET, BY PRODUCT TYPE, 2021-2031 ($MILLION)
    TABLE 59. REST OF EUROPE HIGH POTENCY APIS MARKET, BY APPLICATION, 2021-2031 ($MILLION)
    TABLE 60. REST OF EUROPE HIGH POTENCY APIS MARKET, BY TYPE OF SYNTHESIS, 2021-2031 ($MILLION)
    TABLE 61. ASIA-PACIFIC HIGH POTENCY APIS MARKET, BY PRODUCT TYPE, 2021-2031 ($MILLION)
    TABLE 62. ASIA-PACIFIC HIGH POTENCY APIS MARKET, BY APPLICATION, 2021-2031 ($MILLION)
    TABLE 63. ASIA-PACIFIC HIGH POTENCY APIS MARKET, BY TYPE OF SYNTHESIS, 2021-2031 ($MILLION)
    TABLE 64. ASIA-PACIFIC BIOTECH HIGH POTENCY APIS MARKET, BY TYPE, 2021-2031 ($MILLION)
    TABLE 65. ASIA-PACIFIC HIGH POTENCY APIS MARKET, BY COUNTRY, 2021-2031 ($MILLION)
    TABLE 66. JAPAN HIGH POTENCY APIS MARKET, BY PRODUCT TYPE, 2021-2031 ($MILLION)
    TABLE 67. JAPAN HIGH POTENCY APIS MARKET, BY APPLICATION, 2021-2031 ($MILLION)
    TABLE 68. JAPAN HIGH POTENCY APIS MARKET, BY TYPE OF SYNTHESIS, 2021-2031 ($MILLION)
    TABLE 69. CHINA HIGH POTENCY APIS MARKET, BY PRODUCT TYPE, 2021-2031 ($MILLION)
    TABLE 70. CHINA HIGH POTENCY APIS MARKET, BY APPLICATION, 2021-2031 ($MILLION)
    TABLE 71. CHINA HIGH POTENCY APIS MARKET, BY TYPE OF SYNTHESIS, 2021-2031 ($MILLION)
    TABLE 72. AUSTRALIA HIGH POTENCY APIS MARKET, BY PRODUCT TYPE, 2021-2031 ($MILLION)
    TABLE 73. AUSTRALIA HIGH POTENCY APIS MARKET, BY APPLICATION, 2021-2031 ($MILLION)
    TABLE 74. AUSTRALIA HIGH POTENCY APIS MARKET, BY TYPE OF SYNTHESIS, 2021-2031 ($MILLION)
    TABLE 75. INDIA HIGH POTENCY APIS MARKET, BY PRODUCT TYPE, 2021-2031 ($MILLION)
    TABLE 76. INDIA HIGH POTENCY APIS MARKET, BY APPLICATION, 2021-2031 ($MILLION)
    TABLE 77. INDIA HIGH POTENCY APIS MARKET, BY TYPE OF SYNTHESIS, 2021-2031 ($MILLION)
    TABLE 78. SOUTH KOREA HIGH POTENCY APIS MARKET, BY PRODUCT TYPE, 2021-2031 ($MILLION)
    TABLE 79. SOUTH KOREA HIGH POTENCY APIS MARKET, BY APPLICATION, 2021-2031 ($MILLION)
    TABLE 80. SOUTH KOREA HIGH POTENCY APIS MARKET, BY TYPE OF SYNTHESIS, 2021-2031 ($MILLION)
    TABLE 81. REST OF ASIA-PACIFIC HIGH POTENCY APIS MARKET, BY PRODUCT TYPE, 2021-2031 ($MILLION)
    TABLE 82. REST OF ASIA-PACIFIC HIGH POTENCY APIS MARKET, BY APPLICATION, 2021-2031 ($MILLION)
    TABLE 83. REST OF ASIA-PACIFIC HIGH POTENCY APIS MARKET, BY TYPE OF SYNTHESIS, 2021-2031 ($MILLION)
    TABLE 84. LAMEA HIGH POTENCY APIS MARKET, BY PRODUCT TYPE, 2021-2031 ($MILLION)
    TABLE 85. LAMEA HIGH POTENCY APIS MARKET, BY APPLICATION, 2021-2031 ($MILLION)
    TABLE 86. LAMEA HIGH POTENCY APIS MARKET, BY TYPE OF SYNTHESIS, 2021-2031 ($MILLION)
    TABLE 87. LAMEA BIOTECH HIGH POTENCY APIS MARKET, BY TYPE, 2021-2031 ($MILLION)
    TABLE 88. LAMEA HIGH POTENCY APIS MARKET, BY COUNTRY, 2021-2031 ($MILLION)
    TABLE 89. BRAZIL HIGH POTENCY APIS MARKET, BY PRODUCT TYPE, 2021-2031 ($MILLION)
    TABLE 90. BRAZIL HIGH POTENCY APIS MARKET, BY APPLICATION, 2021-2031 ($MILLION)
    TABLE 91. BRAZIL HIGH POTENCY APIS MARKET, BY TYPE OF SYNTHESIS, 2021-2031 ($MILLION)
    TABLE 92. SAUDI ARABIA HIGH POTENCY APIS MARKET, BY PRODUCT TYPE, 2021-2031 ($MILLION)
    TABLE 93. SAUDI ARABIA HIGH POTENCY APIS MARKET, BY APPLICATION, 2021-2031 ($MILLION)
    TABLE 94. SAUDI ARABIA HIGH POTENCY APIS MARKET, BY TYPE OF SYNTHESIS, 2021-2031 ($MILLION)
    TABLE 95. SOUTH AFRICA HIGH POTENCY APIS MARKET, BY PRODUCT TYPE, 2021-2031 ($MILLION)
    TABLE 96. SOUTH AFRICA HIGH POTENCY APIS MARKET, BY APPLICATION, 2021-2031 ($MILLION)
    TABLE 97. SOUTH AFRICA HIGH POTENCY APIS MARKET, BY TYPE OF SYNTHESIS, 2021-2031 ($MILLION)
    TABLE 98. REST OF LAMEA HIGH POTENCY APIS MARKET, BY PRODUCT TYPE, 2021-2031 ($MILLION)
    TABLE 99. REST OF LAMEA HIGH POTENCY APIS MARKET, BY APPLICATION, 2021-2031 ($MILLION)
    TABLE 100. REST OF LAMEA HIGH POTENCY APIS MARKET, BY TYPE OF SYNTHESIS, 2021-2031 ($MILLION)
    TABLE 101.ABBVIE INC.: COMPANY SNAPSHOT
    TABLE 102.ABBVIE INC.: OPERATING SEGMENTS
    TABLE 103.ABBVIE INC.: PRODUCT PORTFOLIO
    TABLE 104.ABBVIE INC.: NET SALES,
    TABLE 105.ABBVIE INC.: KEY STRATERGIES
    TABLE 106.BAYER AG: COMPANY SNAPSHOT
    TABLE 107.BAYER AG: OPERATING SEGMENTS
    TABLE 108.BAYER AG: PRODUCT PORTFOLIO
    TABLE 109.BAYER AG: NET SALES,
    TABLE 110.BAYER AG: KEY STRATERGIES
    TABLE 111.BOEHRINGER INGELHEIM INTERNATIONAL GMBH: COMPANY SNAPSHOT
    TABLE 112.BOEHRINGER INGELHEIM INTERNATIONAL GMBH: OPERATING SEGMENTS
    TABLE 113.BOEHRINGER INGELHEIM INTERNATIONAL GMBH: PRODUCT PORTFOLIO
    TABLE 114.BOEHRINGER INGELHEIM INTERNATIONAL GMBH: NET SALES,
    TABLE 115.BOEHRINGER INGELHEIM INTERNATIONAL GMBH: KEY STRATERGIES
    TABLE 116.BRISTOL-MYERS SQUIBB COMPANY: COMPANY SNAPSHOT
    TABLE 117.BRISTOL-MYERS SQUIBB COMPANY: OPERATING SEGMENTS
    TABLE 118.BRISTOL-MYERS SQUIBB COMPANY: PRODUCT PORTFOLIO
    TABLE 119.BRISTOL-MYERS SQUIBB COMPANY: NET SALES,
    TABLE 120.BRISTOL-MYERS SQUIBB COMPANY: KEY STRATERGIES
    TABLE 121.ELI LILLY AND COMPANY: COMPANY SNAPSHOT
    TABLE 122.ELI LILLY AND COMPANY: OPERATING SEGMENTS
    TABLE 123.ELI LILLY AND COMPANY: PRODUCT PORTFOLIO
    TABLE 124.ELI LILLY AND COMPANY: NET SALES,
    TABLE 125.ELI LILLY AND COMPANY: KEY STRATERGIES
    TABLE 126.F. HOFFMANN-LA ROCHE: COMPANY SNAPSHOT
    TABLE 127.F. HOFFMANN-LA ROCHE: OPERATING SEGMENTS
    TABLE 128.F. HOFFMANN-LA ROCHE: PRODUCT PORTFOLIO
    TABLE 129.F. HOFFMANN-LA ROCHE: NET SALES,
    TABLE 130.F. HOFFMANN-LA ROCHE: KEY STRATERGIES
    TABLE 131.NOVARTIS INTERNATIONAL AG: COMPANY SNAPSHOT
    TABLE 132.NOVARTIS INTERNATIONAL AG: OPERATING SEGMENTS
    TABLE 133.NOVARTIS INTERNATIONAL AG: PRODUCT PORTFOLIO
    TABLE 134.NOVARTIS INTERNATIONAL AG: NET SALES,
    TABLE 135.NOVARTIS INTERNATIONAL AG: KEY STRATERGIES
    TABLE 136.PFIZER, INC.: COMPANY SNAPSHOT
    TABLE 137.PFIZER, INC.: OPERATING SEGMENTS
    TABLE 138.PFIZER, INC.: PRODUCT PORTFOLIO
    TABLE 139.PFIZER, INC.: NET SALES,
    TABLE 140.PFIZER, INC.: KEY STRATERGIES
    TABLE 141.SANOFI: COMPANY SNAPSHOT
    TABLE 142.SANOFI: OPERATING SEGMENTS
    TABLE 143.SANOFI: PRODUCT PORTFOLIO
    TABLE 144.SANOFI: NET SALES,
    TABLE 145.SANOFI: KEY STRATERGIES
    TABLE 146.TEVA PHARMACEUTICAL INDUSTRIES LTD.: COMPANY SNAPSHOT
    TABLE 147.TEVA PHARMACEUTICAL INDUSTRIES LTD.: OPERATING SEGMENTS
    TABLE 148.TEVA PHARMACEUTICAL INDUSTRIES LTD.: PRODUCT PORTFOLIO
    TABLE 149.TEVA PHARMACEUTICAL INDUSTRIES LTD.: NET SALES,
    TABLE 150.TEVA PHARMACEUTICAL INDUSTRIES LTD.: KEY STRATERGIES
  • LIST OF FIGURES

  • FIGURE 1.HIGH POTENCY APIS MARKET SEGMENTATION
    FIGURE 2.HIGH POTENCY APIS MARKET,2021-2031
    FIGURE 3.HIGH POTENCY APIS MARKET,2021-2031
    FIGURE 4. TOP INVESTMENT POCKETS, BY REGION
    FIGURE 5.PORTER FIVE-1
    FIGURE 6.PORTER FIVE-2
    FIGURE 7.PORTER FIVE-3
    FIGURE 8.PORTER FIVE-4
    FIGURE 9.PORTER FIVE-5
    FIGURE 10.TOP PLAYER POSITIONING
    FIGURE 11.HIGH POTENCY APIS MARKET:DRIVERS, RESTRAINTS AND OPPORTUNITIES
    FIGURE 12.PATENT ANALYSIS BY COMPANY
    FIGURE 13.PATENT ANALYSIS BY COUNTRY
    FIGURE 14.HIGH POTENCY APIS MARKET,BY PRODUCT TYPE,2021(%)
    FIGURE 15.COMPARATIVE SHARE ANALYSIS OF INNOVATIVE HIGH-POTENCY API HIGH POTENCY APIS MARKET,2021-2031(%)
    FIGURE 16.COMPARATIVE SHARE ANALYSIS OF GENERIC HIGH-POTENCY API HIGH POTENCY APIS MARKET,2021-2031(%)
    FIGURE 17.HIGH POTENCY APIS MARKET,BY APPLICATION,2021(%)
    FIGURE 18.COMPARATIVE SHARE ANALYSIS OF ONCOLOGY HIGH POTENCY APIS MARKET,2021-2031(%)
    FIGURE 19.COMPARATIVE SHARE ANALYSIS OF HORMONAL IMBALANCE HIGH POTENCY APIS MARKET,2021-2031(%)
    FIGURE 20.COMPARATIVE SHARE ANALYSIS OF GLAUCOMA HIGH POTENCY APIS MARKET,2021-2031(%)
    FIGURE 21.COMPARATIVE SHARE ANALYSIS OF OTHERS HIGH POTENCY APIS MARKET,2021-2031(%)
    FIGURE 22.HIGH POTENCY APIS MARKET,BY TYPE OF SYNTHESIS,2021(%)
    FIGURE 23.COMPARATIVE SHARE ANALYSIS OF SYNTHETIC HIGH POTENCY APIS MARKET,2021-2031(%)
    FIGURE 24.COMPARATIVE SHARE ANALYSIS OF BIOTECH HIGH POTENCY APIS MARKET,2021-2031(%)
    FIGURE 25.HIGH POTENCY APIS MARKET BY REGION,2021
    FIGURE 26.U.S. HIGH POTENCY APIS MARKET,2021-2031($MILLION)
    FIGURE 27.CANADA HIGH POTENCY APIS MARKET,2021-2031($MILLION)
    FIGURE 28.MEXICO HIGH POTENCY APIS MARKET,2021-2031($MILLION)
    FIGURE 29.GERMANY HIGH POTENCY APIS MARKET,2021-2031($MILLION)
    FIGURE 30.FRANCE HIGH POTENCY APIS MARKET,2021-2031($MILLION)
    FIGURE 31.UK HIGH POTENCY APIS MARKET,2021-2031($MILLION)
    FIGURE 32.ITALY HIGH POTENCY APIS MARKET,2021-2031($MILLION)
    FIGURE 33.SPAIN HIGH POTENCY APIS MARKET,2021-2031($MILLION)
    FIGURE 34.REST OF EUROPE HIGH POTENCY APIS MARKET,2021-2031($MILLION)
    FIGURE 35.JAPAN HIGH POTENCY APIS MARKET,2021-2031($MILLION)
    FIGURE 36.CHINA HIGH POTENCY APIS MARKET,2021-2031($MILLION)
    FIGURE 37.AUSTRALIA HIGH POTENCY APIS MARKET,2021-2031($MILLION)
    FIGURE 38.INDIA HIGH POTENCY APIS MARKET,2021-2031($MILLION)
    FIGURE 39.SOUTH KOREA HIGH POTENCY APIS MARKET,2021-2031($MILLION)
    FIGURE 40.REST OF ASIA-PACIFIC HIGH POTENCY APIS MARKET,2021-2031($MILLION)
    FIGURE 41.BRAZIL HIGH POTENCY APIS MARKET,2021-2031($MILLION)
    FIGURE 42.SAUDI ARABIA HIGH POTENCY APIS MARKET,2021-2031($MILLION)
    FIGURE 43.SOUTH AFRICA HIGH POTENCY APIS MARKET,2021-2031($MILLION)
    FIGURE 44.REST OF LAMEA HIGH POTENCY APIS MARKET,2021-2031($MILLION)
    FIGURE 45. TOP WINNING STRATEGIES, BY YEAR
    FIGURE 46. TOP WINNING STRATEGIES, BY DEVELOPMENT
    FIGURE 47. TOP WINNING STRATEGIES, BY COMPANY
    FIGURE 48.PRODUCT MAPPING OF TOP 10 PLAYERS
    FIGURE 49.COMPETITIVE DASHBOARD
    FIGURE 50.COMPETITIVE HEATMAP OF TOP 10 KEY PLAYERS
    FIGURE 51.ABBVIE INC..: NET SALES ,($MILLION)
    FIGURE 52.BAYER AG.: NET SALES ,($MILLION)
    FIGURE 53.BOEHRINGER INGELHEIM INTERNATIONAL GMBH.: NET SALES ,($MILLION)
    FIGURE 54.BRISTOL-MYERS SQUIBB COMPANY.: NET SALES ,($MILLION)
    FIGURE 55.ELI LILLY AND COMPANY.: NET SALES ,($MILLION)
    FIGURE 56.F. HOFFMANN-LA ROCHE.: NET SALES ,($MILLION)
    FIGURE 57.NOVARTIS INTERNATIONAL AG.: NET SALES ,($MILLION)
    FIGURE 58.PFIZER, INC..: NET SALES ,($MILLION)
    FIGURE 59.SANOFI.: NET SALES ,($MILLION)
    FIGURE 60.TEVA PHARMACEUTICAL INDUSTRIES LTD..: NET SALES ,($MILLION)


This section provides various opinions of top-level CXOs in the high potency APIs market. The high potency APIs market has piqued the interest of healthcare providers, patients, and consumers, owing to several benefits offered by these products which helps the medical practitioner to treat the serious illness efficient rate. There have been remarkable advancements in development of high potency APIs market to provide advanced options for cancer and other diseases. As the market is saturated and is growing at a steady rate in developed nations, Asia-Pacific and LAMEA are expected to offer high growth opportunities to key players in this market.

According to the perspectives of CXOs of leading companies in the market, significant advancements in the manufacturing of the high potent APIs with increase in clinically backed research, rise in investments, funds, and grants, surge in incidence of target diseases, entry of new players, and growth in the diseased population are projected to increase the sale of high potency APIs market globally. In addition, COVID-19 has a negative as well as positive impact on the market, wherein the pandemic led to high demand for the potent APIs along as well as affected the export and import of APIs around the globe.

PURCHASE OPTIONS

Call or Email us

U.S.-Canada Toll-free: +1-800-792-5285
Int'l : +1-503-894-6022
Europe : +44-845-528-1300
Email : help@alliedmarketresearch.com
 
FREQUENTLY ASKED QUESTIONS?

A. Advancements in HPAPI manufacturing technologies along with the rise in the number of contract manufacturing organization (CMOs) and contract development and manufacturing organization (CDMOs) are the upcoming trends of High Potency APIs Market.

A. Oncology is the leading application of High Potency APIs Market.

A. North America is the largest regional market for High Potency APIs.

A. High Potency APIs market is projected to reach $41,373.34 million by 2031, registering a CAGR of 7.7% from 2022 to 2031.

A. The major companies profiled in this report include Abbvie Inc., Bayer AG, Boehringer Ingelheim International GmbH, Bristol-Myers Squibb, Eli Lilly and Company, F. Hoffmann-La Roche Ltd, Novartis AG, Pfizer Inc., Sanofi, and Teva Pharmaceutical Industries Ltd.

A. The base year is 2021 in High Potency APIs market.

A. Yes, the High Potency APIs market report provides PORTER Analysis.

Looking for Customization?

 Customization Request

Have a Question?

 Speak with Analyst

Any Confusion?

 Inquire Before Buying

Have a glance of the Report

  Request Sample
RELATED TAGS

Purchase Full Report of
High Potency Apis Market

Start reading instantly.
This Report and over 67,068+ more Reports, Available with Avenue Library. T&C*.

  • Online Only
  • $3,840
  • Online cloud access only
  • Restricted print, copy, paste & download
  • Read only
  • Free industry update
    (Within 180 days)
  • Free report update in next update cycle
    (Oct 2023 - Oct 2024)
  • Data Pack
  • $4,380
  • Restricted to one authorized user
  • One print only
  • Available in
    Excel
  • Free industry update
    (Within 180 days)
  •   Free report update in next update cycle
    (Oct 2023 - Oct 2024)
  • Single User
  • $6,090
  • Restricted to one authorized user
  • One print only
  • Available in
    PDF
  • Free industry update
    (Within 180 days)
  •   Free report update in next update cycle
    (Oct 2023 - Oct 2024)
  • Five Users
  • $6,630
  • Limited to five authorized users
  • Print upto five copies
  • Available in
    PDF
  • Free industry update
    (Within 180 days)
  •   Free report update in next update cycle
    (Oct 2023 - Oct 2024)
  • Enterprise
    License/PDF

  • $10,500
  • Unlimited
    within
    company/enterprise
  • Available in Excel & PDF
  • Free industry update
    (Within 180 days)
  •   Free report update in next update cycle
    (Oct 2023 - Oct 2024)
  • Library
    Membership

  • $999 $ 1,175
    Per User/ Per month/ Billed annually
  • Published Content
    E-access
  • Company Profiles
    E-access
  • Newly Added Content Access
  • 10 PDF
    Downloads
  • 5 Excel Data
    Pack Downloads
  • 250 Company Profiles PDF Downloads
  • Buy Now

*Taxes/Fees, if applicable will be added during checkout. All prices in USD

RELATED REPORTS
 

Why Allied Market Research?


Infallible Methodology

To ensure high-level data integrity, accurate analysis, and impeccable forecasts

Analyst Support

For complete satisfaction

Customization

On-demand customization of scope of the report to exactly meet your needs

TARGETED MARKET VIEW

Targeted market view to provide pertinent information and save time of readers

Get fresh content delivered

Get insights on topics that are crucial for your business. Stay abreast of your interest areas.

Get Industry Data Alerts

Why Allied Market Research?

Infallible Methodology

To ensure high-level data integrity, accurate analysis, and impeccable forecasts

Analyst Support

For complete satisfaction

Customization

On-demand customization of scope of the report to exactly meet your needs

TARGETED MARKET VIEW

Targeted market view to provide pertinent information and save time of readers