
High-Pressure Pumps Market Outlook - 2030
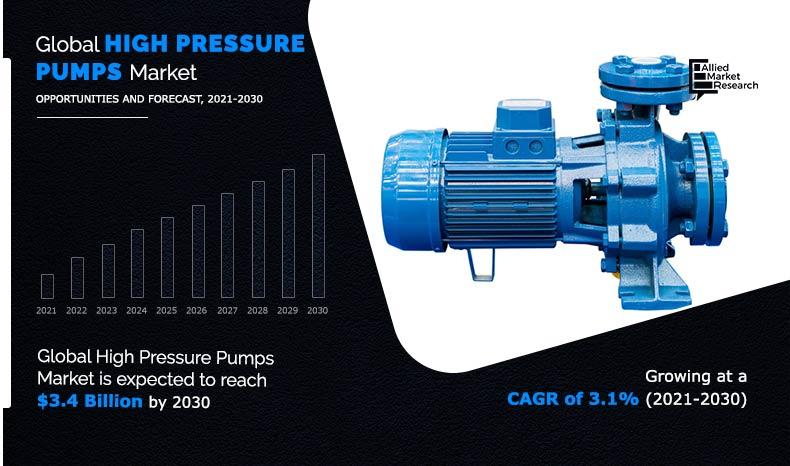
The global high-pressure pumps market was valued at $2.5 billion in 2020, and is projected to reach $3.4 billion by 2030, growing at a CAGR of 3.1% from 2021 to 2030.
High-pressure pumps are designed to bear pressure more than normal pressure. Selection of pump depends on available space, type of liquid to be pumped, and its volatility and limit up-to which the liquid may contain solids.
The global demand for high-pressure pumps market is primarily driven by rise in investments in the oil & gas industry. According to the India Brand Equity Foundation (IBEF) Report, Oil and Natural Gas Corporation (ONGC) has invested $2,730.0 million on drilling oil and gas wells from 2018-2019. Hence, owing to surge in oil & gas exploration activities across the globe, demand for high-pressure pumps is anticipated to surge significantly during the forecast period. In addition, according to the India Brand Equity Foundation (IBEF) Report, automobile production increased at a CAGR of 7.08% CAGR from 2013–2018, with 29.07 million vehicles built in the country in 2108. From April 2018 to January 2019, automobile production increased by 9.84% year-on-year to reach 26.26 million vehicle units. This is expected to drive the growth of high-pressure pumps market as this would increase demand for high-pressure pumps from automotive industry to compress fuels at high-pressure injection in automobiles.
However, slowdown in the oil & gas industry is expected to hamper growth of the high-pressure pumps market during the forecast period. Furthermore, wide-scale adoption of carbon capture and storage (CCS) services is expected to provide growth opportunities for the market during the forecast period.
The global high-pressure pumps market size is segmented on the basis of type, pressure, end-use industry, and region. By type, it is analyzed across dynamic and positive displacement. By pressure, it is segmented into 30 Bar to 100 Bar, 101 bar –500 bar, and above 500 Bar. By end-use industry, it is divided into oil & gas, power generation, manufacturing industries, chemical & pharmaceuticals, and others. Region-wise, it is studied across North America, Europe, Asia-Pacific, and LAMEA.
The major key players operating in the global high-pressure pumps industry include Cat Pumps, Maximator GmbH, Andritz, GEA Group, Grundfos, Sulzer Ltd., The Weir Group PLC, KSB SE & Co., Danfoss, and Hammelmann. Other players operating in this market include Teledyne Isco, Zhejiang Danau Industries Co., Ltd., and Udor S.P.A.
Global High-pressure Pumps Market, By Region
Asia-Pacific accounted for a major market share in 2020, owing to huge economic growth, which has resulted in development of industrial infrastructure. Industrial infrastructure in the region is witnessing growth with policy level focus on driving the industrial sector. Most countries in Asia-Pacific are in its growing phase and high rate of population growth has led to rise in demand for various manufactured items such as food, textile, steel, and electricity. Majority demand for high-pressure pumps is coming from China and India, owing to rapid economic growth and increase in population is expected to drive growth of the market during the forecast period. In addition, investments in India in refining and petrochemicals industries are expected to pave a way for the high-pressure pump market in India. Refining capacity of India grew to 22495.43 TMT in March 2019, an increase of 6.51% from March 2018. Refining capacity of China is also on the rise, with a recent contract for 1 MTA ethylene and refinery expansion project of Sinochem Quanzhou Petrochemical. Most countries in Asia-Pacific have positive outlook pertaining to industries such as manufacturing sector, steel industry, and oil & gas, which, in turn, are expected to drive demand for high-pressure pumps during the forecast period.
By Region
Asia-Pacific would exhibit an CAGR of 3.5% during 2021-2030
Global High-pressure Pumps Market, By Type
The dynamic segment accounted for a major share in the high-pressure pumps market in 2020, owing to their increased applications in various industries due to their ability to generate different flow rates and cost-effective adoption. In addition, chemical manufacturers who need to create high-pressure, use a series of dynamic pumps to reduce cost of equipment in different chemical processes. Growing manufacturing, chemical & pharmaceuticals, oil & gas industries across developing economies such as China, India, and Brazil are anticipated to surge demand for dynamic high-pressure pumps during the forecast period.
By Type
Positive Displacement is projected as the most lucrative segment.
Global High-pressure Pumps Market, By Pressure
The 30 Bar to 100 Bar segment accounted for a major share in the high-pressure pumps market in 2020 as manufacturing industries are using a series of these pumps to generate high-pressure, owing to their low-space requirement, low-cost, and easy installation and maintenance. Owing to increase in foreign direct investments and rapid industrialization across developing economies such as China, India, and Brazil, have led to surge in setting up of various manufacturing or production units of various industrial verticals such as chemical, pharmaceutical, steel, and automotive across these countries. It is attributed to availability of raw materials and laborers at lower prices. Hence, owing to growth in the manufacturing industry across these developing economies, demand for high-pressure pumps is expected to surge significantly during the forecast period.
By Pressure
30 Bar–100 Bar is projected as the most lucrative segment.
Global High-pressure Pumps Market, By End-use Industry
The oil & gas industry accounted for a major high-pressure pumps market share in 2020, owing to adoption of several types of high-pressure pumps such as electric submersible pumps, helico-axial pumps, deep well pumps, progressive cavity pumps, and twin-screw pumps in exploration, production, and transportation activities.
By End-use Industry
Oil & Gas is projected as the most lucrative segment.
COVID-19 analysis:
- According to the International Monetary Fund (IMF), owing to the outbreak of novel coronavirus (COVID-19), the global economy shrunk by 3.0% in 2020. Many countries are under strict lockdowns, which have forced several sectors to shut down their operations. This has halted manufacturing activities and reduced the demand and production of high-pressure pumps.
- According to the United Nations Industrial Development Organization (UNIDO), the Micro, Small & Medium Enterprises (MSME) sector across developing economies, such as India, has been worst affected due to the COVID-19 outbreak and the lockdown imposed thereafter. This is expected to decline the demand for high-pressure pumps from various end-use industries such as building & construction, automotive, and paints & coatings. In addition, in the second half of 2020, some countries started to lift restrictions and gradually start business operations in various sectors. Even with the gradual lifting of the lockdown, it is expected to be challenging for the manufacturing sector to get back to normal working conditions. This is expected to subsequently affect the high-pressure pumps market growth in the coming years.
- According to the UNIDO, 30.0%–70.0% of pre-COVID-19 workforce of various manufacturing industries, such as steel and chemical have migrated back to their hometowns due to uncertainties and loss of income during the lockdown. This non-availability or less availability of workforce is expected to directly affect production activities of these industries, thereby resulting in decline in demand for high-pressure pumps. This is expected to decline growth of the market during the forecast period.
Key benefits for stakeholders
- The global high-pressure pumps market analysis covers in-depth information of major industry participants.
- Porter’s five forces analysis help analyze potential of buyers & suppliers and the competitive scenario of the industry for strategy building.
- Major countries have been mapped according to their individual revenue contribution to the regional market.
- The report provides in-depth analysis of the global high-pressure pumps market forecast for the period 2021–2030.
- The report outlines the current global high-pressure pumps market trends and future scenario of the global high pressure pumps market from 2020 to 2030 to understand the prevailing opportunities and potential investment pockets.
- Key drivers, restraints, & opportunities and their detailed impact analysis are explained in the global high-pressure pumps market study.
Key market segments
By Type
- Dynamic
- Positive Displacement
By Pressure
- 30 Bar to 100 Bar
- 101 Bar to 500 Bar
- Above 500 Bar
By End-Use Industry
- Oil & Gas
- Power Generation
- Manufacturing Industries
- Chemical & Pharmaceuticals
- Others
By Region
- North America
- U.S.
- Canada
- Mexico
- Europe
- Germany
- France
- Italy
- Spain
- UK
- Rest of Europe
- Asia-Pacific
- China
- Japan
- South Korea
- India
- Australia
- Rest of Asia-Pacific
- LAMEA
- Brazil
- Saudi Arabia
- South Africa
- Rest of LAMEA
High-Pressure Pumps Market Report Highlights
| Aspects | Details |
| By TYPE |
|
| By PRESSURE |
|
| By END-USE INDUSTRY |
|
| By Region |
|
| Key Market Players | SULZER LTD., GRUNDFOS, CAT PUMPS, ANDRITZ, MAXIMATOR GMBH, DANFOSS, HAMMELMANN, The Weir Group PLC, KSB SE & CO., GEA GROUP |
Analyst Review
According to the analyst, the global high-pressure pumps market is anticipated to witness growth during the forecast period, driven by rise in investments in oil & gas and manufacturing industries. The oil & gas industry witnessed a marginal recovery in 2018, and is expected to maintain stable crude oil prices during the forecast period. Stable crude oil prices are expected to increase and incentivize investments in E&P activities by E&P companies, causing an extensive usage of dynamic and positive displacement of pumps to explore and process crude oil and natural gas. Furthermore, rise in demand for manufacturing automobiles, polymers, and construction products in the Asia-Pacific is also expected to drive growth of the market during the forecast period.
However, slowdown in the oil & gas industry is expected to hamper growth of the high-pressure pumps market during the forecast period. Furthermore, wide-scale adoption of carbon capture and storage (CCS) services is expected to provide growth opportunities for the high-pressure pumps market during the forecast period.
Asia-Pacific region will provide more business opportunities for high-pressure pumps in future.
Industrial manufacturing units and oil & gas companies across the globe are the potential customers of high-pressure pumps industry.
To get latest version of high-pressure pumps market report can be obtained on demand from the website.
CAT Pumps, Maximator GmbH, Andritz, GEA Group, Grundfos, Sulzer Ltd., The Weir Group PLC, KSB SE & Co., Danfoss, and Hammelmann are the leading global players in the high-pressure pumps market.
Contracts & agreements with other companies, business expansion, new product development, and mergers & acquisitions are the key growth strategies of high-pressure pumps market players.
The top ten market players are selected based on two key attributes - competitive strength and market positioning
Investments in sectors other than oil & gas in the Middle East region, growth of manufacturing sector in Asia-Pacific region, and wide-scale adoption of carbon capture and storage (CCS) services are the driving factors and opportunities in the high-pressure pumps market.
Dynamic high-pressure pumps, 30 Bar to 100 Bar pressure pumps, oil & gas industry holds the maximum share of the high-pressure pumps market.
The global high-pressure pumps market was valued at $2.5 billion in 2020, and is projected to reach $3.4 billion by 2030, growing at a CAGR of 3.1% from 2021 to 2030.
The global high-pressure pumps market analysis covers in-depth information of major industry participants, Porter’s five forces analysis help analyze potential of buyers & suppliers and the competitive scenario of the industry for strategy building, major countries have been mapped according to their individual revenue contribution to the regional market, the report provides in-depth analysis of the global high-pressure pumps market forecast for the period 2021–2030, the report outlines the current global high-pressure pumps market trends and future scenario of the global high-pressure pumps market from 2020 to 2030 to understand the prevailing opportunities and potential investment pockets, and key drivers, restraints, & opportunities and their detailed impact analysis are explained in the global high-pressure pumps market study.
Loading Table Of Content...

