
Home Automation Market Overview
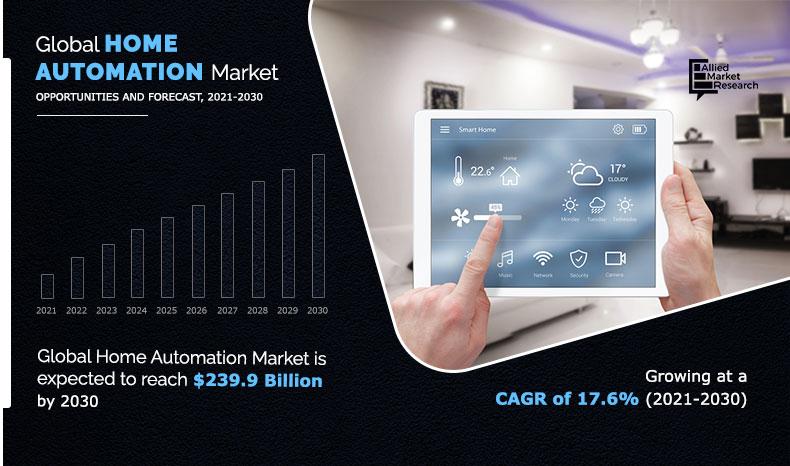
The Home Automation Market Size was valued at $46,607.1 million in 2020, and is expected to reach $239,897.8 million by 2030, registering a CAGR of 17.6% from 2021 to 2030. The market is growing primarily due to increased awareness of energy-efficient products. Continuous advancements in home automation technology, along with the rising adoption of smart devices, are further driving market expansion and consumer demand for smarter, more efficient living environments.
Market Dynamics & Insights
- The home automation industry in Asia-Pacific held a significant share of over 38.2% in 2020.
- The home automation industry in UK is expected to grow significantly at a CAGR of 16.6% from 2021 to 2030
- By application, safety & security segment is one of the dominating segments in the market and accounted for the revenue share of over 39% in 2020.
- By end-user, the commercial segment is the fastest growing segment in the market.
Market Size & Future Outlook
- 2020 Market Size: $46.6 Billion
- 2030 Projected Market Size: $239.8 Billion
- CAGR (2021-2030): 17.6%
- Asia-Pacific: Largest market in 2020
- LAMEA: Fastest growing market
What is Meant by Home Automation
Home automation is utilization of intelligent terminals to control home appliances and equipment. It includes but is not limited to centralized control of lighting, security checks/locks for home access, HVAC control, and others. Home automation is also known as smart home automation, which is an automation system, which offers access to control appliances and devices such as lights, fan, alarm system, heating & cooling systems, and electrical outlets with a smartphone.
Home automation involves incorporating devices into homes to automate and alter diverse household operations like lighting fixtures, HVAC, security, and media & entertainment system. It empowers owners to remotely monitor and manage those features via smartphones or computers, enhancing comfort, power efficiency, and security. By interconnecting devices and sensors, domestic automation streamlines each day tasks and comfortably.
Home Automation Market Dynamics
Rising interest in immersive entertainment drives the adoption of domestic automation. Consumers desire seamless integration of audiovisual structures, gaming consoles, and streaming gadgets for home entertainment. Home automation allows clean customization and control of these systems, enabling users to adjust lights, temperature, and audiovisual settings to suit of preferences. Integration with voice assistants and phone controls enhances convenience and enriches the entertainment experience. As a result, the growing demand for enriched entertainment popularizing home automation market solutions.
The ageing population also presents a fantastic opportunity for development opportunities for home automation technologies designed specifically for elderly users. Therefore, there is a need for a person continuing to live independently but at the same time in safe and comfortable environment. Home automation provide this goal through providing features like remote monitoring, fall detection sensors, medicinal drug reminders, and emergency response system. These technologies not only bolster safety however also offer reassurance to elderly people and their caregivers.
Moreover, domestic automation can streamline each day activities such as adjusting lighting, temperature, and entertainment structures, catering to changes in mobility and cognition related to growing old. By addressing the specific requirements of seniors, home automation answers have the capability to elevate their lifestyles, foster independence, and allow them to continue living comfortably in their own homes for an extended period.
An automated home provides numerous benefits to end-users, such as reduced energy spending, security from theft, and protection from unauthorized access to the home. The solutions are gaining popularity in the residential and hospitality sectors, to protect their personal and commercial assets such as buildings, hardware infrastructures, personal belongings, and others.
The Home Automation Market is driven by the increase in demand for energy-efficient solutions, substantial growth in the IoT market, convenience & ease of usage, technological advancements, increase in number of smartphone users, and surge in security concerns. The market experiences limitations due to excessive cost of automated homes and lack of awareness in some developing & under-developed regions. Increase in adoption of automated services and government incentives for green initiatives is opportunistic for the home automation market growth. Moreover, the need for energy-efficient solutions and rise in demand for safety & security for homes are the major factors that are expected to boost the demand for home automation market.
Furthermore, during the outbreak of the COVID-19 pandemic, construction, manufacturing, hotel, and tourism industries were majorly affected. Manufacturing activities were halted or restricted. Construction and transportation activities, along with their supply chains, were hampered on a global level.
This led to decline in manufacturing of home automation as well as their demand in the market, thereby restraining the growth of the home automation market. Conversely, industries are gradually resuming their regular manufacturing and services. This is expected to lead to re-initiation of home automation companies at their full-scale capacities, which is expected to help the home automation market to recover by mid of 2022.
By Application
Safety & security segment holds the largest share in home automation market
Home Automation Market Segmental Overview
The home automation market is segmented on the basis of, application, technology end user, and region. By application, the market is segregated into lighting, safety & security, HVAC, entertainment and others. On the basis of technology, the market is divided into wired and wireless. On the basis of end user, the market is divided into residential and commercial.
On the contrary, introduction of various plans and automation modules by key market players to cater to the increase in customer demands is anticipated to provide lucrative opportunities for the home automation market. For example, in March 2019, Johnson Controls developed a new version of the SMART Equipment Control Firmware. Its features include continuous reset single zone control, which offers energy savings and precise control of space comfort.
Region wise, it is analyzed across North America (the U.S., Canada, and Mexico), Europe (Germany, France, UK, Italy, and rest of Europe), Asia-Pacific (China, Japan, South Korea, India, and rest of Asia-Pacific), and LAMEA (Latin America, the Middle East, and Africa).
By Technology
Wireless segment holds dominant position in 2020
On the basis of application, in 2020, the safety & security segment dominated the home automation market, in terms of revenue, whereas the others segment is expected to witness growth at the highest CAGR during the forecast period.
On the basis of technology, in 2020, the wireless segment dominated the home automation market and is expected to witness growth at the highest CAGR during the forecast period. Depending on end user, the residential segment led the market in 2020, in terms of revenue.
Whereas, the commercial segment is anticipated to exhibit the highest CAGR in the coming years. Region wise, Asia-Pacific garnered the highest revenue in 2020; however, LAMEA is anticipated to register highest CAGR during the forecast period.
Competition Analysis
The major players profiled in the home automation market include ABB, ADT, Creston Electronics, Inc., Honeywell International Inc., Ingresoll Rand, Johnson Controls, Larsen & Toubro Ltd., Legrand, Samsung Electronics Co., Ltd. and Schneider Electric. Major companies in the market have adopted product launch, business expansion and acquisition as their key developmental strategies to offer better products and services to customers in the home automation market.
By Region
Asia-Pacific holds a dominant position in 2020 and LAMEA is expected to grow at a highest rate during the forecast period.
What are the Key Benefits for Stakeholders
- The report provides an extensive analysis of the current trends, future estimations, and dynamics of the home automation market.
- In-depth home automation market analysis is conducted by estimations for the key segments between 2021 and 2030.
- Extensive analysis of the market is conducted by following key product positioning and monitoring of top competitors within the market framework.
- A comprehensive analysis of four major regions is provided to determine the prevailing opportunities.
- The home automation market forecast analysis from 2021 to 2030 is included in the report.
- The key market players operating in the home automation market are profiled in this report and their strategies are analyzed thoroughly, which help to understand the competitive outlook of the home automation industry.
Home Automation Market Report Highlights
| Aspects | Details |
| By APPLICATION |
|
| By TECHNOLOGY |
|
| By END USER |
|
| By Region |
|
| Key Market Players | ABB, Honeywell International Inc., Creston Electronics, Inc., Ingresoll Rand, ADT, Samsung Electronics Co., Ltd., Larsen & Toubro Ltd., Legrand, Johnson Controls, Schneider Electric |
Analyst Review
Home automation systems are network-based device control solutions which use various components, such as occupancy sensors, transmitters, and receivers, for controlling the installed devices in the house. The control systems offer various advantages such as maximum energy savings, while adhering to building codes and complying with green building and energy conservation programs. Automated systems such as intelligent lighting systems, conditioning & thermostat controls, and smart locks & security monitoring systems are widely used in residential, hospitality, and institutional areas. Reduced energy consumption is one of the major advantages of using automated systems. Automated lighting control systems analyze different scenarios, such as occupancy, availability of daylight, and time of day to control lighting. The security systems work with sensors and remote control & monitoring systems.
Another vital development in the home automation industry is the increase in usage of IoT and smartphones. The home automation market is expected to grow globally due to rise in disposable income and increase in demand for end products which are energy-efficient.
The Home Automation Market was valued at $46.6 billion in 2020 and is projected to reach $239.9 billion by 2030, growing at a CAGR of 17.6% from 2021 to 2030.
The Home Automation Market involves the use of intelligent terminals to control home appliances and equipment, including centralized control of lighting, security systems, HVAC, and more, enhancing convenience, energy efficiency, and security.
Prominent companies in the Home Automation Market include Google LLC (Alphabet), Honeywell Corporation, Inc., Amazon.com Inc., Schneider Electric SE, Johnson Controls International plc, ABB Ltd., Legrand SA, Panasonic Corporation, Samsung Electronics Co Ltd, and General Electric.
North America held the largest share of the Home Automation Market, driven by the development of wireless technology and the increase in the construction of smart cities.
Key drivers include the rising demand for convenience, increased awareness of energy conservation, advancements in communication technology, and the growing adoption of smart home devices.
Challenges include the high initial costs of installation, lack of interoperability between devices from different manufacturers, and concerns regarding data privacy and security.
Loading Table Of Content...

