
Homeland Security Market Research, 2033
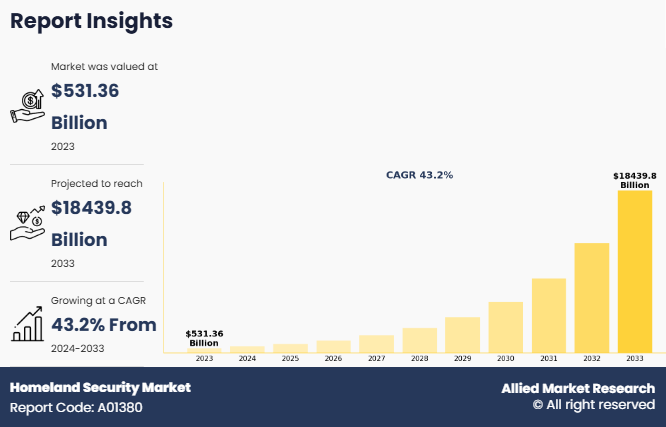
The global homeland security market was valued at $531.4 billion in 2023, and is projected to reach $18439.8 billion by 2033, growing at a CAGR of 43.2% from 2024 to 2033.
Report Key Highlighters:
The homeland security market study covers 14 countries. The research includes regional and segment analysis of each country in terms of value for the projected period.
The study integrated high-quality data, professional opinions and analysis, and critical independent perspectives. The research approach is intended to provide a balanced view of global markets and to assist stakeholders in making educated decisions in order to achieve their most ambitious growth objectives.
Over 3,700 product literature, annual reports, industry statements, and other comparable materials from major industry participants were reviewed to gain a better understanding of the market.
The homeland security market share is highly fragmented, into several players including ELBIT SYSTEMS LTD, Northrop Grumman Corporation, Lockheed Martin Corporation, General Dynamics Corporation, Thales Group, L3Harris Technologies, Inc., Science Applications International Corporation (SAIC), IBM, Leonardo S.p.A, and Unisys Corporation. These companies have adopted strategies such as product launches, contracts, expansions, agreements, and others to improve their market positioning.
Homeland security industry refers to coordinated effort to safeguard a country's territory, population, and critical infrastructure from threats and hazards. It includes a wide range of policies, strategies, and operations aimed at preventing and responding to natural disasters, terrorism, cyberattacks, pandemics, and other significant threats to national security. Homeland security also includes safeguarding from potential catastrophes like earthquakes, floods, storms, as well as human threats such as terrorism, illegal arms trade, cyberattacks, drug trafficking, and more. Homeland security ensures public welfare, enforces laws, secures borders and transportation networks, defends digital infrastructure, and includes other critical goals.
The global homeland security market is driven by government initiatives to protect nation from cross border disputes and civil wars, rise in security threats from increasing terrorism, cybercrimes, cross-border infiltration incidents globally, and growing investment by governments. However, factors such as privacy issues, ethical concerns related to pervasive monitoring posing public acceptance barriers, and high implementation cost hinder the growth of the market. On the contrary technological advancements in surveillance, biometric identification, and imaging systems, and rise in adoption of cloud-based applications are expected to offer lucrative homeland security market opportunities .
Countries around the world face significant safety threats from hazards such as breaches along borders, violent attacks, and cyber infiltration. Mitigating these risks requires substantial investments in advanced technologies, including biometrics, visual inspection tools, and crisis response systems. Despite these challenges, domestic security infrastructure receives considerable government funding annually. This funding supports initiatives such as intelligent monitoring capabilities, enhanced protection for transportation hubs, and the safeguarding of federal digital networks and data.
For example, in October 2023, BlackBerry Limited, a provider of intelligent security software and services, was awarded a license by the U.S. Department of Homeland Security (DHS) to provide a new service. Under this contract, the development and maintenance of the Super Enterprise for Personnel Emergency Notification System (PENS) is ensured. The agreement includes DHS and all its components, with BlackBerry collaborating with American Systems and 4 Points Technology to fulfil the software and service requirements.
Key Developments in the Homeland Security Market
Leading companies are adopting strategies such as acquisition, agreement, expansion, partnership, contracts, and product launches to strengthen their market position.
On December 13, 2023, Northrop Grumman Corporation announced its agreement with the Defense Intelligence Agency (DIA) for a $700 million contract offer to supply integrated cloud and sensor solutions for faster warfighter intelligence. Northrop Grumman Corporation will implement leading-edge solutions to develop and meet the needs of the rapidly changing intelligence environment.
On October 31, 2023, General Dynamics Corporation signed a $712 million contract with the U.S. Department of Homeland Security’s (DHS) St. Elizabeths Campus. Under this contract, General Dynamics Corporation will provide modern day infrastructure solutions that meets networking, telecommunications, cybersecurity, operations and preservation, and logistics guide offerings. According to the contract, General Dynamic Corporation will provide cybersecurity, technology refresh, operations and maintenance, and logistics support services.
On 28, June 2023, General Dynamics Corporation signed two contracts of $580 million with the Intelligence & Homeland Security Division to provide full-spectrum cybersecurity and software development services. Through this contract, it expands its intelligence and homeland security portfolio in cybersecurity, artificial intelligence, cloud, and high-performance computing.
Segmental Analysis
The homeland security market size is segmented into type, technology, end user, and region. By type, the market is analyzed into border security, aviation security, maritime security, critical infrastructure security, cyber security, mass transport security, law enforcement, CBRN security, and others. On the basis of technology, the market is fragmented into recognition and surveillance systems, AI-based solutions, security platforms, and others. By end user, the market is analyzed into public sector and private sector. Region-wise, the market is analyzed across North America, Europe, Asia-Pacific, Latin America, and Middle East and Africa.
By Type
On the basis of type, the market is segmented into border security, aviation security, maritime security, critical infrastructure security, cyber security, mass transport security, law enforcement, CBRN security, and others. The border security segment accounted for the largest market share in 2023, owing to preventing of illegal activities such as immigration control, drug and human trafficking. Moreover, economic disparities, growing conflicts, and climate change have led to rise in migration flows across borders. The growing investment in border control solutions helps in tackling issues related to illegal migration, human trafficking and other issues.

By Technology
Based on technology, the market is segregated into recognition and surveillance systems, AI-based solutions, security platforms, and others. The recognition and surveillance systems accounted for the largest market share in 2023, as they are critical for detecting, monitoring, and preventing threats in real-time. Additionally, they are deployed in various environments, such as in urban areas, transportation hubs, and remote border regions.

By End User
On the basis of end user, the market is analyzed into public sector and private sector. The public sector segment accounted for the largest market share in 2023, owing to growing investment by governments globally for the development of smarter border security infrastructure integrated with technologies like biometrics, 3D scanning, and intuitive access control systems.

By Region
On the basis of region, the homeland security market forecast is segregated into North America, Europe, Asia-Pacific, Middle East and Africa, and Latin America. North America accounted for the largest market share in 2023, owing to the presence of U.S, Canada and Mexico, which are investing heavily in homeland security. Additionally, the region is also a home to leading technology companies and defense sectors, including Lockheed Martin, Raytheon, Northrop Grumman, and so on, which are developing cutting-edge solutions related to surveillance, cybersecurity, and threat detection. Additionally, the U.S. is investing heavily in the development of security tech, such as biometrics, emergency response systems, surveillance system and border control technology to track down and eliminate illegal border crossing.

Rise in security Threats Owing to Increasing Terrorism, Cybercrimes, Cross-Border Infiltration Incidents Globally
Over the past decade, threats to domestic security and public safety have increased across countries globally due to exponential rise in terror incidents, cyber-attacks, transnational organized crimes, and illegal border trespasses. These require immediate technology capability advancements by law enforcement and border control agencies through targeted homeland security infrastructure investments into areas like surveillance systems and inspection technologies.
Furthermore, mass migration and immigration have been triggered by increasing civil conflict in some volatile regions. Additionally, there is increase in undocumented asylum seekers, which is further expanding challenge for border forces needing enhanced perimeter security coverage, identification capabilities and temporary detention facilities setup to manage the crises. These rising internal and external risk factors are collectively necessitating priority policy attention and budgets allocation centered on homeland security reinforcement.
Governments globally are actively engaged in detecting and addressing country wide threats and enforcing strategies to protect nations from security risks. For instance, in September 2023, the Department of Homeland Security (DHS) published the 2024 Homeland Threat Assessment (HTA), which informs a high risk of both foreign and domestic terrorism in 2024. This evaluation targets to provide the public and the Department's companions a complete report on the most massive threats to the U.S. It is a part of the Biden Administration's ongoing commitment to assisting in training for, prevention of, and response to the constantly evolving and various threat environments. Such instances further support homeland security market demand.
Technological Advancements in Surveillance, Biometric Identification, Imaging Systems
Recent technological advances in automation, analytics, and navigation solutions have significantly improved the performance of homeland security forces. In domains such as real-time detection, identity verification, and physical security, these technologies have established new performance benchmarks. By using these tools, security forces can more easily accomplish their goals, which makes the country safer and more effective.
For example, modern analytical algorithms are capable of sorting through huge amounts of CCTV footage data and automatically identifying doubtful human behaviors, vehicle movements, and immediately alerting operators to take necessary measures. When dealing with dense crowds, AI-ML models can accurately identify individuals based only upon facial biometrics. Radar vision allows investigating through walls to identify hidden weapons. Reliance on manual monitoring is essentially eliminated by smart sensor networks riding connected IoT models.
In addition, many governments are adopting AI technologies to improve the accuracy of security systems. For instance, in September 2023, the U.S. Department of Homeland Security (DHS) revealed new policies concerning the utilization and procurement of artificial intelligence (AI) technologies, which focus on facial recognition and face capture technologies. These regulations establish directions for the branch's exploration of leveraging AI to improve crucial missions and growing defenses towards potential malicious makes use of AI by way of adversaries. Such developments are expected to propel the growth of the market.
Privacy Issues, Ethical Concerns Related to Pervasive Monitoring Posing Public Acceptance Barriers
The adoption of mass surveillance technologies like facial recognition, predictive analytics software, drone monitoring for bolstering homeland security raises complex privacy and ethical challenges causing public acceptance issues. There are growing concerns regarding unregulated government tracking of innocent civilians without reasonable cause or obtaining proper consent. Suspicions persist around potential misuse of captured information for purposes beyond just public safety like targeted advertising or suppression of political dissenters. The details of how certain advanced AI surveillance tools are deployed are unclear. with opacity over how algorithmic processing determines suspicious behavioral 'risk scores' for individuals resulting in possible profiling biases and overreach.
Key Benefits for Stakeholders
This report provides a quantitative analysis of the market segments, current trends, estimations, and dynamics of the homeland security market analysis from 2023 to 2033 to identify the prevailing homeland security market opportunities.
The market research is offered along with information related to key drivers, restraints, and opportunities.
Porter's five forces analysis highlights the potency of buyers and suppliers to enable stakeholders make profit-oriented business decisions and strengthen their supplier-buyer network.
In-depth analysis of the market segmentation assists to determine the prevailing market opportunities.
Major countries in each region are mapped according to their revenue contribution to the global homeland security market growth.
Market player positioning facilitates benchmarking and provides a clear understanding of the present position of the market players.
The report includes the analysis of the regional as well as global homeland security market trends, key players, market segments, application areas, and homeland security industry growth strategies.
Homeland Security Market Report Highlights
| Aspects | Details |
| Market Size By 2033 | USD 18.4 trillion |
| Growth Rate | CAGR of 43.2% |
| Forecast period | 2023 - 2033 |
| Report Pages | 280 |
| By End User |
|
| By Type |
|
| By Technology |
|
| By Region |
|
| Key Market Players | ELBIT SYSTEMS LTD., IBM, Leonardo S.p.A., Science Applications International Corporation (SAIC), Northrop Grumman Corporation., L3Harris Technologies, Inc., Thales Group, Lockheed Martin Corporation, General Dynamics Corporation, Unisys Corporation |
Analyst Review
Homeland security serves the function of defending nations from natural and human-made threats such as floods, earthquakes, landslides, smuggling, terrorist attacks, cyber frauds, and others. Homeland security safeguards the public and property of nations. The cyber security market offers technologies and processes for the protection of valuable data and information on computers, servers, cloud, and computing networks. There has been a growing dependence of various sectors, such as e-commerce, defense & military, IT & telecom, manufacturing, and government, on digital infrastructure. Confidential and critical data and information is stored on virtual platform, which require better, reliable, secured, and well-managed network infrastructure. Increasing threat of computer hacking, virus attacks, terrorist activities through virtual media, and online payment frauds are expected to boost the market growth for cyber security during the forecast period. For instance, the annual budget of the U.S. Government for cyber security is $19 billion in 2017 as compared to $14 billion budgeted in 2016, an increase of 35%. Several advanced products and services including identity management and access (IAM) system, antivirus software, data loss prevention (DLP) software, unified threat management (UTM) appliances, Internet network firewall, and data breach detection software are offered in the cyber security market for protecting network infrastructure.
High installation cost and lack of skilled workforce for execution of products, services, and systems offered by the homeland security market restrict the growth of the market. However, advancements in biotechnology, nanotechnology, robotics technology, and portable unmanned vehicles used in aerial, underwater & ground transportation, communication, cloud computing, and others are expected to transform the homeland security market. Leading players have collaborated with other companies to enhance their product portfolios to increase their market potential in terms of geographical and customer base. North America is the leading revenue contributor to the global market, due to increasing investment in military and defense sector in the region. In the near future, Asia-Pacific is expected to grow rapidly, owing to frequent incidents of terrorist attacks, cross border, and civil wars.
Integration of AI and machine learning are the upcoming trend in the homeland security market.
Border security is the leading application of homeland security market.
North America is the largest region for homeland security market.
The homeland security market was valued at $531.36 billion in 2023.
ELBIT SYSTEMS LTD, Northrop Grumman Corporation, Lockheed Martin Corporation are some of the major companies operating in the market.
Loading Table Of Content...
Loading Research Methodology...

