0
2022
Honeycomb Paper Market

Honeycomb Paper Market

by Core Type (Expanded Paper Honeycomb, Expanded Paper Honeycomb Blocks Paper Honeycomb, Continuous Paper Honeycomb, Others), by Cell Size (Upto 10 mm, 10 to 30 mm, Above 30 mm), by End-use Industry (Home Decor, Transport and Logistics, Automotive, Building and Construction, Others): Global Opportunity Analysis and Industry Forecast, 2020-2030

Report Code: A11829
Apr 2022 | Pages: 309
Tables: NA
Charts: 57
  • Formats*:

  • pdf

    Single User License, Five User
    License & Enterprise User License

  • xls

    Data Pack Excel License

  • ppt

    It comes with the additional cost
    of $2500.00 contact sales.


Honeycomb Paper Market Research, 2030

The global honeycomb paper market was valued at $6.5 billion in 2020, and is projected to reach $11.0 billion by 2030, growing at a CAGR of 5.4% from 2021 to 2030.

Honeycomb is a type of structure that can be found in nature or is created artificially. Honeycomb paper is sandwiched between two thin sheets to create honeycomb packaging materials. Honeycomb paper panels, honeycomb paper core, honeycomb paper pallets, and honeycomb paper boards are a few products that are available in the market.                 
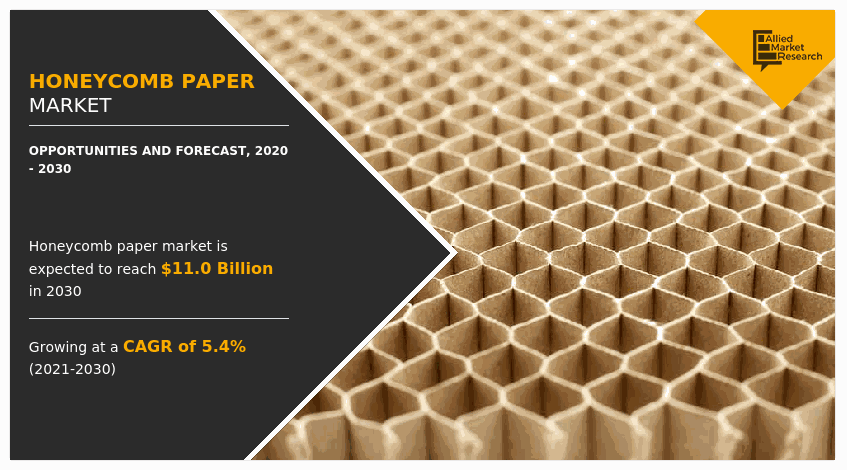
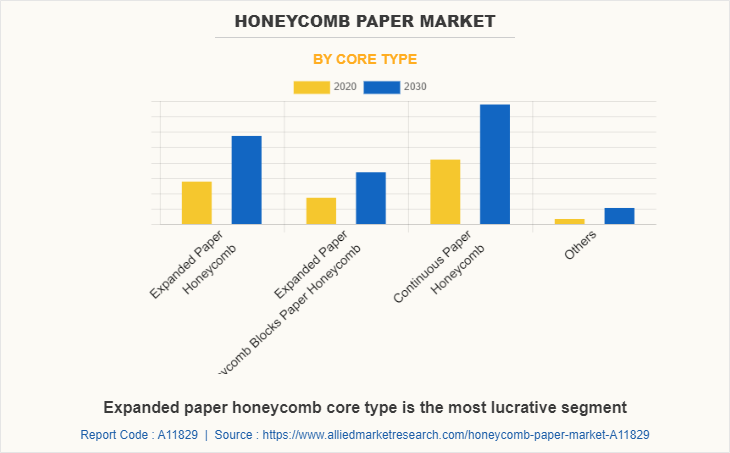
Expanded paper honeycomb (EPH) is a type of paper honeycomb that is expanded and de-moisturized and then cut to size pieces of paper honeycomb. This type of paper honeycomb is used as a core-filling material in applications such as interior doors, partition walls, and automotive components. Factors such as high pressure strength, improved deformation properties, and 100% recyclable, makes paper honeycomb a widely used product as a core material and a sandwich material between the facings of softwood, hardboard plywood, plasterboard, and others. Expanded paper honeycomb is a handy and cost-effective product used as a core filling material in interior doors. In addition, it can also be used as a core material for flat surfaced and molded interior doors. Use of expanded paper honeycomb as a substitute over traditional filling materials such as solid fillings, chipboard stripes and tube board in interior doors and partition walls, is driving its demand in the global market. In addition, block paper honeycombs are low-cost and versatile core materials that are used in applications such as doors, partition walls, and automotive. Deforming properties, high pressure strength, and ability to adapt to any shape makes block paper honeycomb viable to be used in diverse applications serving to building & construction, protective packaging, and transport & logistic end-use industries All these factors collectively surge the demand for honeycomb paper, thereby augmenting the global market growth.

However, minimal breakage resistance & folding resistance, susceptible to puncture, and poor processing performance of paper honeycomb paperboard limit the application of honeycomb paper in certain end-use industries, which is expected to hamper the market growth.

On the contrary, paper honeycomb pallets are a widely used and preferred product for air shipments owing to their low weight and durability. In addition, honeycomb paper pallets added with water resistance coatings can be used during sea shipments. Transport & logistic end-users require solid and high strength support material for increasing their storage capability and protective packaging during transportation. Moreover, reduced weight of packaging material further contributes toward increasing profit. Light weight and strength of honeycomb paper makes it viable to be used in the transport and logistical end-use industry. In addition, hygienic production process followed during production of honeycomb paper makes it ideal during transport and packaging of food and pharmaceutical products. Key-players in the honeycomb pallets market are engaged in the production of paper pallets for transport and logistics that are approved and designed by EURO standards, provide additional support that comes into play during forklifting of packed products, and ability to lift the packaged products in four ways. Transport & logistic end-use industry includes transport and shipment of electronic gadgets & products, automobile spare parts, and other industrial control units. Honeycomb paper edge protectors and corners are widely used to safeguard goods during transportation. This factor is anticipated to offer new growth opportunities during the forecast period.

The honeycomb paper market is segmented on the basis of core type, cell size, end-use industry, and region. On the basis of core type, the market is categorized into expanded paper honeycomb, blocks paper honeycomb, continuous paper honeycomb, and others. By cell size, the global honeycomb paper market is classified into up to 10mm, 10-30 mm, and above 30 mm. The end-use industries covered in the report include home decor, transport & logistics, automotive, building & construction, and others. Region wise, the market is studied across North America, Europe, Asia-Pacific, and LAMEA.
The major companies profiled in this report include Lsquare Eco-Products Pvt. Ltd. (Honecore), EcoGlobe Packaging Private Limited (EcoGlobe), Greencore Packaging, Crown Holdings Inc., Schütz GmbH & Co. KGaA, Honicel Nederland B.V., Axxor, YOJ Pack-Kraft (YOJ), Helios Packaging, and Macpack.

Honeycomb Paper Market

Source: AMR Analysis

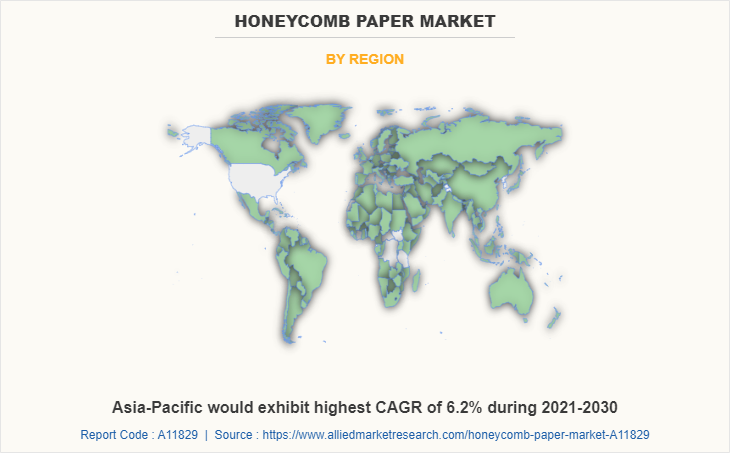
The Asia-Pacific honeycomb paper market accounted for 43.2% of the market share in 2020, and is projected to grow at the highest CAGR of 6.2% during the forecast period. Paper honeycomb panels are used in home décor applications such as portable sofas and other furniture products. Strength-to-weight ratio and stiffness of paper honeycomb makes it an ideal product to be used in the home décor end-use industry. China home décor sector is gaining importance owing to rise in demand and adoption of eco-friendly products. In addition, key-players in the home décor industry are adopting innovative yet versatile products.
Honeycomb Paper Market

Source: AMR Analysis

In 2020, the continuous paper honeycomb core type was the largest revenue generator, and is anticipated to grow at a CAGR of 5.4% during the forecast period. Use of continuous paper honeycomb in automotive applications such as trunk plates and hat boards is the key market trend. In addition, it can also be used in applications such as desks, shelves, wardrobe sliding doors, cabinet carcass, and kitchen worktops drive the demand of the global market.
Honeycomb Paper Market

Source: AMR Analysis

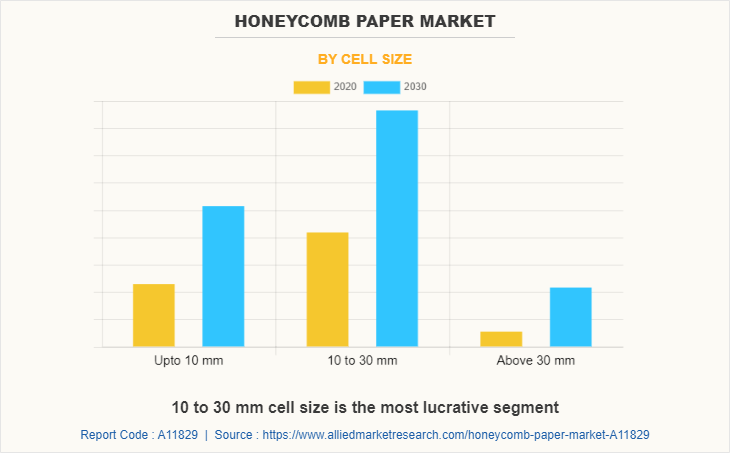
The 10-30 mm cell size segment accounted for 47% of the market share in 2020, and is projected to grow at the highest CAGR of 5.6% during the forecast period. Honeycomb paper cell size ranging from 10 mm to 30 mm is used in doors lined with ply, high density fiberboard (HDF), flush, skin and sliding doors. Generally, standard cell size of 15 mm, 21 mm, and 28 mm are widely preferred by furniture manufacturers, architecture designers, transport & logistics industry, and automotive manufacturers.
Honeycomb Paper Market

Source: AMR Analysis

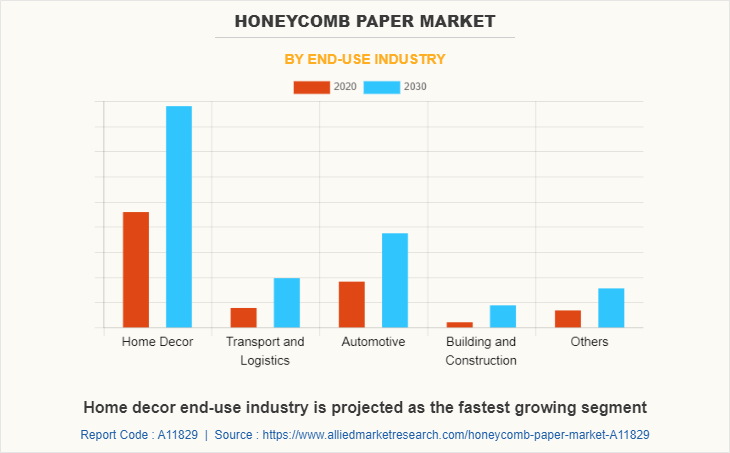
By end-use industry, the home decor end-use industry dominated the global market in 2020, and is anticipated to grow at a CAGR of 5.8% during the forecast period. Paper honeycomb core is widely adopted for wide home décor applications such as interior doors and interior furniture products is the key market trend. In addition, high strength ratio of honeycomb core materials make them an ideal substitute over other traditional chipboard strips and tube boards for home décor applications. Honeycomb core materials serve the purpose of low-cost and firm filling material for production of furniture sandwich panels and help to reduce the overall weight without compromising the aesthetic look and durability of the furniture.

The honeycomb paper market has been negatively impacted due to the wake of COVID-19 pandemic, owing to its dependence on building & construction, automotive & transportation, home decor, aerospace, and other sectors. According to International Labour Organization (ILO), falling revenue and increasing project delivery challenges in the construction industry have led to the sector’s contraction in most markets across the globe.

IMPACT OF COVID-19 ON THE GLOBAL HONEYCOMB PAPER MARKET

  • The novel coronavirus is an incomparable global pandemic that has spread to over 180 countries and caused huge losses of lives and the economy around the globe.
  • The honeycomb paper market has been negatively impacted due to the wake of COVID-19 pandemic, owing to its dependence on building & construction, automotive & transportation, home decor, aerospace, and other sectors.
  • According to a report published by the Society of Indian Automobile Manufacturers (SIAM) in April 2020, sale of passenger vehicles, commercial vehicles and two‐wheeler vehicles declined by 51%, 88% and 40% respectively in March 2020. Also, several automotive companies have either shutdown or shrank their operations, due to the risk of infections among the workforce where honeycomb paper is used for making spare tire covers, trunk plates, door trim panels, hat boards, and roofing.
  • This has temporarily hampered the demand for the honeycomb paper market amid the COVID-19 period. In addition, the falling income of customers and international travel restrictions have led to contraction of the demand for honeycomb paper among the aerospace sectors. For instance, according to a report published by Airlines for America in October 2020, the commercial airline passenger volume in September 2020 was 68% less than September 2019, affecting long-term existential threat to manufacturers, the supply chain, and to the entire air travel industry.
  • Also, COVID-19 has put a temporary break on various aircraft manufacturing projects, which in turn has reduced the demand for honeycomb paper used in ballistic body armor and as a substitute over asbestos among the aerospace & aviation sectors. In addition, the honeycomb paper market has witnessed a downfall in demand among the construction sectors, owing to temporary halt on various building and construction project amid the COVID-19 period.
  • In 2020, honeycomb paper prices were high in Asia-Pacific region. The price rise was due to continued regional demand trends and tight product availability. Firm downstream demand for honeycomb paper and stronger upstream costs are expected to sustain the price gain.
  • However, increase in awareness for using eco-friendly products among citizens of both developed and developing economies may surge the popularity of honeycomb papers in various end-use sectors post COVID-19 scenario. Furthermore, the building & construction, packaging and transportation activities are projected to get back on track and start functioning with full capacity post COVID-19 period, which in turn may enhance the performance of the honeycomb paper market.

Honeycomb Paper Market, Honeycomb Paper Market Size, Honeycomb Paper Market Share, Honeycomb Paper Market Growth, Honeycomb Paper Market Trend, Honeycomb Paper Market Forecast, -, -, -

Key Benefits For Stakeholders

  • This report provides a quantitative analysis of the market segments, current trends, estimations, and dynamics of the honeycomb paper market analysis from 2020 to 2030 to identify the prevailing honeycomb paper market opportunities.
  • The market research is offered along with information related to key drivers, restraints, and opportunities.
  • Porter's five forces analysis highlights the potency of buyers and suppliers to enable stakeholders make profit-oriented business decisions and strengthen their supplier-buyer network.
  • In-depth analysis of the honeycomb paper market segmentation assists to determine the prevailing market opportunities.
  • Major countries in each region are mapped according to their revenue contribution to the global market.
  • Market player positioning facilitates benchmarking and provides a clear understanding of the present position of the market players.
  • The report includes the analysis of the regional as well as global honeycomb paper market trends, key players, market segments, application areas, and market growth strategies.

Honeycomb Paper Market Report Highlights

Aspects Details
By Core Type
  • Expanded Paper Honeycomb
  • Expanded Paper Honeycomb Blocks Paper Honeycomb
  • Continuous Paper Honeycomb
  • Others
By Cell Size
  • Upto 10 mm
  • 10 to 30 mm
  • Above 30 mm
By End-use Industry
  • Home Decor
  • Transport and Logistics
  • Automotive
  • Building and Construction
  • Others
By Region
  • North America  (U.S., Canada, Mexico)
  • Europe  (Germany, United Kingdom, France, Spain, Italy, Russia, Rest of Europe)
  • Asia-Pacific  (China, India, Japan, South Korea, Australia, Rest of Asia-Pacific)
  • LAMEA  (Brazil, Saudi Arabia, South Africa, Rest of LAMEA)
Key Market Players Crown Holdings Inc., Schütz GmbH & Co. KGaA, Helios Packaging, Lsquare Eco Products Pvt. Ltd., Honicel Nederland B.V., EcoGlobe Packaging Private Limited, Axxor, Greencore Packaging, YOJ Pack-Kraft, MAC PACK
 
  • LIST OF TABLES

  • TABLE 01. HONEYCOMB PAPER MARKET, BY CORE TYPE, 2020-2030 ($ MILLION)
    TABLE 02. HONEYCOMB PAPER MARKET, BY CORE TYPE, 2020-2030 (KILOTONS)
    TABLE 03. HONEYCOMB PAPER MARKET FOR EXPANDED PAPER HONEYCOMB, BY REGION, 2020–2030 ($MILLION)
    TABLE 04. HONEYCOMB PAPER MARKET FOR EXPANDED PAPER HONEYCOMB, BY REGION, 2020–2030 (KILOTONS)
    TABLE 05. HONEYCOMB PAPER MARKET FOR BLOCK PAPER HONEYCOMB, BY REGION, 2020–2030 ($MILLION)
    TABLE 06. HONEYCOMB PAPER MARKET FOR BLOCK PAPER HONEYCOMB, BY REGION, 2020–2030 (KILOTONS)
    TABLE 07. HONEYCOMB PAPER MARKET FOR CONTINUOUS PAPER HONEYCOMB, BY REGION, 2020–2030 ($MILLION)
    TABLE 08. HONEYCOMB PAPER MARKET FOR CONTINUOUS PAPER HONEYCOMB, BY REGION, 2020–2030 (KILOTONS)
    TABLE 09. HONEYCOMB PAPER MARKET FOR OTHERS, BY REGION, 2020–2030 ($MILLION)
    TABLE 10. HONEYCOMB PAPER MARKET FOR OTHERS, BY REGION, 2020–2030 (KILOTONS)
    TABLE 11. HONEYCOMB PAPER MARKET, BY CELL SIZE, 2020-2030 ($ MILLION)
    TABLE 12. HONEYCOMB PAPER MARKET, BY CELL SIZE, 2020-2030 (KILOTONS)
    TABLE 13. HONEYCOMB PAPER MARKET FOR UP TO 10 MM, BY REGION, 2020–2030 ($MILLION)
    TABLE 14. HONEYCOMB PAPER MARKET FOR UP TO 10 MM, BY REGION, 2020–2030 (KILOTONS)
    TABLE 15. HONEYCOMB PAPER MARKET FOR 10-30 MM, BY REGION, 2020–2030 ($MILLION)
    TABLE 16. HONEYCOMB PAPER MARKET FOR 10-30 MM, BY REGION, 2020–2030 (KILOTONS)
    TABLE 17. HONEYCOMB PAPER MARKET FOR ABOVE 30 MM, BY REGION, 2020–2030 ($MILLION)
    TABLE 18. HONEYCOMB PAPER MARKET FOR ABOVE 30 MM, BY REGION, 2020–2030 (KILOTONS)
    TABLE 19. HONEYCOMB PAPER MARKET, BY END-USE INDUSTRY, 2020-2030 ($ MILLION)
    TABLE 20. HONEYCOMB PAPER MARKET, BY END-USE INDUSTRY, 2020-2030 (KILOTONS)
    TABLE 21. HONEYCOMB PAPER MARKET FOR HOME DECOR, BY REGION, 2020–2030 ($MILLION)
    TABLE 22. HONEYCOMB PAPER MARKET FOR HOME DECOR, BY REGION, 2020–2030 (KILOTONS)
    TABLE 23. HONEYCOMB PAPER MARKET FOR TRANSPORT & LOGISTICS, BY REGION, 2020–2030 ($MILLION)
    TABLE 24. HONEYCOMB PAPER MARKET FOR TRANSPORT & LOGISTICS, BY REGION, 2020–2030 (KILOTONS)
    TABLE 25. HONEYCOMB PAPER MARKET FOR AUTOMOTIVE, BY REGION, 2020–2030 ($MILLION)
    TABLE 26. HONEYCOMB PAPER MARKET FOR AUTOMOTIVE, BY REGION, 2020–2030 (KILOTONS)
    TABLE 27. HONEYCOMB PAPER MARKET FOR BUILDING & CONSTRUCTION, BY REGION, 2020–2030 ($MILLION)
    TABLE 28. HONEYCOMB PAPER MARKET FOR BUILDING & CONSTRUCTION, BY REGION, 2020–2030 (KILOTONS)
    TABLE 29. HONEYCOMB PAPER MARKET FOR OTHERS, BY REGION, 2020–2030 ($MILLION)
    TABLE 30. HONEYCOMB PAPER MARKET FOR OTHERS, BY REGION, 2020–2030 (KILOTONS)
    TABLE 31. HONEYCOMB PAPER MARKET, BY REGION, 2020–2030 ($MILLION)
    TABLE 32. HONEYCOMB PAPER MARKET, BY REGION, 2020–2030 (KILOTONS)
    TABLE 33. NORTH AMERICA HONEYCOMB PAPER MARKET, BY CORE TYPE, 2020–2030 ($MILLION)
    TABLE 34. NORTH AMERICA HONEYCOMB PAPER MARKET, BY CORE TYPE, 2020–2030 (KILOTONS)
    TABLE 35. NORTH AMERICA HONEYCOMB PAPER MARKET, BY CELL SIZE, 2020–2030 ($MILLION)
    TABLE 36. NORTH AMERICA HONEYCOMB PAPER MARKET, BY CELL SIZE, 2020–2030 (KILOTONS)
    TABLE 37. NORTH AMERICA HONEYCOMB PAPER MARKET, BY END-USE INDUSTRY, 2020–2030 ($MILLION)
    TABLE 38. NORTH AMERICA HONEYCOMB PAPER MARKET, BY END-USE INDUSTRY, 2020–2030 (KILOTONS)
    TABLE 39. NORTH AMERICA HONEYCOMB PAPER MARKET, BY COUNTRY, 2020–2030 ($MILLION)
    TABLE 40. NORTH AMERICA HONEYCOMB PAPER MARKET, BY COUNTRY, 2020–2030 (KILOTONS)
    TABLE 41. U.S. HONEYCOMB PAPER MARKET, BY CORE TYPE, 2020–2030 ($MILLION)
    TABLE 42. U.S. HONEYCOMB PAPER MARKET, BY CORE TYPE, 2020–2030 (KILOTONS)
    TABLE 43. U.S. HONEYCOMB PAPER MARKET, BY CELL SIZE, 2020–2030 ($MILLION)
    TABLE 44. U.S. HONEYCOMB PAPER MARKET, BY CELL SIZE, 2020–2030 (KILOTONS)
    TABLE 45. U.S. HONEYCOMB PAPER MARKET, BY END-USE INDUSTRY, 2020–2030 ($MILLION)
    TABLE 46. U.S. HONEYCOMB PAPER MARKET, BY END-USE INDUSTRY, 2020–2030 (KILOTONS)
    TABLE 47. CANADA HONEYCOMB PAPER MARKET, BY CORE TYPE, 2020–2030 ($MILLION)
    TABLE 48. CANADA HONEYCOMB PAPER MARKET, BY CORE TYPE, 2020–2030 (KILOTONS)
    TABLE 49. CANADA HONEYCOMB PAPER MARKET, BY CELL SIZE, 2020–2030 ($MILLION)
    TABLE 50. CANADA HONEYCOMB PAPER MARKET, BY CELL SIZE, 2020–2030 (KILOTONS)
    TABLE 51. CANADA HONEYCOMB PAPER MARKET, BY END-USE INDUSTRY, 2020–2030 ($MILLION)
    TABLE 52. CANADA HONEYCOMB PAPER MARKET, BY END-USE INDUSTRY, 2020–2030 (KILOTONS)
    TABLE 53. MEXICO HONEYCOMB PAPER MARKET, BY CORE TYPE, 2020–2030 ($MILLION)
    TABLE 54. MEXICO HONEYCOMB PAPER MARKET, BY CORE TYPE, 2020–2030 (KILOTONS)
    TABLE 55. MEXICO HONEYCOMB PAPER MARKET, BY CELL SIZE, 2020–2030 ($MILLION)
    TABLE 56. MEXICO HONEYCOMB PAPER MARKET, BY CELL SIZE, 2020–2030 (KILOTONS)
    TABLE 57. MEXICO HONEYCOMB PAPER MARKET, BY END-USE INDUSTRY, 2020–2030 ($MILLION)
    TABLE 58. MEXICO HONEYCOMB PAPER MARKET, BY END-USE INDUSTRY, 2020–2030 (KILOTONS)
    TABLE 59. EUROPE HONEYCOMB PAPER MARKET, BY CORE TYPE, 2020–2030 ($MILLION)
    TABLE 60. EUROPE HONEYCOMB PAPER MARKET, BY CORE TYPE, 2020–2030 (KILOTONS)
    TABLE 61. EUROPE HONEYCOMB PAPER MARKET, BY CELL SIZE, 2020–2030 ($MILLION)
    TABLE 62. EUROPE HONEYCOMB PAPER MARKET, BY CELL SIZE, 2020–2030 (KILOTONS)
    TABLE 63. EUROPE HONEYCOMB PAPER MARKET, BY END-USE INDUSTRY, 2020–2030 ($MILLION)
    TABLE 64. EUROPE HONEYCOMB PAPER MARKET, BY END-USE INDUSTRY, 2020–2030 (KILOTONS)
    TABLE 65. EUROPE HONEYCOMB PAPER MARKET, BY COUNTRY, 2020–2030 ($MILLION)
    TABLE 66. EUROPE HONEYCOMB PAPER MARKET, BY COUNTRY, 2020–2030 (KILOTONS)
    TABLE 67. FRANCE HONEYCOMB PAPER MARKET, BY CORE TYPE, 2020–2030 ($MILLION)
    TABLE 68. FRANCE HONEYCOMB PAPER MARKET, BY CORE TYPE, 2020–2030 (KILOTONS)
    TABLE 69. FRANCE HONEYCOMB PAPER MARKET, BY CELL SIZE, 2020–2030 ($MILLION)
    TABLE 70. FRANCE HONEYCOMB PAPER MARKET, BY CELL SIZE, 2020–2030 (KILOTONS)
    TABLE 71. FRANCE HONEYCOMB PAPER MARKET, BY END-USE INDUSTRY, 2020–2030 ($MILLION)
    TABLE 72. FRANCE HONEYCOMB PAPER MARKET, BY END-USE INDUSTRY, 2020–2030 (KILOTONS)
    TABLE 73. GERMANY HONEYCOMB PAPER MARKET, BY CORE TYPE, 2020–2030 ($MILLION)
    TABLE 74. GERMANY HONEYCOMB PAPER MARKET, BY CORE TYPE, 2020–2030 (KILOTONS)
    TABLE 75. GERMANY HONEYCOMB PAPER MARKET, BY CELL SIZE, 2020–2030 ($MILLION)
    TABLE 76. GERMANY HONEYCOMB PAPER MARKET, BY CELL SIZE, 2020–2030 (KILOTONS)
    TABLE 77. GERMANY HONEYCOMB PAPER MARKET, BY END-USE INDUSTRY, 2020–2030 ($MILLION)
    TABLE 78. GERMANY HONEYCOMB PAPER MARKET, BY END-USE INDUSTRY, 2020–2030 (KILOTONS)
    TABLE 79. ITALY HONEYCOMB PAPER MARKET, BY CORE TYPE, 2020–2030 ($MILLION)
    TABLE 80. ITALY HONEYCOMB PAPER MARKET, BY CORE TYPE, 2020–2030 (KILOTONS)
    TABLE 81. ITALY HONEYCOMB PAPER MARKET, BY CELL SIZE, 2020–2030 ($MILLION)
    TABLE 82. ITALY HONEYCOMB PAPER MARKET, BY CELL SIZE, 2020–2030 (KILOTONS)
    TABLE 83. ITALY HONEYCOMB PAPER MARKET, BY END-USE INDUSTRY, 2020–2030 ($MILLION)
    TABLE 84. ITALY HONEYCOMB PAPER MARKET, BY END-USE INDUSTRY, 2020–2030 (KILOTONS)
    TABLE 85. SPAIN HONEYCOMB PAPER MARKET, BY CORE TYPE, 2020–2030 ($MILLION)
    TABLE 86. SPAIN HONEYCOMB PAPER MARKET, BY CORE TYPE, 2020–2030 (KILOTONS)
    TABLE 87. SPAIN HONEYCOMB PAPER MARKET, BY CELL SIZE, 2020–2030 ($MILLION)
    TABLE 88. SPAIN HONEYCOMB PAPER MARKET, BY CELL SIZE, 2020–2030 (KILOTONS)
    TABLE 89. SPAIN HONEYCOMB PAPER MARKET, BY END-USE INDUSTRY, 2020–2030 ($MILLION)
    TABLE 90. SPAIN HONEYCOMB PAPER MARKET, BY END-USE INDUSTRY, 2020–2030 (KILOTONS)
    TABLE 91. UK HONEYCOMB PAPER MARKET, BY CORE TYPE, 2020–2030 ($MILLION)
    TABLE 92. UK HONEYCOMB PAPER MARKET, BY CORE TYPE, 2020–2030 (KILOTONS)
    TABLE 93. UK HONEYCOMB PAPER MARKET, BY CELL SIZE, 2020–2030 ($MILLION)
    TABLE 94. UK HONEYCOMB PAPER MARKET, BY CELL SIZE, 2020–2030 (KILOTONS)
    TABLE 95. UK HONEYCOMB PAPER MARKET, BY END-USE INDUSTRY, 2020–2030 ($MILLION)
    TABLE 96. UK HONEYCOMB PAPER MARKET, BY END-USE INDUSTRY, 2020–2030 (KILOTONS)
    TABLE 97. RUSSIA HONEYCOMB PAPER MARKET, BY CORE TYPE, 2020–2030 ($MILLION)
    TABLE 98. RUSSIA HONEYCOMB PAPER MARKET, BY CORE TYPE, 2020–2030 (KILOTONS)
    TABLE 99. RUSSIA HONEYCOMB PAPER MARKET, BY CELL SIZE, 2020–2030 ($MILLION)
    TABLE 100. RUSSIA HONEYCOMB PAPER MARKET, BY CELL SIZE, 2020–2030 (KILOTONS)
    TABLE 101. RUSSIA HONEYCOMB PAPER MARKET, BY END-USE INDUSTRY, 2020–2030 ($MILLION)
    TABLE 102. RUSSIA HONEYCOMB PAPER MARKET, BY END-USE INDUSTRY, 2020–2030 (KILOTONS)
    TABLE 103. REST OF EUROPE HONEYCOMB PAPER MARKET, BY CORE TYPE, 2020–2030 ($MILLION)
    TABLE 104. REST OF EUROPE HONEYCOMB PAPER MARKET, BY CORE TYPE, 2020–2030 (KILOTONS)
    TABLE 105. REST OF EUROPE HONEYCOMB PAPER MARKET, BY CELL SIZE, 2020–2030 ($MILLION)
    TABLE 106. REST OF EUROPE HONEYCOMB PAPER MARKET, BY CELL SIZE, 2020–2030 (KILOTONS)
    TABLE 107. REST OF EUROPE HONEYCOMB PAPER MARKET, BY END-USE INDUSTRY, 2020–2030 ($MILLION)
    TABLE 108. REST OF EUROPE HONEYCOMB PAPER MARKET, BY END-USE INDUSTRY, 2020–2030 (KILOTONS)
    TABLE 109. ASIA-PACIFIC HONEYCOMB PAPER MARKET, BY CORE TYPE, 2020–2030 ($MILLION)
    TABLE 110. ASIA-PACIFIC HONEYCOMB PAPER MARKET, BY CORE TYPE, 2020–2030 (KILOTONS)
    TABLE 111. ASIA-PACIFIC HONEYCOMB PAPER MARKET, BY CELL SIZE, 2020–2030 ($MILLION)
    TABLE 112. ASIA-PACIFIC HONEYCOMB PAPER MARKET, BY CELL SIZE, 2020–2030 (KILOTONS)
    TABLE 113. ASIA-PACIFIC HONEYCOMB PAPER MARKET, BY END-USE INDUSTRY, 2020–2030 ($MILLION)
    TABLE 114. ASIA-PACIFIC HONEYCOMB PAPER MARKET, BY END-USE INDUSTRY, 2020–2030 (KILOTONS)
    TABLE 115. ASIA-PACIFIC HONEYCOMB PAPER MARKET, BY COUNTRY, 2020–2030 ($MILLION)
    TABLE 116. ASIA-PACIFIC HONEYCOMB PAPER MARKET, BY COUNTRY, 2020–2030 (KILOTONS)
    TABLE 117. CHINA HONEYCOMB PAPER MARKET, BY CORE TYPE, 2020–2030 ($MILLION)
    TABLE 118. CHINA HONEYCOMB PAPER MARKET, BY CORE TYPE, 2020–2030 (KILOTONS)
    TABLE 119. CHINA HONEYCOMB PAPER MARKET, BY CELL SIZE, 2020–2030 ($MILLION)
    TABLE 120. CHINA HONEYCOMB PAPER MARKET, BY CELL SIZE, 2020–2030 (KILOTONS)
    TABLE 121. CHINA HONEYCOMB PAPER MARKET, BY END-USE INDUSTRY, 2020–2030 ($MILLION)
    TABLE 122. CHINA HONEYCOMB PAPER MARKET, BY END-USE INDUSTRY, 2020–2030 (KILOTONS)
    TABLE 123. JAPAN HONEYCOMB PAPER MARKET, BY CORE TYPE, 2020–2030 ($MILLION)
    TABLE 124. JAPAN HONEYCOMB PAPER MARKET, BY CORE TYPE, 2020–2030 (KILOTONS)
    TABLE 125. JAPAN HONEYCOMB PAPER MARKET, BY CELL SIZE, 2020–2030 ($MILLION)
    TABLE 126. JAPAN HONEYCOMB PAPER MARKET, BY CELL SIZE, 2020–2030 (KILOTONS)
    TABLE 127. JAPAN HONEYCOMB PAPER MARKET, BY END-USE INDUSTRY, 2020–2030 ($MILLION)
    TABLE 128. JAPAN HONEYCOMB PAPER MARKET, BY END-USE INDUSTRY, 2020–2030 (KILOTONS)
    TABLE 129. INDIA HONEYCOMB PAPER MARKET, BY CORE TYPE, 2020–2030 ($MILLION)
    TABLE 130. INDIA HONEYCOMB PAPER MARKET, BY CORE TYPE, 2020–2030 (KILOTONS)
    TABLE 131. INDIA HONEYCOMB PAPER MARKET, BY CELL SIZE, 2020–2030 ($MILLION)
    TABLE 132. INDIA HONEYCOMB PAPER MARKET, BY CELL SIZE, 2020–2030 (KILOTONS)
    TABLE 133. INDIA HONEYCOMB PAPER MARKET, BY END-USE INDUSTRY, 2020–2030 ($MILLION)
    TABLE 134. INDIA HONEYCOMB PAPER MARKET, BY END-USE INDUSTRY, 2020–2030 (KILOTONS)
    TABLE 135. SOUTH KOREA HONEYCOMB PAPER MARKET, BY CORE TYPE, 2020–2030 ($MILLION)
    TABLE 136. SOUTH KOREA HONEYCOMB PAPER MARKET, BY CORE TYPE, 2020–2030 (KILOTONS)
    TABLE 137. SOUTH KOREA HONEYCOMB PAPER MARKET, BY CELL SIZE, 2020–2030 ($MILLION)
    TABLE 138. SOUTH KOREA HONEYCOMB PAPER MARKET, BY CELL SIZE, 2020–2030 (KILOTONS)
    TABLE 139. SOUTH KOREA HONEYCOMB PAPER MARKET, BY END-USE INDUSTRY, 2020–2030 ($MILLION)
    TABLE 140. SOUTH KOREA HONEYCOMB PAPER MARKET, BY END-USE INDUSTRY, 2020–2030 (KILOTONS)
    TABLE 141. AUSTRALIA HONEYCOMB PAPER MARKET, BY CORE TYPE, 2020–2030 ($MILLION)
    TABLE 142. AUSTRALIA HONEYCOMB PAPER MARKET, BY CORE TYPE, 2020–2030 (KILOTONS)
    TABLE 143. AUSTRALIA HONEYCOMB PAPER MARKET, BY CELL SIZE, 2020–2030 ($MILLION)
    TABLE 144. AUSTRALIA HONEYCOMB PAPER MARKET, BY CELL SIZE, 2020–2030 (KILOTONS)
    TABLE 145. AUSTRALIA HONEYCOMB PAPER MARKET, BY END-USE INDUSTRY, 2020–2030 ($MILLION)
    TABLE 146. AUSTRALIA HONEYCOMB PAPER MARKET, BY END-USE INDUSTRY, 2020–2030 (KILOTONS)
    TABLE 147. REST OF ASIA-PACIFIC HONEYCOMB PAPER MARKET, BY CORE TYPE, 2020–2030 ($MILLION)
    TABLE 148. REST OF ASIA-PACIFIC HONEYCOMB PAPER MARKET, BY CORE TYPE, 2020–2030 (KILOTONS)
    TABLE 149. REST OF ASIA-PACIFIC HONEYCOMB PAPER MARKET, BY CELL SIZE, 2020–2030 ($MILLION)
    TABLE 150. REST OF EUROPE HONEYCOMB PAPER MARKET, BY CELL SIZE, 2020–2030 (KILOTONS)
    TABLE 151. REST OF EUROPE HONEYCOMB PAPER MARKET, BY END-USE INDUSTRY, 2020–2030 ($MILLION)
    TABLE 152. REST OF EUROPE HONEYCOMB PAPER MARKET, BY END-USE INDUSTRY, 2020–2030 (KILOTONS)
    TABLE 153. LAMEA HONEYCOMB PAPER MARKET, BY CORE TYPE, 2020–2030 ($MILLION)
    TABLE 154. LAMEA HONEYCOMB PAPER MARKET, BY CORE TYPE, 2020–2030 (KILOTONS)
    TABLE 155. LAMEA HONEYCOMB PAPER MARKET, BY CELL SIZE, 2020–2030 ($MILLION)
    TABLE 156. LAMEA HONEYCOMB PAPER MARKET, BY CELL SIZE, 2020–2030 (KILOTONS)
    TABLE 157. LAMEA HONEYCOMB PAPER MARKET, BY END-USE INDUSTRY, 2020–2030 ($MILLION)
    TABLE 158. LAMEA HONEYCOMB PAPER MARKET, BY END-USE INDUSTRY, 2020–2030 (KILOTONS)
    TABLE 159. LAMEA HONEYCOMB PAPER MARKET, BY COUNTRY, 2020–2030 ($MILLION)
    TABLE 160. LAMEA HONEYCOMB PAPER MARKET, BY COUNTRY, 2020–2030 (KILOTONS)
    TABLE 161. BRAZIL HONEYCOMB PAPER MARKET, BY CORE TYPE, 2020–2030 ($MILLION)
    TABLE 162. BRAZIL HONEYCOMB PAPER MARKET, BY CORE TYPE, 2020–2030 (KILOTONS)
    TABLE 163. BRAZIL HONEYCOMB PAPER MARKET, BY CELL SIZE, 2020–2030 ($MILLION)
    TABLE 164. BRAZIL HONEYCOMB PAPER MARKET, BY CELL SIZE, 2020–2030 (KILOTONS)
    TABLE 165. BRAZIL HONEYCOMB PAPER MARKET, BY END-USE INDUSTRY, 2020–2030 ($MILLION)
    TABLE 166. BRAZIL HONEYCOMB PAPER MARKET, BY END-USE INDUSTRY, 2020–2030 (KILOTONS)
    TABLE 167. SAUDI ARABIA HONEYCOMB PAPER MARKET, BY CORE TYPE, 2020–2030 ($MILLION)
    TABLE 168. SAUDI ARABIA HONEYCOMB PAPER MARKET, BY CORE TYPE, 2020–2030 (KILOTONS)
    TABLE 169. SAUDI ARABIA HONEYCOMB PAPER MARKET, BY CELL SIZE, 2020–2030 ($MILLION)
    TABLE 170. SAUDI ARABIA HONEYCOMB PAPER MARKET, BY CELL SIZE, 2020–2030 (KILOTONS)
    TABLE 171. SAUDI ARABIA HONEYCOMB PAPER MARKET, BY END-USE INDUSTRY, 2020–2030 ($MILLION)
    TABLE 172. SAUDI ARABIA HONEYCOMB PAPER MARKET, BY END-USE INDUSTRY, 2020–2030 (KILOTONS)
    TABLE 173. SOUTH AFRICA HONEYCOMB PAPER MARKET, BY CORE TYPE, 2020–2030 ($MILLION)
    TABLE 174. SOUTH AFRICA HONEYCOMB PAPER MARKET, BY CORE TYPE, 2020–2030 (KILOTONS)
    TABLE 175. SOUTH AFRICA HONEYCOMB PAPER MARKET, BY CELL SIZE, 2020–2030 ($MILLION)
    TABLE 176. SOUTH AFRICA HONEYCOMB PAPER MARKET, BY CELL SIZE, 2020–2030 (KILOTONS)
    TABLE 177. SOUTH AFRICA HONEYCOMB PAPER MARKET, BY END-USE INDUSTRY, 2020–2030 ($MILLION)
    TABLE 178. SOUTH AFRICA HONEYCOMB PAPER MARKET, BY END-USE INDUSTRY, 2020–2030 (KILOTONS)
    TABLE 179. REST OF LAMEA HONEYCOMB PAPER MARKET, BY CORE TYPE, 2020–2030 ($MILLION)
    TABLE 180. REST OF LAMEA HONEYCOMB PAPER MARKET, BY CORE TYPE, 2020–2030 (KILOTONS)
    TABLE 181. REST OF LAMEA HONEYCOMB PAPER MARKET, BY CELL SIZE, 2020–2030 ($MILLION)
    TABLE 182. REST OF LAMEA HONEYCOMB PAPER MARKET, BY CELL SIZE, 2020–2030 (KILOTONS)
    TABLE 183. REST OF LAMEA HONEYCOMB PAPER MARKET, BY END-USE INDUSTRY, 2020–2030 ($MILLION)
    TABLE 184. REST OF LAMEA HONEYCOMB PAPER MARKET, BY END-USE INDUSTRY, 2020–2030 (KILOTONS)
    TABLE 185. LSQUARE ECO-PRODUCTS PVT. LTD.: COMPANY SNAPSHOT
    TABLE 186. LSQUARE ECO-PRODUCTS PVT. LTD.: PRODUCT PORTFOLIO
    TABLE 187. ECOGLOBE: COMPANY SNAPSHOT
    TABLE 188. ECOGLOBE: PRODUCT PORTFOLIO
    TABLE 189. GREENCORE PACKAGING: COMPANY SNAPSHOT
    TABLE 190. GREENCORE PACKAGING: PRODUCT PORTFOLIO
    TABLE 191. CROWN HOLDINGS INC.: COMPANY SNAPSHOT
    TABLE 192. CROWN HOLDINGS INC.: OPERATING SEGMENTS
    TABLE 193. CROWN HOLDINGS INC.: PRODUCT PORTFOLIO
    TABLE 194. OVERALL FINANCIAL STATUS ($MILLION)
    TABLE 195. SCHÜTZ GMBH & CO. KGAA: COMPANY SNAPSHOT
    TABLE 196. SCHÜTZ GMBH & CO. KGAA: OPERATING SEGMENTS
    TABLE 197. SCHÜTZ GMBH & CO. KGAA: PRODUCT PORTFOLIO
    TABLE 198. HONICEL NEDERLAND B.V.: COMPANY SNAPSHOT
    TABLE 199. HONICEL NEDERLAND B.V.: PRODUCT PORTFOLIO
    TABLE 200. AXXOR: COMPANY SNAPSHOT
    TABLE 201. AXXOR: PRODUCT PORTFOLIO
    TABLE 202. YOJ: COMPANY SNAPSHOT
    TABLE 203. YOJ: OPERATING SEGMENTS
    TABLE 204. YOJ: PRODUCT PORTFOLIO
    TABLE 205. HELIOS PACKAGING: COMPANY SNAPSHOT
    TABLE 206. HELIOS PACKAGING: PRODUCT PORTFOLIO
    TABLE 207. MACPACK: COMPANY SNAPSHOT
    TABLE 208. MACPACK: PRODUCT PORTFOLIO
  • LIST OF FIGURES

  • FIGURE 01. HONEYCOMB PAPER MARKET SNAPSHOT
    FIGURE 02. HONEYCOMB PAPER MARKET SEGMENTATION
    FIGURE 03. TOP INVESTMENT POCKETS
    FIGURE 04. MODERATE BARGAINING POWER OF SUPPLIERS
    FIGURE 05. MODERATE BARGAINING POWER OF BUYERS
    FIGURE 06. MODERATE THREAT OF NEW ENTRANTS
    FIGURE 07. MODERATE THREAT OF SUBSTITUTES
    FIGURE 08. MODERATE COMPETITIVE RIVALRY
    FIGURE 09. HONEYCOMB PAPER MARKET DYNAMICS
    FIGURE 10. VALUE CHAIN ANALYSIS
    FIGURE 11. HONEYCOMB PAPER MARKET, PRICING ANALYSIS, BY CORE TYPE, USD/TONS
    FIGURE 12. PATENT ANALYSIS, BY COUNTRY, 2012-2021
    FIGURE 13. PATENT ANALYSIS, BY APPLICANT, 2012-2021
    FIGURE 14. PATENT ANALYSIS, BY PUBLICATION DATE, 2012-2021
    FIGURE 15. HONEYCOMB PAPER MARKET, BY CORE TYPE, 2020–2030 ($MILILION)
    FIGURE 16. COMPARATIVE SHARE ANALYSIS OF HONEYCOMB PAPER MARKET FOR EXPANDED PAPER HONEYCOMB, BY COUNTRY, 2020 & 2030 (%)
    FIGURE 17. COMPARATIVE SHARE ANALYSIS OF HONEYCOMB PAPER MARKET FOR BLOCK PAPER HONEYCOMB, BY COUNTRY, 2020 & 2030 (%)
    FIGURE 18. COMPARATIVE SHARE ANALYSIS OF HONEYCOMB PAPER MARKET FOR CONTINUOUS PAPER HONEYCOMB, BY COUNTRY, 2020 & 2030 (%)
    FIGURE 19. COMPARATIVE SHARE ANALYSIS OF HONEYCOMB PAPER MARKET FOR OTHERS, BY COUNTRY, 2020 & 2030 (%)
    FIGURE 20. HONEYCOMB PAPER MARKET, BY CELL SIZE, 2020–2030 ($MILILION)
    FIGURE 21. COMPARATIVE SHARE ANALYSIS OF HONEYCOMB PAPER MARKET FOR UP TO 10 MM, BY COUNTRY, 2020 & 2030 (%)
    FIGURE 22. COMPARATIVE SHARE ANALYSIS OF HONEYCOMB PAPER MARKET FOR 10-30 MM, BY COUNTRY, 2020 & 2030 (%)
    FIGURE 23. COMPARATIVE SHARE ANALYSIS OF HONEYCOMB PAPER MARKET FOR ABOVE 30 MM, BY COUNTRY, 2020 & 2030 (%)
    FIGURE 24. HONEYCOMB PAPER MARKET, BY END-USE INDUSTRY, 2020–2030 ($MILILION)
    FIGURE 25. COMPARATIVE SHARE ANALYSIS OF HONEYCOMB PAPER MARKET FOR HOME DECOR, BY COUNTRY, 2020 & 2030 (%)
    FIGURE 26. COMPARATIVE SHARE ANALYSIS OF HONEYCOMB PAPER MARKET FOR TRANSPORT & LOGISTICS, BY COUNTRY, 2020 & 2030 (%)
    FIGURE 27. COMPARATIVE SHARE ANALYSIS OF HONEYCOMB PAPER MARKET FOR AUTOMOTIVE, BY COUNTRY, 2020 & 2030 (%)
    FIGURE 28. COMPARATIVE SHARE ANALYSIS OF HONEYCOMB PAPER MARKET FOR BUILDING & CONSTRUCTION, BY COUNTRY, 2020 & 2030 (%)
    FIGURE 29. COMPARATIVE SHARE ANALYSIS OF HONEYCOMB PAPER MARKET FOR OTHERS, BY COUNTRY, 2020 & 2030 (%)
    FIGURE 30. HONEYCOMB PAPER MARKET, BY REGION, 2020–2030 ($MILLION)
    FIGURE 31. U.S. HONEYCOMB PAPER MARKET REVENUE, 2020–2030 ($MILLION)
    FIGURE 32. CANADA HONEYCOMB PAPER MARKET REVENUE, 2020–2030 ($MILLION)
    FIGURE 33. MEXICO HONEYCOMB PAPER MARKET REVENUE, 2020–2030 ($MILLION)
    FIGURE 34. FRANCE HONEYCOMB PAPER MARKET REVENUE, 2020–2030 ($MILLION)
    FIGURE 35. GERMANY HONEYCOMB PAPER MARKET REVENUE, 2020–2030 ($MILLION)
    FIGURE 36. ITALY HONEYCOMB PAPER MARKET REVENUE, 2020–2030 ($MILLION)
    FIGURE 37. SPAIN HONEYCOMB PAPER MARKET REVENUE, 2020–2030 ($MILLION)
    FIGURE 38. UK HONEYCOMB PAPER MARKET REVENUE, 2020–2030 ($MILLION)
    FIGURE 39. RUSSIA HONEYCOMB PAPER MARKET REVENUE, 2020–2030 ($MILLION)
    FIGURE 40. REST OF EUROPE HONEYCOMB PAPER MARKET REVENUE, 2020–2030 ($MILLION)
    FIGURE 41. CHINA HONEYCOMB PAPER MARKET REVENUE, 2020–2030 ($MILLION)
    FIGURE 42. JAPAN HONEYCOMB PAPER MARKET REVENUE, 2020–2030 ($MILLION)
    FIGURE 43. INDIA HONEYCOMB PAPER MARKET REVENUE, 2020–2030 ($MILLION)
    FIGURE 44. SOUTH KOREA HONEYCOMB PAPER MARKET REVENUE, 2020–2030 ($MILLION)
    FIGURE 45. AUSTRALIA HONEYCOMB PAPER MARKET REVENUE, 2020–2030 ($MILLION)
    FIGURE 46. REST OF ASIA-PACIFIC HONEYCOMB PAPER MARKET REVENUE, 2020–2030 ($MILLION)
    FIGURE 47. BRAZIL HONEYCOMB PAPER MARKET REVENUE, 2020–2030 ($MILLION)
    FIGURE 48. SAUDI ARABIA HONEYCOMB PAPER MARKET REVENUE, 2020–2030 ($MILLION)
    FIGURE 49. SOUTH AFRICA HONEYCOMB PAPER MARKET REVENUE, 2020–2030 ($MILLION)
    FIGURE 50. REST OF LAMEA HONEYCOMB PAPER MARKET REVENUE, 2020–2030 ($MILLION)
    FIGURE 51. MARKET PLAYER POSITIONING, 2021
    FIGURE 52. PRODUCT MAPPING OF TOP 10 PLAYERS
    FIGURE 53. COMPETITIVE HEATMAP OF KEY PLAYERS
    FIGURE 54. LIST OF HONEYCOMB PAPER MANUFACTURERS
    FIGURE 55. CROWN HOLDINGS INC.: REVENUE, 2019–2021 ($MILLION)
    FIGURE 56. CROWN HOLDINGS INC.: REVENUE SHARE BY SEGMENT, 2021 (%)
    FIGURE 57. CROWN HOLDINGS INC.: REVENUE SHARE BY COUNTRY, 2021 (%)


The global honeycomb paper market is expected to exhibit high growth owing to its use in marine, aerospace, healthcare, and food packaging sector. High strength ratio of honeycomb core materials makes them an ideal substitute over other traditional chipboard strips and tube boards for home décor applications. Honeycomb core materials serve the purpose of low-cost and firm filling material for production of furniture sandwich panels and help to reduce the overall weight without compromising the aesthetic look and durability of the furniture. In addition, paper honeycomb furniture is gaining importance owing to portability, cost-effectiveness, easy to assemble, and environment friendly is anticipated to augment the demand for the global honeycomb paper market.

Export certification is of utmost importance during packaging and export of expensive automotive parts. Traditional protective materials require export certification that in turn increases hassle and cost of transport. To overcome this problem, paper honeycombs are used as these do not require any certification and hassle free export activities can be carried out in the international automotive market. This factor is anticipated to offer new growth opportunities during the forecast period.

The increasing expenditure in aerospace sectors for upgrading aircrafts with modern armor facilities where honeycomb paper is used in ballistic body armor and as a substitute over asbestos may fuel the growth of the honeycomb paper market. Moreover, the sales of electronic and home appliances have shown an impressive growth in recent years owing to factors such as increased consumer purchasing power, digitalization, sustainability, consolidation and rise in middle class income. Thus, the use of honeycomb paper boards for protective packaging of electronics and home appliances may create lucrative opportunities for the market.

PURCHASE OPTIONS

Call or Email us

U.S.-Canada Toll-free: +1-800-792-5285
Int'l : +1-503-894-6022
Europe : +44-845-528-1300
Email : help@alliedmarketresearch.com
 
FREQUENTLY ASKED QUESTIONS?

A. The use of continuous paper honeycomb in automotive applications such as trunk plates and hat boards is the key market trend.

A. Paper honeycomb core is widely adopted for wide home décor applications such as interior doors and interior furniture products. In addition, the high strength ratio of honeycomb core materials makes them an ideal substitute for other traditional chipboard strips and tube boards for home décor applications.

A. Asia-Pacific honeycomb paper market accounted for the largest market share in 2020 and is projected to grow at the highest CAGR of 6.2% during the forecast period.

A. The global honeycomb paper market was valued at $6.5 billion in 2020 and is projected to reach $11.0 billion by 2030.

A. The top companies to hold the market share are Lsquare, Eco-Products Pvt. Ltd. (Honecore), EcoGlobe Packaging Private Limited (EcoGlobe), Greencore Packaging, Crown Holdings Inc., Schütz GmbH & Co. KGaA, Honicel Nederland B.V., Axxor, YOJ Pack-Kraft (YOJ), Helios Packaging, Macpack

Looking for Customization?

 Customization Request

Have a Question?

 Speak with Analyst

Any Confusion?

 Inquire Before Buying

Have a glance of the Report

  Request Sample
RELATED TAGS

Purchase Full Report of
Honeycomb Paper Market

Start reading instantly.
This Report and over 66,905+ more Reports, Available with Avenue Library. T&C*.

  • Online Only
  • $3,456
  • Online cloud access only
  • Restricted print, copy, paste & download
  • Read only
  • Free industry update
    (Within 180 days)
  • Free report update in next update cycle
    (Apr 2023 - Apr 2024)
  • Data Pack
  • $3,840
  • Restricted to one authorized user
  • One print only
  • Available in
    Excel
  • Free industry update
    (Within 180 days)
  •   Free report update in next update cycle
    (Apr 2023 - Apr 2024)
  • Single User
  • $5,769
  • Restricted to one authorized user
  • One print only
  • Available in
    PDF
  • Free industry update
    (Within 180 days)
  •   Free report update in next update cycle
    (Apr 2023 - Apr 2024)
  • Five Users
  • $6,450
  • Limited to five authorized users
  • Print upto five copies
  • Available in
    PDF
  • Free industry update
    (Within 180 days)
  •   Free report update in next update cycle
    (Apr 2023 - Apr 2024)
  • Enterprise
    License/PDF

  • $10,995
  • Unlimited
    within
    company/enterprise
  • Available in Excel & PDF
  • Free industry update
    (Within 180 days)
  •   Free report update in next update cycle
    (Apr 2023 - Apr 2024)
  • Library
    Membership

  • $999 $ 1,175
    Per User/ Per month/ Billed annually
  • Published Content
    E-access
  • Company Profiles
    E-access
  • Newly Added Content Access
  • 10 PDF
    Downloads
  • 5 Excel Data
    Pack Downloads
  • 250 Company Profiles PDF Downloads
  • Buy Now

*Taxes/Fees, if applicable will be added during checkout. All prices in USD

RELATED REPORTS
 

Why Allied Market Research?


Infallible Methodology

To ensure high-level data integrity, accurate analysis, and impeccable forecasts

Analyst Support

For complete satisfaction

Customization

On-demand customization of scope of the report to exactly meet your needs

TARGETED MARKET VIEW

Targeted market view to provide pertinent information and save time of readers

Get fresh content delivered

Get insights on topics that are crucial for your business. Stay abreast of your interest areas.

Get Industry Data Alerts

Why Allied Market Research?

Infallible Methodology

To ensure high-level data integrity, accurate analysis, and impeccable forecasts

Analyst Support

For complete satisfaction

Customization

On-demand customization of scope of the report to exactly meet your needs

TARGETED MARKET VIEW

Targeted market view to provide pertinent information and save time of readers