
Horizontal Directional Drilling Market Research, 2033
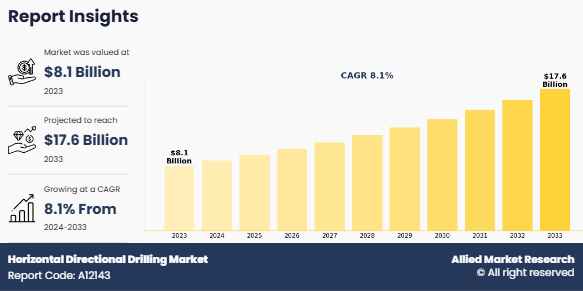
The global horizontal directional drilling market was valued at $8.1 billion in 2023, and is projected to reach $17.6 billion by 2033, growing at a CAGR of 8.1% from 2024 to 2033. Increasing infrastructure development, rising demand for energy and telecommunications networks, adoption of trenchless technology, and environmental regulations are key factors driving the growth of the horizontal directional drilling market.
Horizontal Directional Drilling Market Dynamics
The horizontal directional drilling market comprises the manufacturing, deployment, and maintenance of HDD equipment and services used to install underground pipelines, cables, and conduits with minimal surface disruption. HDD technology allows for trenchless installation in applications such as oil and gas pipelines, water and sewage systems, power transmission, and telecommunication networks. The market includes HDD contractors, equipment manufacturers, and service providers operating across residential, commercial, and industrial sectors.
Horizontal directional drilling involves site surveying, pilot hole drilling, reaming, and product installation, supported by advanced drilling rigs, mud systems, GPS-guided navigation, and monitoring technologies to ensure accuracy, efficiency, and safety. Innovations in drill bits, drilling fluids, and automation have enhanced drilling speed, reduced environmental impact, and expanded applicability in challenging terrains and urban areas.
Rising investments in renewable energy projects, expanding urban infrastructure, and increasing demand for broadband and fiber-optic networks are fueling market expansion, particularly in North America, Europe, and Asia-Pacific. Strategic partnerships, mergers, and acquisitions among key market players, along with a focus on sustainability and safety compliance, are shaping industry competitiveness.
As governments and private enterprises continue to prioritize efficient, minimally invasive infrastructure development, the horizontal directional drilling market is expected to experience steady growth between 2024 and 2033, driven by technological advancements, service diversification, and expanding global adoption of trenchless solutions.
Key Study Findings
- In 2023, the rigs segment generated the highest revenue and is expected to register a significant CAGR of 7.5% over the forecast period.
- The onshore segment emerged as the leading contributor to the horizontal directional drilling market’s revenue in 2023.
- By end user, the oil and gas extraction segment accounted for the largest share of market revenue in 2023.
- By region, Asia-Pacific led the market in terms of revenue in 2023, reflecting strong infrastructure development and adoption of trenchless technology.
Key Market Dynamics
The horizontal directional drilling market is influenced by increasing infrastructure development, rising energy and telecommunication demands, adoption of trenchless technology, and continuous technological innovation. Expanding urbanization, development of smart cities, and growth in utility and transportation networks are significantly shaping market growth. In addition, the increasing need for minimally invasive underground installations, along with the integration of advanced GPS and automation systems, is accelerating HDD adoption across diverse sectors, including oil and gas, water and sewage, power transmission, and telecommunications.
Drivers
The HDD market is primarily driven by rising infrastructure investments and the need for efficient, low-disruption pipeline and cable installations. Governments and private enterprises are increasingly prioritizing trenchless technology to reduce surface disturbance, environmental impact, and construction timelines, which is encouraging the adoption of HDD solutions. Technological advancements in drilling rigs, drill bits, and drilling fluids are further supporting market growth. Modern rigs with automated steering, real-time monitoring, and high-capacity mud systems enhance drilling accuracy, operational efficiency, and safety.
Increasing demand for renewable energy projects, such as wind and solar power, and the expansion of broadband and fiber-optic networks are additional growth drivers. Strategic partnerships, mergers, and acquisitions among leading HDD equipment manufacturers and service providers are helping expand service reach and improve market competitiveness. Rising urbanization, smart city initiatives, and growing construction activities in regions such as North America, Europe, and Asia-Pacific are contributing to sustained market demand.
Restraints
Despite favorable growth prospects, the HDD market faces certain constraints. High initial capital investment for advanced drilling equipment and the cost of skilled labor can limit adoption, particularly in small- and medium-scale projects. Complex geological conditions, such as rocky or unstable soil formations, pose technical challenges that can increase project timelines and operational costs. Strict regulatory requirements related to environmental protection, land use, and safety standards can also affect project approvals and implementation.
Opportunities
The HDD market presents significant opportunities driven by innovation, sustainability, and infrastructure modernization. Expansion of renewable energy pipelines, underground utilities, and urban telecom networks is creating new demand. Sustainable drilling practices, eco-friendly fluids, and advanced monitoring systems enhance operational safety and environmental compliance. Emerging economies with growing industrial and urban infrastructure offer untapped potential for HDD service providers. Strategic collaborations, technology licensing, and digital integration in project planning and execution are further enabling market growth.
As governments and industries continue to emphasize efficient, minimally invasive underground construction, the horizontal directional drilling market is expected to witness steady growth between 2024 and 2033, supported by technological advancements, service diversification, and expanding global adoption of trenchless solutions.
Market Segmentation
The horizontal directional drilling market is segmented on the basis of part type, application, end user, and region. On the basis of part type, the horizontal directional drilling market is divided into rigs, pipes, bits, and reamers. By application, the horizontal directional drilling market is segregated into onshore and offshore. On the basis of end user, the horizontal directional drilling market is classified oil & gas extraction, utility, telecommunication, and others. On the basis of region, it is analyzed across North America (the U.S., Canada, and Mexico), Europe (the UK, Germany, France, Italy, and the rest of Europe), Asia-Pacific (China, Japan, India, South Korea, and rest of Asia-Pacific), and LAMEA (Latin America, Middle East, Africa).
The horizontal directional drilling market exhibits varied growth patterns across its key segments. By part type, the rigs segment hold a dominant share due to their central role in drilling operations, high efficiency, and adoption of advanced automation technologies that enhance precision and reduce operational downtime. Pipes are witnessing steady demand, driven by increasing installation of underground pipelines for oil, gas, water, and telecommunication networks. Bits and reamers are gaining traction as innovations in drill bit design, material strength, and reaming efficiency support drilling through challenging soil and rock conditions, enabling faster project completion and reduced operational risks.
By application, the onshore segment accounts for the largest market share owing to extensive infrastructure projects, including energy pipelines, urban utility networks, and telecommunication cable installations. Offshore applications are expanding steadily, particularly in regions with significant oil and gas exploration activities, as HDD facilitates the safe and efficient installation of subsea pipelines and conduits with minimal environmental disruption.
By end user, the oil & gas extraction segment dominates due to the sector’s heavy reliance on underground pipeline infrastructure and the need for trenchless solutions in environmentally sensitive or urban areas. The utility sector, including water, sewage, and electricity distribution, maintains strong adoption due to ongoing urbanization and smart city initiatives. Telecommunication end users are driving growth with increased demand for fiber-optic networks and broadband expansion, particularly in emerging economies. Other end users, such as construction and renewable energy projects, are contributing to incremental growth through specialized applications of HDD technology.
Regional Market Outlook
North America (the U.S., Canada, and Mexico) holds a significant market share, supported by well-established infrastructure, advanced HDD technology adoption, and regulatory incentives for trenchless solutions. Europe (the UK, Germany, France, Italy, and the rest of Europe) is witnessing steady growth due to urban infrastructure modernization, renewable energy pipelines, and sustainability-driven construction practices. Asia-Pacific (China, Japan, India, South Korea, and the rest of the region) represents a rapidly growing market fueled by large-scale industrial projects, urbanization, and expanding utility and telecom networks. LAMEA (Latin America, Middle East, and Africa) is gradually emerging as a key growth region, driven by oil and gas exploration, water and sewage projects, and increasing adoption of trenchless technologies.
Horizontal Directional Drilling Market Value Chain Analysis
The horizontal directional drilling market value chain begins with suppliers of critical components such as rigs, drill bits, reamers, and pipes. Equipment manufacturers design and produce advanced HDD rigs and accessories, incorporating automation, GPS guidance, and high-performance materials to ensure operational efficiency. Service providers and contractors then utilize these components to execute drilling projects, including site surveying, pilot hole drilling, reaming, and pipe or cable installation.
After installation, logistics and support services manage equipment maintenance, spare parts supply, and on-site technical assistance to ensure smooth project execution. Engineering and consulting firms contribute through project planning, feasibility studies, and environmental compliance assessments. Regulatory authorities oversee safety standards, environmental regulations, and licensing for drilling operations. End users, including oil and gas, utilities, and telecommunications companies, drive demand by commissioning projects that meet infrastructure, energy, and connectivity needs. Finally, technological innovation and evolving project requirements continually shape strategies across the HDD value chain.
Which end-user segments are fueling growth in the HDD market?
The expansion of the horizontal directional drilling market is primarily driven by oil and gas operators, utility providers, telecommunications companies, and construction enterprises. Oil and gas firms rely heavily on HDD solutions for the safe and efficient installation of pipelines, particularly in environmentally sensitive or urban areas. Utility companies are adopting HDD technology to install water, sewage, and electricity networks with minimal surface disruption. Telecommunications providers are increasingly deploying fiber-optic cables using trenchless methods to meet rising broadband and data connectivity demands. Construction and renewable energy projects are also contributing to market growth through specialized HDD applications. Collectively, these end-user segments demand high-precision, durable, and versatile drilling solutions, encouraging service providers and equipment manufacturers to expand capabilities, improve efficiency, and innovate across rigs, bits, reamers, and pipes.
What are the key trends shaping the HDD industry?
A significant trend in the HDD market is the adoption of automation and smart drilling technologies. GPS-guided rigs, real-time monitoring systems, and advanced control software are improving accuracy, reducing operational risks, and enhancing productivity. Another notable trend is the increasing focus on trenchless technology for environmentally sustainable and minimally disruptive infrastructure development. Growing urbanization, renewable energy projects, and the expansion of fiber-optic networks are driving demand for HDD solutions in both developed and emerging markets. In addition, integrated project management, digital planning, and predictive maintenance services are reshaping operational practices, enabling contractors to optimize costs and timelines while meeting regulatory and environmental standards.
How is technology impacting the HDD market?
Technology is revolutionizing the horizontal directional drilling process, from planning and execution to monitoring and maintenance. Advanced drilling rigs with automated steering and precise depth control enable highly accurate pilot hole drilling. Innovations in drill bits, reamers, and drilling fluids allow for faster penetration through hard soils and rock formations while minimizing environmental impact. Digital platforms and AI-driven analytics help operators monitor equipment performance, forecast project requirements, and optimize resource allocation. Furthermore, improved logistics, remote monitoring, and sensor-enabled machinery enhance operational efficiency, safety, and reliability across complex drilling projects.
What innovations are strengthening the HDD market?
Innovation in the HDD market focuses on equipment, project execution, and sustainability. High-performance rigs, modular drilling systems, and specialized bits and reamers expand the range of applications and terrain adaptability. Environmentally friendly drilling fluids and eco-conscious operational practices support compliance with regulatory standards. Integration of digital project management, automated reporting, and remote monitoring tools increases efficiency and reduces downtime. Strategic collaborations between equipment manufacturers, service providers, and technology firms are driving innovation across drilling techniques, materials, and software solutions, enabling contractors to execute complex projects faster, safer, and more cost-effectively while meeting growing infrastructure demands globally.
Competitive Landscape
The global horizontal directional drilling market comprises leading equipment manufacturers and service providers, including Barbco Inc., NOV, The Charles Machine Works, Inc., SLB, Laney Drilling, Vermeer Corporation, Elvaan, Herrenknecht AG, Wuhan Yichao Technology Equipment Co., Ltd, and Epiroc. In 2023, these key players focused on product launches, technological upgrades, and strategic acquisitions to expand their market presence. Their efforts emphasize innovation in drilling rigs, bits, reamers, and pipes, alongside enhanced automation and precision solutions, to meet the growing demand for efficient, sustainable, and minimally invasive underground infrastructure projects worldwide.
Recent Industry Developments
- In January 2024, SLB and Nabors Industries announced a strategic partnership to advance the adoption of automated drilling solutions among oil and gas operators and drilling contractors. The collaboration aims to enable seamless integration of the companies’ drilling automation applications with rig operating systems, providing customers with access to a wide array of cutting-edge drilling automation technologies.
- In July 2023, Ditch Witch, a prominent provider of underground construction equipment and services, partnered with Heavy Equipment Colleges of America to deliver comprehensive training programs for both new and experienced Horizontal Directional Drilling (HDD) operators. This initiative is designed to enhance operator skills and ensure they are fully prepared to manage the complexities of underground construction projects safely and efficiently.
Key Benefits for Stakeholders
- This report offers a comprehensive quantitative analysis of the horizontal directional drilling (HDD) market, covering key segments, current trends, projections, and market dynamics from 2023 to 2033, to identify emerging opportunities. It provides detailed insights into the market’s primary drivers, restraints, and overall size.
- Porter’s Five Forces analysis evaluates the influence of buyers and suppliers, helping stakeholders make strategic, profit-oriented decisions and strengthen supply chain relationships. A detailed segmentation study highlights prevailing opportunities across applications, end users, and regions, with major countries mapped according to their revenue contributions to the global HDD market.
- The report also benchmarks key market players, offering clarity on their current positioning and competitive strategies. In addition, it examines regional and global market trends, application areas, market outlook, growth strategies, and the role of HDD rigs in supporting infrastructure development. These insights enable stakeholders to make informed investment, expansion, and operational decisions.
Horizontal Directional Drilling Market Report Highlights
| Aspects | Details |
| Market Size By 2033 | USD 17.6 billion |
| Growth Rate | CAGR of 8.1% |
| Forecast period | 2023 - 2033 |
| Report Pages | 288 |
| By Parts |
|
| By Application |
|
| By End Use |
|
| By Region |
|
| Key Market Players | American Augers, Epiroc AB, Laney Drilling, Vermeer Corporation, Barbco Inc., Elvaan, NOV, SLB, Wuhan Yichao Technology Equipment Co., Ltd, Herrenknecht AG |
Analyst Review
There is strong anticipation of substantial market growth in the near future for Horizontal Directional Drillings. With technological advancements and increasing demand across various sectors, HDD is poised to play a pivotal role in modern infrastructure development. The market is driven by factors such as the growing need for underground infrastructure in urban areas, the increasing demand for oil and gas pipelines, and the adoption of advanced telecommunications technologies such as 5G. The expansion of broadband connectivity, particularly the rollout of fiber optic networks, and the growing adoption of offshore exploration projects, further fuel the demand for HDD.
The HDD industry is placing strategic emphasis on improving operational efficiencies and expanding service offerings to tap into emerging markets. The increasing complexity of projects spanning urban and rural environments requires the industry to innovate and adopt automation and digital technologies to enhance accuracy and reduce operational costs. Moreover, governments' focus on sustainable and eco-friendly construction practices is fostering the shift from traditional excavation methods to trenchless techniques like HDD. These developments are anticipated to reduce environmental disruption and lower costs, enhancing the attractiveness of HDD solutions to industries across oil and gas, telecommunications, and utilities.
Furthermore, rapid industrialization and urbanization in emerging economies, particularly in regions such as Asia-Pacific and Africa, create substantial opportunities for the rock drilling tool market. As these regions invest in infrastructure development and mining, there is expected to be a growing demand for advanced rock drilling tools to support these initiatives; thus providing opportunities for manufacturers of rock drilling tools. For instance, in July 2023, Ditch Witch, a leading provider of underground construction equipment and services, entered into an agreement with Heavy Equipment Colleges of America to offer training for Horizontal Directional Drilling (HDD) for both new & seasoned operators. This collaboration between Ditch Witch and Heavy Equipment Colleges of America aims to enhance the skills of HDD operators, ensuring that they are well-equipped to handle the challenges of underground construction
Rising Demand for Fiber Optic and Telecommunication Networks, and Integration with Renewable Energy Projects are some of the upcoming trends of Horizontal Directional Drilling Market in the globe.
Onshore is the leading application of Horizontal Directional Drilling Market
Asia-Pacific is the largest regional market for Horizontal Directional Drilling
In 2023, $8.1 billion was the estimated industry size of Horizontal Directional Drilling
Barbco Inc., NOV, The Charles Machine Works, Inc., SLB, Laney Drilling, Vermeer Corporation, Elvaan, Herrenknecht AG, Wuhan Yichao Technology Equipment Co., Ltd, Epiroc are the top companies to hold the market share in Horizontal Directional Drilling
Loading Table Of Content...
Loading Research Methodology...

