
Hospitality Furniture Market Overview, 2033
The global hospitality furniture market was valued at $4.4 billion in 2023, and is projected to reach $6.4 billion by 2033, growing at a CAGR of 3.9% from 2024 to 2033. The Hospitality Furniture Industry encompasses the production, distribution, and sale of furniture specifically designed and manufactured for use in various hospitality establishments such as hotels, restaurants, cafes, bars, resorts, and other lodging and dining facilities. This specialized furniture is crafted to meet the unique needs and aesthetics of hospitality environments, balancing functionality, durability, and aesthetic appeal. Hospitality furniture includes a wide range of products such as beds, sofas, chairs, tables, cabinets, desks, and other furnishings tailored to enhance guest comfort and experience while complementing the overall ambiance and design theme of the establishment. Manufacturers and suppliers in this market cater to the specific requirements of hospitality businesses, offering furniture solutions that not only meet industry standards for safety and durability but also align with evolving trends in interior design and guest expectations for comfort and style. The hospitality furniture market plays a crucial role in shaping the visual identity and operational efficiency of hospitality venues, contributing significantly to the overall guest experience and satisfaction. 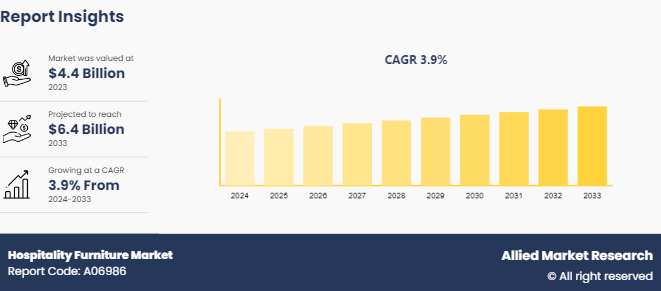
Key Takeaways
The hospitality furniture market study covers 20 countries. The research includes a segment analysis of each country in terms of value for the projected period.
More than 1, 500 product literatures, industry releases, annual reports, and other such documents of major energy storage system industry participants along with authentic industry journals, trade associations' releases, and government websites have been reviewed for generating high-value industry insights.
The study integrated high-quality data, professional opinions and analysis, and critical independent perspectives. The research approach is intended to provide a balanced view of global markets and assist stakeholders in making educated decisions to achieve their most ambitious growth objectives.
Key market dynamics
The expanding global tourism and hospitality industry is a significant driver for the hospitality furniture market. As more hotels, resorts, restaurants, and other hospitality establishments open worldwide, there is a corresponding increase in demand for furniture that meets the functional and aesthetic requirements of these venues. The growth in international travel and domestic tourism drives the need for comfortable and attractive furniture that enhances guest experiences, leading to higher sales volumes for manufacturers and suppliers in the hospitality furniture sector, increasing the Hospitality Furniture Market Size.
Consumers, particularly millennials and Gen Z, increasingly prioritize experiences and aesthetics when choosing hospitality venues. There is a growing demand for unique and stylish furniture designs that contribute to a memorable guest experience. Hospitality businesses are responding by investing in high-quality, visually appealing furniture that not only meets functional needs but also aligns with current interior design trends. This trend drives innovation in furniture design, encouraging manufacturers to create versatile and customizable products that cater to diverse consumer preferences and enhance the overall ambiance of hospitality spaces, increasing the Hospitality Furniture Market Share.
Fluctuations in the global economy can impact consumer spending on travel and hospitality services, directly affecting the demand for hospitality furniture. During economic downturns or periods of uncertainty, hospitality businesses may postpone renovations or reduce budgets for furniture upgrades, leading to decreased sales and profitability for furniture manufacturers and suppliers.
The hospitality industry is subject to various regulations and standards related to safety, accessibility, and environmental sustainability. Compliance with these regulations can pose challenges for furniture manufacturers, particularly in terms of material sourcing, product testing, and certification requirements. Meeting regulatory standards adds complexity and cost to the manufacturing process, potentially limiting product innovation and market entry for smaller manufacturers.
There is a growing opportunity within the hospitality furniture market to capitalize on trends related to wellness and sustainability. Consumers are increasingly mindful of environmental impact and health considerations when choosing hospitality venues. Furniture manufacturers can innovate by developing eco-friendly materials, incorporating ergonomic designs, and promoting sustainable practices throughout the product lifecycle. Embracing wellness-focused trends such as biophilic design (integrating natural elements into indoor spaces) and offering furniture solutions that enhance guest well-being can differentiate brands in a competitive market.
Value chain of hospitality furniture market
The value chain of the hospitality furniture market includes several key stages, starting from raw material sourcing to the final delivery and service to hospitality establishments. It begins with suppliers of raw materials such as wood, metal, fabrics, and sustainable materials, which are sourced globally to meet manufacturing needs. Manufacturers then process these materials into furniture components, leveraging advanced production technologies and craftsmanship to ensure quality and durability.
Moreover, distributors and wholesalers play a critical role in the value chain by distributing finished furniture products to retailers, hospitality procurement companies, and directly to hospitality venues. These intermediaries manage logistics, storage, and inventory to meet the diverse demands of hospitality businesses for furniture that ranges from beds and sofas to dining tables and chairs.
Hospitality procurement firms and interior designers collaborate closely with manufacturers to select and customize furniture that aligns with the aesthetic and functional requirements of hospitality spaces. They facilitate the design, specification, and installation of furniture within hotels, resorts, restaurants, and other venues.
Furthermore, the end-users, including hotels, resorts, restaurants, and other hospitality establishments, complete the value chain by purchasing and integrating furniture into their facilities to enhance guest experiences and operational efficiency. Throughout this chain, collaboration and innovation drive the development of furniture solutions that meet evolving consumer preferences and industry standards, ensuring a seamless flow from production to consumption in the hospitality furniture market.
Market Segmentation
The hospitality furniture market is segmented into furniture type, material type, application and region. On the basis of furniture type, the market is divided into hotel furniture, restaurant furniture, bar furniture, cafe furniture and resort furniture. On the basis of material type, the market is categorized into wooden furniture, metal furniture, plastic furniture, and glass furniture. On the basis of application, the market is segregated into indoor furniture and outdoor furniture. Region-wise, the market is analyzed across North America, Europe, Asia-Pacific and LAMEA.
Regional/Country Market Outlook
The U.S. hospitality furniture market is poised for steady growth, driven by a robust hospitality industry that includes hotels, restaurants, resorts, and other lodging facilities. Factors contributing to market expansion include a strong economy, increasing consumer spending on travel and dining out, and ongoing renovations and new constructions within the hospitality sector. The market benefits from a trend towards experiential travel and the preference for high-quality, aesthetically pleasing furniture that enhances guest comfort and overall experience. Sustainable practices and innovative designs also play a significant role, as hospitality businesses seek eco-friendly solutions and customizable options to differentiate their offerings. However, challenges such as fluctuating raw material costs and regulatory compliance requirements pose considerations for manufacturers and suppliers operating in the US Hospitality Furniture Market Growth.
China's hospitality furniture market is experiencing rapid growth, fueled by urbanization, rising disposable incomes, and a booming tourism sector. The country's expanding middle class and increasing domestic and international tourism drive demand for hotels, restaurants, and resorts, stimulating investments in hospitality infrastructure and furniture. Key trends include a preference for modern and luxurious designs, as well as a growing interest in sustainable and ergonomic furniture solutions. Manufacturers in China benefit from a strong manufacturing base, technological advancements, and competitive pricing, which position the country as a leading producer and exporter of hospitality furniture globally. Challenges include navigating regulatory complexities and meeting quality standards, particularly as the market matures and consumer expectations evolve towards higher standards of quality and design, increasing Hospitality Furniture Market Demand.
Industry Trends
Manufacturers are incorporating sustainable materials such as reclaimed wood, bamboo, and recycled metals into their designs. Additionally, there is a push towards furniture that is designed for longevity and durability, reducing the need for frequent replacements and minimizing waste. This trend not only meets consumer preferences for sustainability but also aligns with regulatory requirements and enhances brand reputation for responsible business practices.
Hospitality venues are increasingly looking for furniture solutions that can be tailored to their unique brand identities and design aesthetics. Customizable options include a variety of finishes, fabrics, and configurations that allow businesses to create distinctive and memorable guest experiences. This trend is driven by the desire to differentiate from competitors and create spaces that reflect the values and personality of the establishment. Manufacturers are responding by offering flexible manufacturing processes and design capabilities that enable hospitality businesses to achieve their vision while maintaining functionality and comfort. The demand for personalized furniture extends beyond aesthetics to include ergonomic considerations and multi-functional designs that optimize space utilization in diverse hospitality settings. As customization continues to gain importance, it is expected to drive innovation and competition within the hospitality furniture market, influencing both product development and consumer expectations.
Competitive Landscape
The major players operating in the hospitality furniture market are Kimball Hospitality, Bryan Ashley, Suyen Furniture Group, Taiyi Hotel Furniture, Gotop Furniture Group, Foliot, Solid Comfort, Distinction Group, New Qumun Group, Klem (Jasper Group) , CF Kent and Bernhardt Furniture.
Recent Key Strategies and Developments
In July 2022: HNI Corp. announced that it has completed the sale of its China- and Hong Kong-based Lamex office furniture business to Kokuyo Co., Ltd. for USD 75 million
In 2021, Herman Miller and Knoll merged to establish the preeminent leader in modern design, catalyzing the transformation of the home and office.
Key Sources Referred
- HNI Corp.
Economic Times
Key Benefits For Stakeholders
- This report provides a quantitative analysis of the market segments, current trends, estimations, and dynamics of the hospitality furniture market analysis from 2024 to 2033 to identify the prevailing hospitality furniture market opportunities.
- The market research is offered along with information related to key drivers, restraints, and opportunities.
- Porter's five forces analysis highlights the potency of buyers and suppliers to enable stakeholders make profit-oriented business decisions and strengthen their supplier-buyer network.
- In-depth analysis of the hospitality furniture market segmentation assists to determine the prevailing market opportunities.
- Major countries in each region are mapped according to their revenue contribution to the global market.
- Market player positioning facilitates benchmarking and provides a clear understanding of the present position of the market players.
- The report includes the analysis of the regional as well as global hospitality furniture market trends, key players, market segments, application areas, and market growth strategies.
Hospitality Furniture Market Report Highlights
| Aspects | Details |
| Market Size By 2033 | USD 6.4 Billion |
| Growth Rate | CAGR of 3.9% |
| Forecast period | 2024 - 2033 |
| Report Pages | 320 |
| By Furniture Type |
|
| By Material Type |
|
| By Application |
|
| By Region |
|
| Key Market Players | Taiyi Hotel Furniture, Suyen Furniture Group, Solid Comfort, Bryan Ashley, Kimball Hospitality, New Qumun Group, CF Kent and Bernhardt Furniture, Distinction Group, FoliotFurniture, Klem (Jasper Group), Gotop Furniture Group |
The leading application of hospitality furniture typically revolves around its use in hotels and resorts.
There's a growing emphasis on sustainable materials and manufacturing processes.
The major players operating in the hospitality furniture market are Kimball Hospitality, Bryan Ashley, Suyen Furniture Group, Taiyi Hotel Furniture, Gotop Furniture Group, Foliot, Solid Comfort, Distinction Group, New Qumun Group, Klem (Jasper Group), CF Kent and Bernhardt Furniture.
The global hospitality furniture market was valued at $4.4 billion in 2023, and is projected to reach $6.4 Billion by 2033, growing at a CAGR of 3.9% from 2024 to 2033.
The largest regional market for hospitality furniture tends to be North America.
Loading Table Of Content...

