
Hybrid Capacitor Market Research, 2032
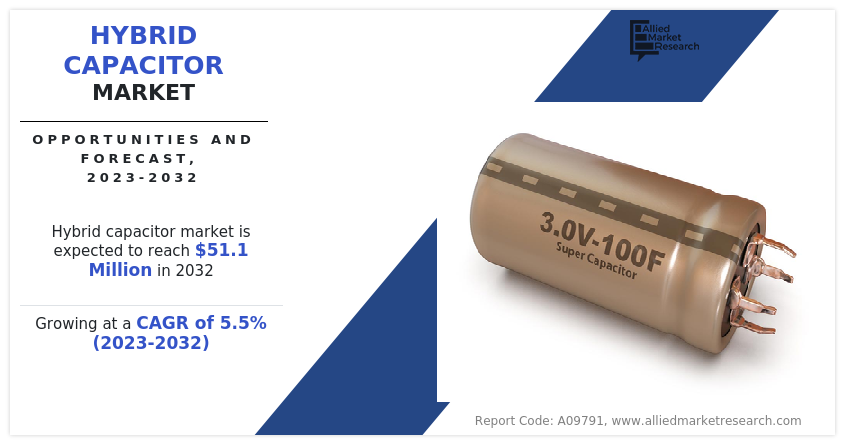
The global hybrid capacitor market was valued at $29.96 million in 2022, and is projected to reach $51.1 million by 2032, growing at a CAGR of 5.5% from 2023 to 2032.
A hybrid capacitor has the best features of both polymer and aluminum capacitors. It has a special electrolyte that is made with a combination of a polymer and a liquid. This makes the hybrid capacitor perform very well in its various aspects, such as electrical properties, stability, durability, reliability, safety, and cost-effectiveness. It works at higher voltages and temperatures than other polymer capacitors and has lower resistance and higher capacitance than regular aluminum capacitors. Hybrid capacitors are good for applications that need high power, high energy, and low resistance.
These capacitors find extensive applications in various industries due to their advantageous characteristics. One notable application is in power electronics, where hybrid capacitors enhance energy efficiency and stability in electric vehicles, renewable energy systems, and power inverters. The ability of hybrid capacitor to deliver power quickly and make them suitable for applications requiring frequent and rapid energy transfers, such as regenerative braking in electric vehicles. In addition, their long cycle life and reliability contribute to their use in backup power systems, ensuring a consistent power supply during outages.
Moreover, hybrid capacitors play a pivotal role in electronic devices that demand both high energy storage and rapid power delivery. Applications range from consumer electronics, such as laptops and cameras, to industrial automation systems. The aerospace sector benefits from their lightweight design and ability to handle extreme temperature variations, making them ideal for satellite power systems and avionics.
The hybrid capacitor market is projected to experience significant growth due to the increase in use of radial type hybrid capacitor in automotive application, compact size of hybrid capacitor, or supercapacitor and suitability for high-density packaging. Lucrative prospects are expected to arise from growth in the renewable energy market and improved vibration resistance of hybrid capacitor. However, issues related to low energy density restrict market growth. Integrating both double-layer capacitor technology and power capacitor design enhances the energy storage capabilities in our innovative electronic devices.
The usage of hybrid capacitors in vehicles such as buses, fleet vehicles, subways, long-distance trucks, and trains cut fuel consumption and eliminate CO2 emissions. The product's introduction in many automotive applications such as power assistance, auto-start-stop, catalyst preheating, door locking systems, regenerative braking, and electrical system stabilization is expected to raise demand for these capacitors globally. The usage of these capacitors has increased battery capacity, allowing vehicle makers to achieve longer battery life, higher fuel efficiency, lighter vehicles, and lower emissions. To meet tough pollution standards across the globe, lithium-ion capacitors, supercapacitor or hybrid capacitors are anticipated to penetrate all types of vehicles faster, including conventional, hybrid, and electric vehicles.
Segment Overview
The hybrid capacitor market is segmented into Product Type and Application.

On the basis of product type, the market is divided into radial type and laminating type. In 2022, the laminating type segment dominated the market, and radial type is expected to acquire a major market share by 2032 owing to increase in use of hybrid capacitors in automotive application.

On the basis of application, the market is categorized into power generation, transmission, distribution, and others. In 2022, the power generation segment dominated the market, and it is expected to acquire a major market share by 2032 due to an increase in investment of government and private companies in utility sector.

On the basis of region, the hybrid capacitor market trends are analyzed across North America (the U.S., Canada, and Mexico), Europe (Germany, UK, France, Spain, Italy, and rest of Europe), Asia-Pacific (China, Japan, India, South Korea, and rest of Asia-Pacific), and Latin America (Bolivia, Argentina, and Rest of Latin America), and Middle East Africa (Saudi Arabia, Africa, and Rest of Middle East And Africa).
Competitive Analysis
Competitive analysis and profiles of the major global hybrid capacitor market players have been provided in the report include JTEKT Corporation, TAIYO YUDEN CO., LTD., Vishay Intertechnology, Inc., LICAP Technologies, Inc., SOCOMEC GROUP, EVE Energy Co., Ltd., SPEL TECHNOLOGIES PRIVATE LTD., Electro Standards Laboratories, Yunasko, and KEMET Corporation. These companies for hybrid capacitor market share by company have highest market share. The key strategy adopted by the major players of the hybrid capacitor market is product launch.
Country Analysis
Country-wise, the U.S. hybrid capacitor market size by country acquired a prime share in the hybrid capacitor market in the North American region and it is expected to grow at a significant CAGR during the forecast period of 2023-2032.
In Europe, France dominated the hybrid capacitor market share, in terms of revenue, in 2022 and is expected to follow the same trend during the forecast period. Germany is expected to emerge as the fastest-growing country in Europe's hybrid capacitor market with a CAGR of 7.27%.
In Asia-Pacific, India is expected to emerge as a significant market for the hybrid capacitor market industry, owing to a significant rise in investment by prime players due to increase in growth of consumer electronics and industrial units for electric vehicles (EV) in rural and urban regions.
In the LAMEA region, Brazil garnered significant market share in 2022. The LAMEA hybrid capacitor market has witnessed an improvement, owing to the growth in inclination of prime vendors toward utilizing the hybrid capacitor across this region in consumer electronics. Moreover, the Saudi Arabia region is expected to grow at a high CAGR of 5.17% from 2023 to 2032.
Top Impacting Factors
The hybrid capacitor market is expected to witness notable growth owing to increase in use of radial type hybrid capacitor in automotive application, and compact size of hybrid capacitor, which are suitable for high-density packaging. Moreover, growth in renewable energy market and improved vibration resistance are expected to provide lucrative opportunities for the expansion of the market during the forecast period. On the contrary, low energy density limits the hybrid capacitor market growth.
Historical Data & Information
The global hybrid capacitor industry is highly competitive owing to the strong presence of existing vendors. Hybrid capacitor companies have extensive technical and financial resources are expected to gain a competitive advantage over their competitors as they cater to market demands. The competitive environment in this market is anticipated to get tough due to technological innovations, product extensions, and different strategies adopted by key vendors fo hybrid capacitor industry.
Key Developments/ Strategies
In May 2021, VINATech Co., Ltd. launched a new series of 3.8V lithium-ion capacitors. These capacitors have high operating voltage, low self-discharge, high capacitance, and wide operating temperature range.
In June 2020, Kawasaki Heavy Industries, Ltd. ordered Blue Marlin, a high-density lithium-ion capacitor energy storage system from Corvus Energy. The Blue Marlin utilizes LIC technology with a very high charge and discharge rates of 220 C continuous and 550 C peak, making it efficient for high power load handling applications.
In July 2023, Asahi Kasei initiates the licensing of design and manufacturing technology for lithium-ion capacitors as an advanced energy storage device.
Key Benefits For Stakeholders
- This hybrid capacitor market report provides a quantitative analysis of the market segments, current trends, estimations, and dynamics of the hybrid capacitor market analysis from 2022 to 2032 to identify the prevailing hybrid capacitor market opportunity.
- The market research is offered along with information related to key drivers, restraints, and opportunities.
- Porter's five forces analysis highlights the potency of buyers and suppliers to enable stakeholders make profit-oriented business decisions and strengthen their supplier-buyer network.
- In-depth analysis of the hybrid capacitor market segmentation assists to determine the prevailing market opportunities.
- Major countries in each region are mapped according to their revenue contribution to the global hybrid capacitor market overview.
- Market player positioning facilitates benchmarking and provides a clear understanding of the present position of the market players.
- The report includes the analysis of the regional as well as global hybrid capacitor market trends, key players, market segments, application areas, hybrid capacitor growth projections and market growth strategies.
Hybrid Capacitor Market Report Highlights
| Aspects | Details |
| Forecast period | 2022 - 2032 |
| Report Pages | 233 |
| By Product Type |
|
| By Application |
|
| By Region |
|
| Key Market Players | EVE Energy Co., Ltd., TAIYO YUDEN CO., LTD., LICAP Technologies, Inc., Vishay Intertechnology, Inc., Yunasko, JTEKT Corporation, Electro Standards Laboratories, KEMET Corporation, SPEL TECHNOLOGIES PRIVATE LTD., SOCOMEC GROUP |
Analyst Review
Hybrid capacitors, also referred to as electrochemical capacitors or supercapacitors, play a crucial role in addressing the energy storage requirements of diverse electronic devices and systems. Unlike conventional capacitors and batteries, hybrid capacitors amalgamate the most helpful features of both, presenting a distinct set of characteristics tailored for specific applications. This discourse explores the operational principles, benefits, challenges, and varied applications of hybrid capacitors.
At the heart of hybrid capacitors lies the fusion of two energy storage mechanisms: electrostatic double-layer capacitance (EDLC) and pseudo-capacitance. EDLC relies on the separation of charges at the electrode-electrolyte interface, easing swift charging and discharging. Conversely, pseudo-capacitance involves faradaic redox reactions within the electrode material, contributing added capacitance and energy density.
A paramount advantage of hybrid capacitors is their capacity to supply high power density, making them well-suited for applications demanding rapid energy release. This proves beneficial in electric vehicles, regenerative braking systems, and specific medical devices. The rapid charge/discharge capabilities of EDLC account for the heightened power density, especially valuable in situations where immediate energy delivery is imperative.
Energy density, another pivotal parameter, is a noteworthy feature of hybrid capacitors. Although they may not match the energy density of traditional batteries, the amalgamation of capacitance mechanisms allows hybrid capacitors to store more energy than standard capacitors. This makes them suitable for applications requiring a delicate balance between power and energy storage, such as in renewable energy systems and portable electronic devices.
Furthermore, the extended cycle life of hybrid capacitors sets them apart from many batteries. The absence of chemical reactions that degrade electrode materials over time contributes to their durability. This makes hybrid capacitors a dependable choice for applications needing frequent charge and discharge cycles, including energy harvesting systems and industrial automation.
Notwithstanding their advantages, hybrid capacitors meet specific challenges. A notable hurdle is achieving increased energy density without compromising other performance parameters. Ongoing research and development endeavors by scientists and manufacturers aim to explore new materials and design strategies to overcome this limitation, enhancing the overall efficiency of hybrid capacitors.
In terms of applications, hybrid capacitors find utility across a diverse array of industries. In the automotive sector, they play a pivotal role in advancing hybrid and electric vehicles by delivering high-power bursts during acceleration and capturing energy during braking. In addition, hybrid capacitors contribute significantly to mitigating power fluctuations in renewable energy systems, thereby enhancing the overall reliability and efficiency of solar and wind power installations.
The Hybrid Capacitor Market is poised for growth driven by increasing demand for energy-efficient solutions and advancements in hybrid supercapacitor technology.
Power Generation is the leading application of Hybrid Capacitor Market.
North America is the largest regional market for Hybrid Capacitor.
The global hybrid capacitor market was valued at $29.96 million in 2022
JTEKT Corporation, TAIYO YUDEN CO., LTD., Vishay Intertechnology, Inc., LICAP Technologies, Inc., SOCOMEC GROUP, EVE Energy Co., Ltd., SPEL TECHNOLOGIES PRIVATE LTD., Electro Standards Laboratories, Yunasko, and KEMET Corporation
Loading Table Of Content...
Loading Research Methodology...

