A04719 | Pages: 210 | Feb 2022 | 15239 Views | | |
Author(s) : Sonali Singh, and Amol Phoke | Tables: 115 | Charts: 58 |
|
Pandemic disrupted the entire world and affected many industries.
Get detailed COVID-19 impact analysis on the Hydraulic Cylinders Market
Request Now !The global hydraulic cylinders market size is expected to reach $21,243.2 million by 2030, from $14,070.0 million in 2020, growing at a CAGR of 4.2% from 2021 to 2030.
The COVID-19 outbreak has affected the growth of the hydraulic cylinders industry owing to the lockdown measures in the countries and delay in manufacturing and production of hydraulic cylinders equipment used in construction, and mining applications.
Hydraulic cylinder is a mechanical equipment, which is used to impart a unidirectional force through a unidirectional stroke. It is used for converting mechanical force into a linear motion. Hydraulic cylinder has a tube with a rod sticking out on one side. The piston separates the internal rod side from the internal cap side of the cylinder to avoid friction. Fluid is forced into either side of the cylinder to extend or retract the piston rod for smooth functioning.
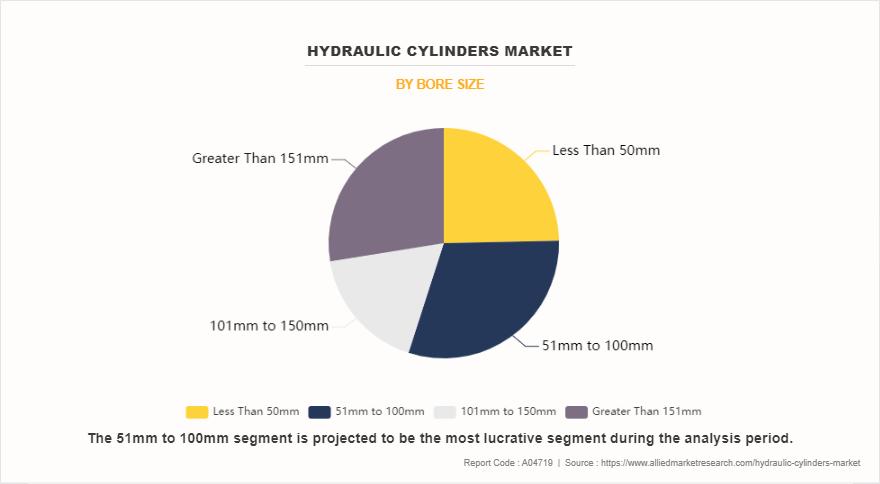
Increase in investment in the infrastructure-related activities and construction activities, which in turn, rise the demand for hydraulic cylinders for material handling equipment, drives the growth of the market. For instance, according to a combined study by Oxford Economics and Global Construction Perspective (GCP), the construction industry is expected to reach $15.5 trillion by 2030. Major players, such as Eaton Plc, Romheld GmbH, and Mapro d.o.o., are engaged in developing reliable and highly efficient double-acting hydraulic cylinders in the market. For instance, Eaton Plc offers a new hydro-electric cylinder with a value integration system. It is a high performance industrial cylinder, which provides unique and cost effective solutions, to the problem of classical systems. An increase in demand for cranes and rise in concerns to reduce labor costs in various developing countries, such as India, China, Brazil, and others, are factors that drive of the global hydraulic cylinders market growth. Greater than 151mm hydraulic cylinders are largely used in automated equipment, haulers, robotic trucks, and excavators, owing to high demand during the mining operations. A rise in investment in infrastructure related activities and mine sites on constructions in countries, such as India and China, fuels the growth of the market.
Major companies, such as Caterpillar Inc, Parker Hannifin Corporation, and others are engaged in providing technological advanced hydraulic cylinders to the market. For Instance, in March 2018, Parker Hannifin Corporation launched a new version of its single-acting telescopic (SAT) hydraulic cylinders for the dump truck market. The new SAT cylinder features 25% increase in operating pressure to 2,500 psi (127 bar) for improved strength and performance. JARP Industries, Inc. acquired Ordered Motion Systems, Inc. to focus on repair and manufacturing cylinders and for expansion of JARP’s presence in North America.
Get more information on this report : Request Sample Pages
The COVID-19 pandemic forced many companies in the global hydraulic cylinders market to halt business operations for a short term to comply with new government regulations to curb the spread of the disease. This halt in operations directly impacts revenue flow of the market. In addition, there is a halt in manufacturing of industrial products, owing to lack of raw materials and manpower in the lockdown period. Further, no new consignments are received by companies that operate in this sector. Hence, halt in industrial activities and lockdowns for several months has affected the global hydraulic cylinders market share and the market is anticipated to witness a slow recovery during the forecast period.
Rise in demand for material handling equipment to address the need of growing automotive, construction, engineering, manufacturing, and mining industries is expected to drive the hydraulic cylinders market opportunities globally.
Get more information on this report : Request Sample Pages
However, fluctuation in raw material prices, and rise in concerns about leak, are anticipated to hamper the growth of the global hydraulic cylinders market. Conversely, increase in automation and industrialization is anticipated to provide lucrative opportunities for the growth of the market.
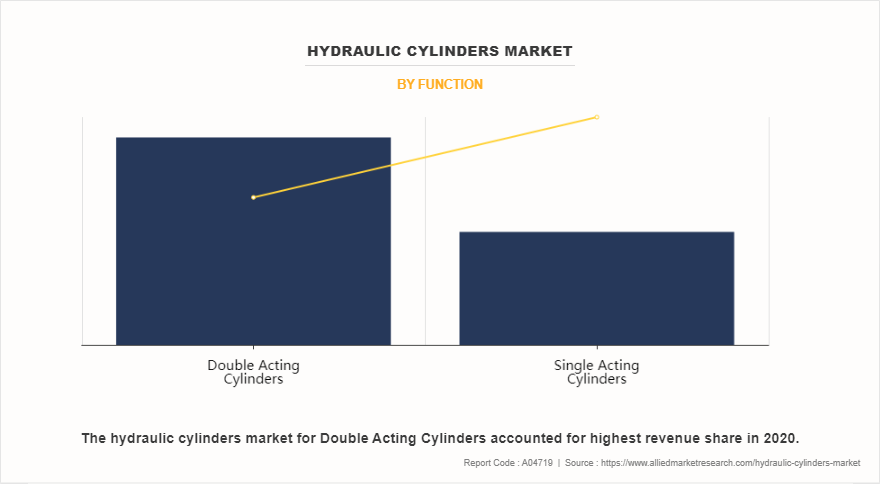
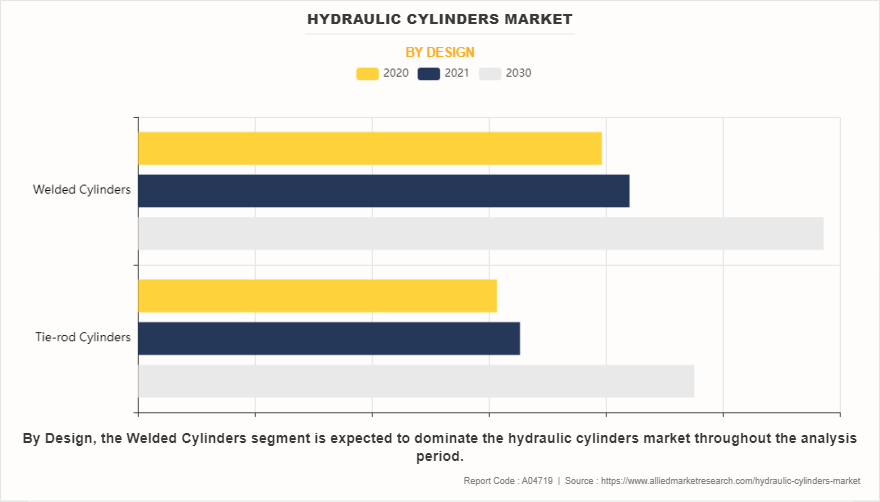
The hydraulic cylinders market is segmented into function, design, bore size, and region. By function, the market is divided into single-acting hydraulic cylinders and double acting hydraulic cylinders. By design, it is classified into tie-rod cylinders and welded cylinders. By bore size, the market is categorized into less than 50mm, 51mm to 100mm, 101mm to 150mm, and greater than 151mm.
By region, it is analyzed across North America, Europe, Asia-Pacific, and LAMEA. The Asia-Pacific region is expected to hold the highest market share during the forecast period.
The key players profiled in this report include, Actuant Corporation, Caterpillar Inc., Eaton Corporation Plc, JARP Industries Inc., Hengli Hydraulic, Kawasaki Heavy Industries Limited, Parker Hannifin Corporation, Robert Bosch GmbH (Bosch Rexroth AG), Texas Hydraulics Inc., and Wipro Limited.
Get more information on this report : Request Sample Pages
Key Benefits For Stakeholders
Key Market Segments
Chapter 1: INTRODUCTION
1.1. Report description
1.2. Key Benefits For Stakeholders
1.3. Key Market Segment
1.4. Research methodology
1.4.1. Secondary research
1.4.2. Primary research
1.4.3. Analyst tools & models
Chapter 2: EXECUTIVE SUMMARY
2.1. CXO perspective
Chapter 3: MARKET OVERVIEW
3.1. Market definition and scope
3.2. Key findings
3.2.1. Top investment pockets
3.2.2. Top winning strategies
3.3. Porter's five forces analysis
3.4. Top players positioning
3.5. Market dynamics
3.5.1. Drivers
3.5.1.1. Growth in global construction sector
3.5.1.2. Rapid industrialization coupled with increasing infrastructural spending
3.5.1.3. Retrofit and replacement of existing equipment
3.5.2. Restraints
3.5.2.1. Oil leakages and timely maintenance
3.5.2.2. Costly as compared to pneumatic cylinders
3.5.3. Opportunities
3.5.3.1. Extensive range of applications
3.5.3.2. Increasing demand for material handling equipments
Chapter 4: Hydraulic cylinders MARKET, BY FUNCTION
4.1. Overview
4.1.1. Market size and forecast
4.2. Single acting hydraulic cylinders
4.2.1. Key market trends, growth factors, and opportunities
4.2.2. Market size and forecast
4.2.3. Market analysis, by country
4.3. Double acting hydraulic cylinders
4.3.1. Key market trends, growth factors, and opportunities
4.3.2. Market size and forecast
4.3.3. Market analysis, by country
Chapter 5: HYDRAULIC CYLINDERS MARKET, BY DESIGN
5.1. Overview
5.1.1. Market size and forecast
5.2. Tie-rod hydraulic cylinders
5.2.1. Key market trends, growth factors, and opportunities
5.2.2. Market size and forecast
5.2.3. Market analysis, by country
5.3. Welded hydraulic cylinders
5.3.1. Key market trends, growth factors, and opportunities
5.3.2. Market size and forecast
5.3.3. Market analysis, by country
Chapter 6: HYDRAULIC CYLINDERS MARKET, BY BORE SIZE
6.1. Overview
6.1.1. Market size and forecast
6.2. Less than 50mm hydraulic cylinders
6.2.1. Key market trends, growth factors, and opportunities
6.2.2. Market size and forecast
6.2.3. Market analysis, by country
6.3. 51mm to 100mm hydraulic cylinders
6.3.1. Key market trends, growth factors, and opportunities
6.3.2. Market size and forecast
6.3.3. Market analysis, by country
6.4. 101mm to 150 mm hydraulic cylinders
6.4.1. Key market trends, growth factors, and opportunities
6.4.2. Market size and forecast
6.4.3. Market analysis, by country
6.5. Greater than 151mm hydraulic cylinders
6.5.1. Key market trends, growth factors, and opportunities
6.5.2. Market size and forecast
6.5.3. Market analysis, by country
Chapter 7: HYDRAULIC CYLINDERS MARKET, BY REGION
7.1. Overview
7.1.1. Market size and forecast
7.2. North America
7.2.1. Key market trends and opportunities
7.2.2. Market size and forecast, by function
7.2.3. Market size and forecast by design
7.2.4. Market size and forecast by bore size
7.2.5. Market size and forecast by country
7.2.5.1. U.S.
7.2.5.1.1. U.S. Market size and forecast, by function
7.2.5.1.2. U.S. Market size and forecast, by design
7.2.5.1.3. U.S. Market size and forecast, by bore size
7.2.5.2. Canada
7.2.5.2.1. Canada Market size and forecast, by function
7.2.5.2.2. Canada Market size and forecast, by design
7.2.5.2.3. Canada Market size and forecast, by bore size
7.2.5.3. Mexico
7.2.5.3.1. Mexico Market size and forecast, by function
7.2.5.3.2. Mexico Market size and forecast, by design
7.2.5.3.3. Mexico Market size and forecast, by bore size
7.3. Europe
7.3.1. Key market trends and opportunities
7.3.2. Market size and forecast, by function
7.3.3. Market size and forecast by design
7.3.4. Market size and forecast by bore size
7.3.5. Market size and forecast by country
7.3.5.1. Germany
7.3.5.1.1. Germany Market size and forecast, by function
7.3.5.1.2. Germany Market size and forecast, by design
7.3.5.1.3. Germany Market size and forecast, by bore size
7.3.5.2. UK
7.3.5.2.1. UK Market size and forecast, by function
7.3.5.2.2. UK Market size and forecast, by design
7.3.5.2.3. UK Market size and forecast, by bore size
7.3.5.3. France
7.3.5.3.1. France Market size and forecast, by function
7.3.5.3.2. France Market size and forecast, by design
7.3.5.3.3. France Market size and forecast, by bore size
7.3.5.4. Russia
7.3.5.4.1. Russia Market size and forecast, by function
7.3.5.4.2. Russia Market size and forecast, by design
7.3.5.4.3. Russia Market size and forecast, by bore size
7.3.5.5. Rest of Europe
7.3.5.5.1. Rest of Europe Market size and forecast, by function
7.3.5.5.2. Rest of Europe Market size and forecast, by design
7.3.5.5.3. Rest of Europe Market size and forecast, by bore size
7.4. Asia-Pacific
7.4.1. Key market trends and opportunities
7.4.3. Market size and forecast, by function
7.4.4. Market size and forecast by design
7.4.5. Market size and forecast by bore size
7.4.6. Market size and forecast by country
7.4.6.1. China
7.4.6.1.1. China Market size and forecast, by function
7.4.6.1.2. China Market size and forecast, by design
7.4.6.1.3. China Market size and forecast, by bore size
7.4.6.2. Japan
7.4.6.2.1. Japan Market size and forecast, by function
7.4.6.2.2. Japan Market size and forecast, by design
7.4.6.2.3. Japan Market size and forecast, by bore size
7.4.6.3. India
7.4.6.3.1. India Market size and forecast, by function
7.4.6.3.2. India Market size and forecast, by design
7.4.6.3.3. India Market size and forecast, by bore size
7.4.6.4. South Korea
7.4.6.4.1. South Korea Market size and forecast, by function
7.4.6.4.2. South Korea Market size and forecast, by design
7.4.6.4.3. South Korea Market size and forecast, by bore size
7.4.6.5. Rest of Asia-Pacific
7.4.6.5.1. Rest of Asia-Pacific Market size and forecast, by function
7.4.6.5.2. Rest of Asia-Pacific Market size and forecast, by design
7.4.6.5.3. Rest of Asia-Pacific Market size and forecast, by bore size
7.5. LAMEA
7.5.1. Key market trends and opportunities
7.5.2. Market size and forecast, by function
7.5.3. Market size and forecast by design
7.5.4. Market size and forecast by bore size
7.5.5. Market size and forecast by country
7.5.5.1. Latin America
7.5.5.1.1. Latin America Market size and forecast, by function
7.5.5.1.2. Latin America Market size and forecast, by design
7.5.5.1.3. Latin America Market size and forecast, by bore size
7.5.5.2. Middle East
7.5.5.2.1. Middle East Market size and forecast, by function
7.5.5.2.2. Middle East Market size and forecast, by design
7.5.5.2.3. Middle East Market size and forecast, by bore size
7.5.5.3. Africa
7.5.5.3.1. Africa Market size and forecast, by function
7.5.5.3.2. Africa Market size and forecast, by design
7.5.5.3.3. Africa Market size and forecast, by bore size
Chapter 8: Company profiles
8.1. Actuant Corporation
8.1.1. Company overview
8.1.2. Company snapshot
8.1.3. Operating business segments
8.1.4. Product portfolio
8.1.5. Business performance
8.2. Caterpillar Inc.
8.2.1. Company overview
8.2.2. Company snapshot
8.2.3. Operating business segments
8.2.4. Product portfolio
8.2.5. Business performance
8.3. Eaton Corporation Plc
8.3.1. Company overview
8.3.2. Company snapshot
8.3.3. Operating business segments
8.3.4. Product portfolio
8.3.5. Business performance
8.3.6. Key strategic moves and developments
8.4. JARP Industries, Inc
8.4.1. Company overview
8.4.2. Company snapshot
8.4.3. Product portfolio
8.4.4. Key strategic moves and developments
8.5. Hengli hydraulic
8.5.1. Company overview
8.5.2. Company snapshot
8.5.3. Product portfolio
8.6. Kawasaki Heavy Industries Limited
8.6.1. Company overview
8.6.2. Company snapshot
8.6.3. Operating business segments
8.6.4. Product portfolio
8.6.5. Business performance
8.7. Parker Hannifin Corporation
8.7.1. Company overview
8.7.2. Company snapshot
8.7.3. Operating business segments
8.7.4. Product portfolio
8.7.5. Business performance
8.7.6. Key strategic moves and developments
8.8. Robert Bosch GmbH (Bosch Rexroth AG)
8.8.1. Company overview
8.8.2. Company snapshot
8.8.3. Operating business segments
8.8.4. Product portfolio
8.8.5. Business performance
8.9. Texas Hydraulics, Inc
8.9.1. Company overview
8.9.2. Company snapshot
8.9.3. Product portfolio
8.9.4. Key strategic moves and developments
8.10. Wipro Limited
8.10.1. Company overview
8.10.2. Company snapshot
8.10.3. Operating business segments
8.10.4. Product portfolio
8.10.5. Business performance
LIST OF TABLES
TABLE 01. GLOBAL HYDRAULIC CYLINDERS MARKET, BY FUNCTION, 2020-2030 ($MILLION)
TABLE 02. SINGLE ACTING HYDRAULIC CYLINDERS MARKET, BY REGION, 2020-2030 ($MILLION)
TABLE 03. DOUBLE ACTING HYDRAULIC CYLINDERS MARKET, BY REGION, 2020-2030 ($MILLION)
TABLE 04. GLOBAL HYDRAULIC CYLINDERS MARKET, BY DESIGN, 2020-2030 ($MILLION)
TABLE 05. TIE-ROD HYDRAULIC CYLINDERS MARKET, BY REGION, 2020-2030 ($MILLION)
TABLE 06. WELDED HYDRAULIC CYLINDERS MARKET, BY REGION, 2020-2030 ($MILLION)
TABLE 07. GLOBAL HYDRAULIC CYLINDERS MARKET, BY BORE SIZE, 2020-2030 ($MILLION)
TABLE 08. LESS THAN 50MM HYDRAULIC CYLINDERS MARKET, BY REGION, 2020-2030 ($MILLION)
TABLE 09. 51MM TO 100MM HYDRAULIC CYLINDERS MARKET, BY REGION, 2020-2030 ($MILLION)
TABLE 10. 101MM TO 150 MM HYDRAULIC CYLINDERS MARKET, BY REGION, 2020-2030 ($MILLION)
TABLE 11. GREATER THAN 151MM HYDRAULIC CYLINDERS MARKET, BY REGION, 2020-2030 ($MILLION)
TABLE 12. HYDRAULIC CYLINDERS MARKET, BY REGION, 2020-2030 ($MILLION)
TABLE 13. NORTH AMERICA HYDRAULIC CYLINDERS MARKET, BY FUNCTION, 2020-2030 ($MILLION)
TABLE 14. NORTH AMERICA HYDRAULIC CYLINDERS MARKET, BY DESIGN, 2020-2030 ($MILLION)
TABLE 15. NORTH AMERICA HYDRAULIC CYLINDERS MARKET, BY BORE SIZE, 2020-2030 ($MILLION)
TABLE 16. NORTH AMERICA HYDRAULIC CYLINDERS MARKET, BY COUNTRY, 2020-2030 ($MILLION)
TABLE 17. U.S HYDRAULIC CYLINDERS MARKET, BY FUNCTION, 2020-2030 ($MILLION)
TABLE 18. U.S HYDRAULIC CYLINDERS MARKET, BY DESIGN, 2020-2030 ($MILLION)
TABLE 19. U.S HYDRAULIC CYLINDERS MARKET, BY BORE SIZE, 2020-2030 ($MILLION)
TABLE 20. CANADA HYDRAULIC CYLINDERS MARKET, BY FUNCTION, 2020-2030 ($MILLION)
TABLE 21. CANADA HYDRAULIC CYLINDERS MARKET, BY DESIGN, 2020-2030 ($MILLION)
TABLE 22. CANADA HYDRAULIC CYLINDERS MARKET, BY BORE SIZE, 2020-2030 ($MILLION)
TABLE 23. MEXICO HYDRAULIC CYLINDERS MARKET, BY FUNCTION, 2020-2030 ($MILLION)
TABLE 24. MEXICO HYDRAULIC CYLINDERS MARKET, BY DESIGN, 2020-2030 ($MILLION)
TABLE 25. MEXICO HYDRAULIC CYLINDERS MARKET, BY BORE SIZE, 2020-2030 ($MILLION)
TABLE 26. EUROPE HYDRAULIC CYLINDERS MARKET, BY FUNCTION, 2020-2030 ($MILLION)
TABLE 27. EUROPE HYDRAULIC CYLINDERS MARKET, BY DESIGN, 2020-2030 ($MILLION)
TABLE 28. EUROPE HYDRAULIC CYLINDERS MARKET, BY BORE SIZE, 2020-2030 ($MILLION)
TABLE 29. EUROPE HYDRAULIC CYLINDERS MARKET, BY COUNTRY, 2020-2030 ($MILLION)
TABLE 30. GERMANY HYDRAULIC CYLINDERS MARKET, BY FUNCTION, 2020-2030 ($MILLION)
TABLE 31. GERMANY HYDRAULIC CYLINDERS MARKET, BY DESIGN, 2020-2030 ($MILLION)
TABLE 32. GERMANY HYDRAULIC CYLINDERS MARKET, BY BORE SIZE, 2020-2030 ($MILLION)
TABLE 33. UK HYDRAULIC CYLINDERS MARKET, BY FUNCTION, 2020-2030 ($MILLION)
TABLE 34. UK HYDRAULIC CYLINDERS MARKET, BY DESIGN, 2020-2030 ($MILLION)
TABLE 35. UK HYDRAULIC CYLINDERS MARKET, BY BORE SIZE, 2020-2030 ($MILLION)
TABLE 36. FRANCE HYDRAULIC CYLINDERS MARKET, BY FUNCTION, 2020-2030 ($MILLION)
TABLE 37. FRANCE HYDRAULIC CYLINDERS MARKET, BY DESIGN, 2020-2030 ($MILLION)
TABLE 38. FRANCE HYDRAULIC CYLINDERS MARKET, BY BORE SIZE, 2020-2030 ($MILLION)
TABLE 39. RUSSIA HYDRAULIC CYLINDERS MARKET, BY FUNCTION, 2020-2030 ($MILLION)
TABLE 40. RUSSIA HYDRAULIC CYLINDERS MARKET, BY DESIGN, 2020-2030 ($MILLION)
TABLE 41. RUSSIA HYDRAULIC CYLINDERS MARKET, BY BORE SIZE, 2020-2030 ($MILLION)
TABLE 42. REST OF EUROPE HYDRAULIC CYLINDERS MARKET, BY FUNCTION, 2020-2030 ($MILLION)
TABLE 43. REST OF EUROPE HYDRAULIC CYLINDERS MARKET, BY DESIGN, 2020-2030 ($MILLION)
TABLE 44. REST OF EUROPE HYDRAULIC CYLINDERS MARKET, BY BORE SIZE, 2020-2030 ($MILLION)
TABLE 45. ASIA-PACIFIC HYDRAULIC CYLINDERS MARKET, BY FUNCTION, 2020-2030 ($MILLION)
TABLE 46. ASIA-PACIFIC HYDRAULIC CYLINDERS MARKET, BY DESIGN, 2020-2030 ($MILLION)
TABLE 47. ASIA-PACIFIC HYDRAULIC CYLINDERS MARKET, BY BORE SIZE, 2020-2030 ($MILLION)
TABLE 48. ASIA-PACIFIC HYDRAULIC CYLINDERS MARKET, BY COUNTRY, 2020-2030 ($MILLION)
TABLE 49. CHINA HYDRAULIC CYLINDERS MARKET, BY FUNCTION, 2020-2030 ($MILLION)
TABLE 50. CHINA HYDRAULIC CYLINDERS MARKET, BY DESIGN, 2020-2030 ($MILLION)
TABLE 51. CHINA HYDRAULIC CYLINDERS MARKET, BY BORE SIZE, 2020-2030 ($MILLION)
TABLE 52. JAPAN HYDRAULIC CYLINDERS MARKET, BY FUNCTION, 2020-2030 ($MILLION)
TABLE 53. JAPAN HYDRAULIC CYLINDERS MARKET, BY DESIGN, 2020-2030 ($MILLION)
TABLE 54. JAPAN HYDRAULIC CYLINDERS MARKET, BY BORE SIZE, 2020- 2030 ($MILLION)
TABLE 55. INDIA HYDRAULIC CYLINDERS MARKET, BY FUNCTION, 2020-2030 ($MILLION)
TABLE 56. INDIA HYDRAULIC CYLINDERS MARKET, BY DESIGN, 2020-2030 ($MILLION)
TABLE 57. INDIA HYDRAULIC CYLINDERS MARKET, BY BORE SIZE, 2020-2030 ($MILLION)
TABLE 58. SOUTH KOREA HYDRAULIC CYLINDERS MARKET, BY FUNCTION, 2020-2030 ($MILLION)
TABLE 59. SOUTH KOREA HYDRAULIC CYLINDERS MARKET, BY DESIGN, 2020-2030 ($MILLION)
TABLE 60. SOUTH KOREA HYDRAULIC CYLINDERS MARKET, BY BORE SIZE, 2020-2030 ($MILLION)
TABLE 61. REST OF ASIA-PACIFIC HYDRAULIC CYLINDERS MARKET, BY FUNCTION, 2020-2030 ($MILLION)
TABLE 62. REST OF ASIA PACIFIC HYDRAULIC CYLINDERS MARKET, BY DESIGN, 2020-2030 ($MILLION)
TABLE 63. REST OF ASIA PACIFIC HYDRAULIC CYLINDERS MARKET, BY BORE SIZE, 2020-2030 ($MILLION)
TABLE 64. LAMEA HYDRAULIC CYLINDERS MARKET, BY FUNCTION, 2020-2030 ($MILLION)
TABLE 65. LAMEA HYDRAULIC CYLINDERS MARKET, BY DESIGN, 2020-2030 ($MILLION)
TABLE 66. LAMEA HYDRAULIC CYLINDERS MARKET, BY BORE SIZE, 2020-2030 ($MILLION)
TABLE 67. LAMEA HYDRAULIC CYLINDERS MARKET, BY COUNTRY, 2020-2030 ($MILLION)
TABLE 68. LATIN AMERICA HYDRAULIC CYLINDERS MARKET, BY FUNCTION, 2020-2030 ($MILLION)
TABLE 69. LATIN AMERICA HYDRAULIC CYLINDERS MARKET, BY DESIGN, 2020-2030 ($MILLION)
TABLE 70. LATIN AMERICA HYDRAULIC CYLINDERS MARKET, BY BORE SIZE, 2020-2030 ($MILLION)
TABLE 71. MIDDILE EAST HYDRAULIC CYLINDERS MARKET, BY FUNCTION, 2020-2030 ($MILLION)
TABLE 72. MIDDLE EAST HYDRAULIC CYLINDERS MARKET, BY DESIGN, 2020-2030 ($MILLION)
TABLE 73. MIDDLE EAST HYDRAULIC CYLINDERS MARKET, BY BORE SIZE, 2020-2030 ($MILLION)
TABLE 74. AFRICA HYDRAULIC CYLINDERS MARKET, BY FUNCTION, 2020-2030 ($MILLION)
TABLE 75. AFRICA HYDRAULIC CYLINDERS MARKET, BY DESIGN, 2020-2030 ($MILLION)
TABLE 76. AFRICA HYDRAULIC CYLINDERS MARKET, BY BORE SIZE, 2020-2030 ($MILLION)
TABLE 77. ACTUANT CORPORATION: COMPANY SNAPSHOT
TABLE 78. ACTUANT CORPORATION: OPERATING SEGMENTS
TABLE 79. ACTUANT CORPORATION: PRODUCT PORTFOLIO
TABLE 80. CATERPILLAR: COMPANY SNAPSHOT
TABLE 81. CATERPILLAR: OPERATING SEGMENTS
TABLE 82. CATERPILLAR: PRODUCT PORTFOLIO
TABLE 83. EATON CORPORATION PLC: COMPANY SNAPSHOT
TABLE 84. EATON CORPORATION PLC: OPERATING SEGMENTS
TABLE 85. EATON CORPORATION PLC: PRODUCT PORTFOLIO
TABLE 86. JARP INDUSTRIES, INC: COMPANY SNAPSHOT
TABLE 87. JARP INDUSTRIES, INC: PRODUCT PORTFOLIO
TABLE 88. HENGLI HYDRAULIC: COMPANY SNAPSHOT
TABLE 89. HENGLI HYDRAULIC: PRODUCT PORTFOLIO
TABLE 90. KAWASAKI: COMPANY SNAPSHOT
TABLE 91. KAWASAKI: OPERATING SEGMENTS
TABLE 92. KAWASAKI: PRODUCT PORTFOLIO
TABLE 93. PARKER HANNIFIN CORPORATION: COMPANY SNAPSHOT
TABLE 94. PARKER HANNIFIN CORPORATION: OPERATING SEGMENTS
TABLE 95. PARKER HANNIFIN CORPORATION: PRODUCT PORTFOLIO
TABLE 96. ROBERT BOSCH GMBH: PRODUCT PORTFOLIO
TABLE 97. TEXAS HYDRAULICS, INC: COMPANY SNAPSHOT
TABLE 98. TEXAS HYDRAULICS, INC: PRODUCT PORTFOLIO
TABLE 99. WIPRO LIMITED: COMPANY SNAPSHOT
TABLE 100. WIPRO LIMITED: OPERATING SEGMENTS
TABLE 101. WIPRO LIMITED: PRODUCT PORTFOLIO
LIST OF FIGURES
FIGURE 01. GLOBAL HYDRAULIC CYLINDERS MARKET, 2020-2030
FIGURE 02. GLOBAL HYDRAULIC CYLINDERS MARKET: KEY PLAYERS
FIGURE 03. TOP INVESTMENT POCKETS
FIGURE 04. TOP WINNING STRATEGIES, BY YEAR, 2018-2020*
FIGURE 05. TOP WINNING STRATEGIES, BY DEVELOPMENT, 2018-2020* (%)
FIGURE 06. TOP WINNING STRATEGIES, BY COMPANY, 2018-2020*
FIGURE 07. LOW BARGAINING POWER OF SUPPLIERS
FIGURE 08. LOW TO MODERATE BARGAINING POWER OF BUYERS
FIGURE 09. HIGH THREAT OF SUBSTITUTES
FIGURE 10. HIGH THREAT OF NEW ENTRANTS
FIGURE 11. MODERATE COMPETITIVE RIVALRY
FIGURE 12. TOP PLAYERS POSITIONING
FIGURE 13. DRIVERS, RESTRAINTS, AND OPPORTUNITIES
FIGURE 14. COMPARATIVE SHARE ANALYSIS OF SINGLE ACTING HYDRAULIC CYLINDERS, BY COUNTRY, 2020 & 2030 (%)
FIGURE 15. COMPARATIVE SHARE ANALYSIS OF DOUBLE ACTING, BY COUNTRY, 2020 & 2030 (%)
FIGURE 16. COMPARATIVE SHARE ANALYSIS OF TIE-ROD HYDRAULIC CYLINDERS, BY COUNTRY, 2020 & 2030 (%)
FIGURE 17. COMPARATIVE SHARE ANALYSIS OF WELDED HYDRAULIC CYLINDERS, BY COUNTRY, 2020 & 2030 (%)
FIGURE 18. COMPARATIVE SHARE ANALYSIS OF LESS THAN 50MM HYDRAULIC CYLINDERS, BY COUNTRY, 2020 & 2030 (%)
FIGURE 19. COMPARATIVE SHARE ANALYSIS OF 51MM TO 100MM HYDRAULIC CYLINDERS, BY COUNTRY, 2020 & 2030 (%)
FIGURE 20. COMPARATIVE SHARE ANALYSIS OF 101MM TO 150 MM HYDRAULIC CYLINDERS, BY COUNTRY, 2020 & 2030 (%)
FIGURE 21. COMPARATIVE SHARE ANALYSIS OF GREATER THAN 151 MM HYDRAULIC CYLINDERS, BY COUNTRY, 2020 & 2030 (%)
FIGURE 22. U.S. HYDRAULIC CYLINDERS MARKET REVENUE, 2020-2030 ($MILLION)
FIGURE 23. CANADA HYDRAULIC CYLINDERS MARKET REVENUE, 2020-2030 ($MILLION)
FIGURE 24. MEXICO HYDRAULIC CYLINDERS MARKET REVENUE, 2020-2030 ($MILLION)
FIGURE 25. GERMANY HYDRAULIC CYLINDERS MARKET REVENUE, 2020-2030 ($MILLION)
FIGURE 26. UK. HYDRAULIC CYLINDERS MARKET REVENUE, 2020-2030 ($MILLION)
FIGURE 27. FRANCE. HYDRAULIC CYLINDERS MARKET REVENUE, 2020-2030 ($MILLION)
FIGURE 28. RUSSIA HYDRAULIC CYLINDERS MARKET REVENUE, 2020-2030 ($MILLION)
FIGURE 29. REST OF EUROPE HYDRAULIC CYLINDERS MARKET REVENUE, 2020-2030 ($MILLION)
FIGURE 30. CHINA HYDRAULIC CYLINDERS MARKET REVENUE, 2020-2030 ($MILLION)
FIGURE 31. JAPAN. HYDRAULIC CYLINDERS MARKET REVENUE, 2020-2030 ($MILLION)
FIGURE 32. INDIA. HYDRAULIC CYLINDERS MARKET REVENUE, 2020-2030 ($MILLION)
FIGURE 33. SOUTH KOREA. HYDRAULIC CYLINDERS MARKET REVENUE, 2020-2030 ($MILLION)
FIGURE 34. REST OF ASIA-PACIFIC HYDRAULIC CYLINDERS MARKET REVENUE, 2020-2030 ($MILLION)
FIGURE 35. LATIN AMERICA HYDRAULIC CYLINDERS MARKET REVENUE, 2020-2030 ($MILLION)
FIGURE 36. MIDDLE EAST HYDRAULIC CYLINDERS MARKET REVENUE, 2020-2030 ($MILLION)
FIGURE 37. AFRICA HYDRAULIC CYLINDERS MARKET REVENUE, 2020-2030 ($MILLION)
FIGURE 38. ACTUANT CORPORATION: REVENUE, 2018-2020 ($MILLION)
FIGURE 39. ACTUANT CORPORATION: REVENUE SHARE BY SEGMENT, 2020 (%)
FIGURE 40. ACTUANT CORPORATION: REVENUE SHARE BY REGION, 2020 (%)
FIGURE 41. CATERPILLAR: NET SALES, 2018-2020 ($MILLION)
FIGURE 42. CATERPILLAR: REVENUE SHARE BY SEGMENT, 2020 (%)
FIGURE 43. CATERPILLAR: REVENUE SHARE BY REGION, 2020 (%)
FIGURE 44. EATON CORPORATION PLC: REVENUE, 2018-2020 ($MILLION)
FIGURE 45. EATON CORPORATION PLC: REVENUE SHARE BY SEGMENT, 2020 (%)
FIGURE 46. EATON CORPORATION PLC: REVENUE SHARE BY REGION, 2020 (%)
FIGURE 47. KAWASAKI: NET SALES, 2018-2020 ($MILLION)
FIGURE 48. KAWASAKI: REVENUE SHARE BY SEGMENT, 2020 (%)
FIGURE 49. KAWASAKI: REVENUE SHARE BY REGION, 2020 (%)
FIGURE 50. PARKER HANNIFIN CORPORATION: REVENUE, 2018-2020 ($MILLION)
FIGURE 51. PARKER HANNIFIN CORPORATION: REVENUE SHARE BY SEGMENT, 2020 (%)
FIGURE 52. PARKER HANNIFIN CORPORATION: REVENUE SHARE BY REGION, 2020 (%)
FIGURE 53. ROBERT BOSCH GMBH: REVENUE, 2018-2020 ($MILLION)
FIGURE 54. ROBERT BOSCH GMBH: REVENUE BY SEGMENT, 2020 (%)
FIGURE 55. ROBERT BOSCH GMBH: REVENUE SHARE BY REGION, 2020 (%)
FIGURE 56. WIPRO LIMITED: REVENUE, 2020-2020 ($MILLION)
FIGURE 57. WIPRO LIMITED: REVENUE SHARE BY SEGMENT, 2020 (%)
FIGURE 58. WIPRO LIMITED: REVENUE SHARE BY REGION, 2020 (%)
Hydraulic cylinders, also known as hydraulic pumps, are assemble parts used in hydraulic power transfer systems. They help transfer power in applications ranging from construction equipment to aviation. These cylinders are available in several configurations and functions, each suited for a particular application. Furthermore, infrastructural development and rapid industrialization in developing nations, are anticipated to drive the growth of the global hydraulic cylinders market. A growth in civil and military aviation in developing nations, such as India, Brazil, Africa, and others are estimated to augment the growth of the global hydraulic cylinders market.
Rise in demand for hydraulic cylinders in various industry verticals, such as food & beverages, medical, and pharmaceuticals, fuels the growth of the hydraulic cylinders market. Major players, such as Parker Hannifin Corporation, Bosch Rexroth, and others are adopting product launch and acquisition, as key developmental strategies to improve the product portfolio of hydraulic cylinders. For instance, in March 2019, Bosch Rexroth, a subsidiary of Robert Bosch GmbH, expanded its new manufacturing facility in China. The 24,000 square meter facility is projected to feature connected manufacturing and digital services to support employees and customers. The business expansion aimed to improve the product portfolio of hydraulic cylinders.
On the contrary, increase in concerns over oil leaks and availability of substitutes, such as pneumatic cylinders, are anticipated to restraint the growth of the global hydraulic cylinders market. Furthermore, increase in demand for hydraulic cylinders in lifting equipment in the shipping industry is anticipated to provide lucrative opportunities for the growth of the global hydraulic cylinders market during the forecast period.
A. The Global hydraulic cylinders market size was valued at $14,070.0 million in 2020.
A. Based on function, double acting segment holds the maximum market share of the Global hydraulic cylinders market in 2020.
A. The Global hydraulic cylinders market is projected to reach $21,243.2 million by 2030.
A. A rise in use of hydraulic cylinders in the automotive sectors, and mining equipment, are the key trends in the Global hydraulic cylinders market.
A. The acquisition is key growth strategy of Global hydraulic cylinders industry players.
A. The company profile has been selected on factors such as geographical presence, market dominance (in terms of revenue and volume sales), various strategies and recent developments.
A. Fluctuation in raw material prices are effecting factors for global hydraulic cylinders market.
A. The application of hydraulic cylinders system includes automotive, and vehicle sector.
Start reading instantly.
This Report and over 13,000+ thousand more Reports, Available with Avenue Library. T&C*.
Enterprise
License/PDF
*Taxes/Fees, if applicable will be added during checkout. All prices in USD
To ensure high-level data integrity, accurate analysis, and impeccable forecasts
For complete satisfaction
On-demand customization of scope of the report to exactly meet your needs
Targeted market view to provide pertinent information and save time of readers
Get insights on topics that are crucial for your business. Stay abreast of your interest areas.
To ensure high-level data integrity, accurate analysis, and impeccable forecasts
For complete satisfaction
On-demand customization of scope of the report to exactly meet your needs
Targeted market view to provide pertinent information and save time of readers