0
2023
Hyperlocal Services Market

Hyperlocal Services Market

by Nature (Goods Delivery, Utility Services), by Type (Food Ordering, Grocery Ordering, Home Utility Service, Logistic Service Providers, Pharmaceuticals, Pet Food and Medicines, Clothing and Accessories, Others): Global Opportunity Analysis and Industry Forecast, 2021-2031

✷  Report Code: A03506
Feb 2023 | Pages: 341
Tables: 149
Charts: 58
  • Formats*:

  • pdf

    Single User License, Five User
    License & Enterprise User License

  • xls

    Data Pack Excel License

  • ppt

    It comes with the additional cost
    of $2500.00 contact sales.


Hyperlocal Services Market Research, 2031

The global hyperlocal services market was valued at $1.5 trillion in 2021, and is projected to reach $5.9 trillion by 2031, growing at a CAGR of 14.4% from 2022 to 2031.
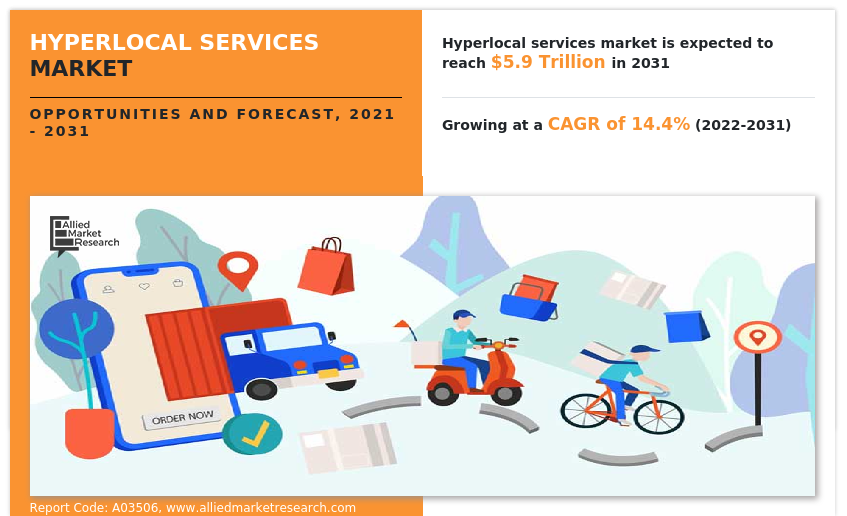
Hyperlocal utility services are expected to gain major traction in developing countries during the forecast period; this is majorly attributed to growing disposable income, high working age population, and high inclination to have comfort providing services which creates demand for the various utility services including home services, logistic, and personal tuitions services.

Hyperlocal Services Market

The hyperlocal services market is segmented into Nature and Type.

Hyperlocal services market companies provide delivery of a goods and utility services to consumers, goods delivery including groceries, food, medicines, personal items and others, and utility services includes plumbing, home cleaning, lawn care, electrical and drainage. All these goods and services are provided through network of boys from business or individuals in local areas.

Hyperlocal services industry platforms help restaurants, hotel, fast food outlets, fruit or vegetable, seafood, meat, and other retailers to effectively engage & manage their business without worrying about delivery. Easy accessibility to the internet, smartphones proliferation has been primarily boosting the demand for hyperlocal services. Growing working population and rising income levels are propelling the online food and grocery delivery market. Furthermore, owing to increase in cases of COVID-19, some of the leading players such as McDonald's Corporation, Domino’s Pizza Inc. and Zomato, have introduced contactless delivery services.

This is expected to boost the demand for the hyperlocal services market. E-commerce and M-commerce platforms are increasing adopting and acquiring the hyperlocal services industry to reduce delivery cost and time. Growth in e-commerce business creates extensive demand for the hyperlocal services. For instance, according to India Brand Equity Foundation, The Indian e-commerce market is expected to grow to $200 billion by 2026, which significantly helps the hyperlocal services market growth.

Home utility services include home cleaning, home remolding, roofing, lawn care, personal care, electrical, and appliance repair. These home utility services are in huge demand in developed countries owing to lack of time and domestic help but in developing countries its demand is significantly growing during the forecast period.

Changes in food habits and busy lifestyle of consumers have led to an increase in demand for various hyperlocal services such as food delivery, grocery ordering, home utility services, furniture delivery, and drug delivery. For instance, Uber Eats accounted for $4.8 billion in 2020, a 152% growth year over year. As of May 2021, the company controlled over 25% of the food delivery market in the U.S. with the average delivery time of 30 minutes. Therefore, quick delivery and busy lifestyle is driving the market growth altogether. In addition, rapid changes in the supporting factors such as disposable income, consumer preferences, and digitization result in rise in demand for hyperlocal services market share.

Moreover, Consistent increase in the female working population in developing economies has fueled the demand for online food, grocery and home utility services. Furthermore, rise in number of working women has led to lack of time for cooking food and other home services including, home cleaning, plumbing, lawn care, moving, and carpet cleaning, which creates immense demand for hyperlocal services market forecast.

The increase in number of smartphone users serves as the major growth enabler for hyperlocal services market size to grow. This is attributed to increase in dependency on smartphones for daily activities and needs such as billing, money transfer, and other service such as bus booking and movie ticket booking. The demand for various hyperlocal services including food ordering, grocery ordering, drug delivery, home services has increased considerably, due to surge in number of netizens across the globe, which is anticipated to offer lucrative opportunities for new entrants who plans to deal in hyperlocal market.

As often mentioned, reason for consumers not purchasing from internet vendors, is the lack of trust. It is very difficult for people trust online shopping without physical clues and physical interaction in the online environment market. Additionally, growing cybercrimes, fraud are led to decrease the trust on online shopping or purchasing, which in turn hampers the growth of hyperlocal service market during the forecast period. Growing cybercrime leads to huge financial losses for every company and consumers, which limits the sales of goods and services through internet. For instance, in November 13 2020, Cyber security Ventures predicted that cybercrime will cost the world $6 trillion annually by 2021, up from $3 trillion in 2015 and is likely to cost $10.5 trillion by 2025.
Hyperlocal Services Market

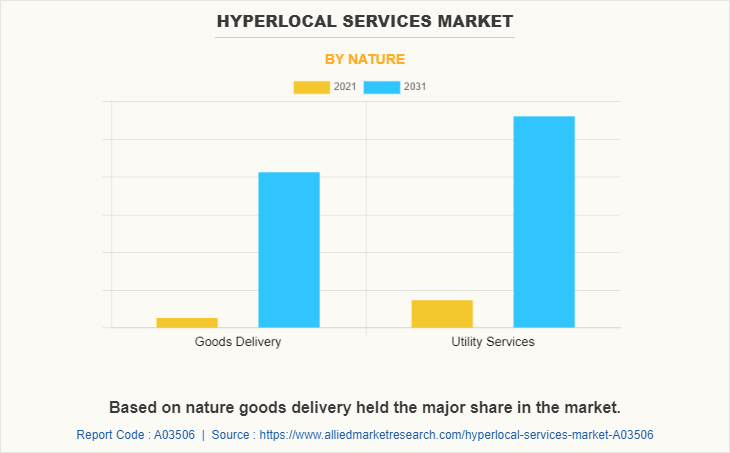
Based on nature, the utility services segment was valued at $862.8 billion in 2021, and is expected to reach $3298.7 billion by 2031, registering a CAGR of 14.1% from 2022 to 2031. Utility services include home services, logistic services, and tuition services. For instance, home moving, plumbing, lawn care, appliance repair, house cleaning, roofing, fencing and electrical are some of the home services gaining huge demand from consumer end. Growing urbanization, busy lifestyle and increasing working age population leads to high demand for home utility services, whereas, increasing working population of women has triggered the growth of the hyperlocal-based utility services.

Furthermore, increased utility of smartphones and its user base is projected to offer lucrative opportunities for offline services providers to use online platforms to boost their business. Based on region, Europe has gained significant market share in hyperlocal service in 2021 and is expected to continue its market holding during the forecast period. This was attributed to the presence of international brands in the region, and growing funding for the start-up business. Big giants in Europe have been consistently expanding their market share by acquiring hyperlocal services business, which further adds to the growth of the Europe hyperlocal service market.
Hyperlocal Services Market

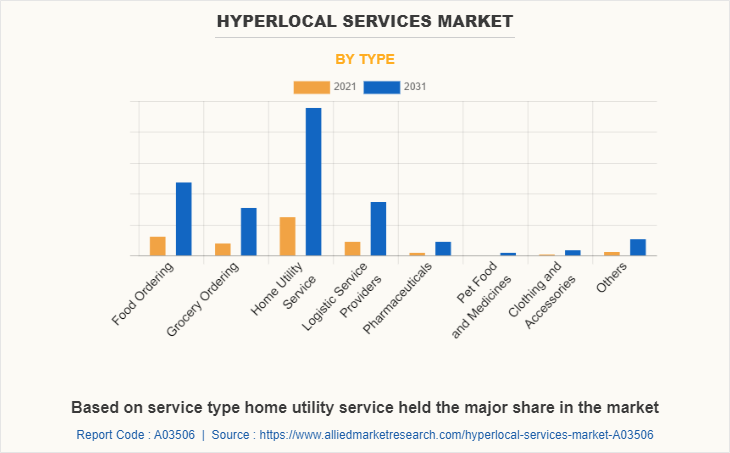
Based on type, the food ordering segment was valued at $306.3 billion in 2021, and is projected to reach $1189.7 billion by 2031, registering a CAGR of 14.3% from 2022 to 2031. This is majorly attributed to extensive promotion of the online food delivery platforms through discounts, referring awards, and TV and social media advertisements. Many companies are expanding their market share by applying various strategies such as merger, acquisitions, and partnership, which likely to boost the growth of the online food delivery market during the forecast period. For instance, Zomato, an Indian food delivery service company, acquired Indian penetration of Uber Eats for $350 million. This acquisition deal is expected to help Zomato to cover more than 50% of market share in India.
Hyperlocal Services Market

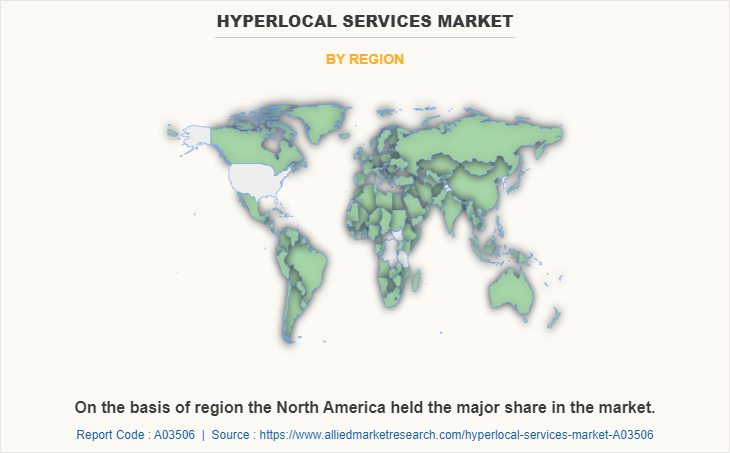
The North America online hyper-local service market held the dominant share in 2021, and is anticipated to hold its position throughout the forecast period. Increasing adoption of advanced technology in daily life is the major driving factor in North America and is expected to fuel the overall market growth of the online hyper-local services market during the forecast period. In the U.S., UberEats is the fastest-growing meal delivery service, reaching out to industry leader GrubHub. Growing number of start-up business and their funding partners in U.S. is expected to boost the growth of the hyperlocal service market during the forecast period. For instance, according to NASSCOM, in 2020, number of unicorns accounted in USA was 203.

The players in the hyperlocal services market have adopted product launch and business expansion as their key developmental strategies to expand their market share, increase profitability, and remain competitive in the market. The key players profiled in this report include Delivery Hero, Just-Eat, Takeaway.com, GrubHub, Grofers, Instacart, Housekeep, Uber Technologies Inc., Handy, and AskForTask.

For Stakeholders

  • This report provides a quantitative analysis of the market segments, current trends, estimations, and dynamics of the hyperlocal services market analysis from 2021 to 2031 to identify the prevailing hyperlocal services market opportunities.
  • The market research is offered along with information related to key drivers, restraints, and opportunities.
  • Porter's five forces analysis highlights the potency of buyers and suppliers to enable stakeholders make profit-oriented business decisions and strengthen their supplier-buyer network.
  • In-depth analysis of the hyperlocal services market segmentation assists to determine the prevailing market opportunities.
  • Major countries in each region are mapped according to their revenue contribution to the global hyperlocal services market demand.
  • Market player positioning facilitates benchmarking and provides a clear understanding of the present position of the market players.
  • The report includes the analysis of the regional as well as global hyperlocal services market trends, key players, market segments, application areas, and market growth strategies.

Hyperlocal Services Market Report Highlights

Aspects Details
Market Size By 2031 USD 5.9 trillion
Growth Rate CAGR of 14.4%
Forecast period 2021 - 2031
Report Pages 341
By Type
  • Food Ordering
  • Grocery Ordering
  • Home Utility Service
    • Sub Type
      • Interior Design
      • Furniture Installation Services
      • Home Painting Services
      • Plumbing Services
      • Electronic Appliance Repair and Maintenance
      • Kitchen Cleaning and Maintenance
      • Car Cleaning Services
      • Carpet Sofa and Curtain Cleaning
      • Home Cleaning
      • Pest Control Services
      • Beauty and spa services
      • Salon Services
      • Pet care services
      • Childcare services
      • Waste Disposal
      • Professional Photographers
      • Yoga and Fitness
      • Others
  • Logistic Service Providers
  • Pharmaceuticals
  • Pet Food and Medicines
  • Clothing and Accessories
  • Others
By Nature
  • Utility Services
  • Goods Delivery
By Region
  • North America  (U.S., Canada, Mexico)
  • Europe  (France, Germany, Italy, Spain, UK, Russia, Rest of Europe)
  • Asia-Pacific  (China, Japan, India, South Korea, Australia, Rest of Asia-Pacific)
  • LAMEA  (Latin America, Middle East, Africa)
Key Market Players Housekeep Limited, Just Eat Takeaway N.V., Uber Technologies, Inc., Urban Company, Zomato Ltd., Instacart, Angi Inc., Delivery Hero SE, AskforTask Inc., Grofers India Private Limited
 
  • CHAPTER 1: INTRODUCTION

    • 1.1. Report description

    • 1.2. Key market segments

    • 1.3. Key benefits to the stakeholders

    • 1.4. Research Methodology

      • 1.4.1. Primary research

      • 1.4.2. Secondary research

      • 1.4.3. Analyst tools and models

  • CHAPTER 2: EXECUTIVE SUMMARY

    • 2.1. CXO Perspective

  • CHAPTER 3: MARKET OVERVIEW

    • 3.1. Market definition and scope

    • 3.2. Key findings

      • 3.2.1. Top impacting factors

      • 3.2.2. Top investment pockets

    • 3.3. Porter’s five forces analysis

      • 3.3.1. Bargaining power of suppliers

      • 3.3.2. Bargaining power of buyers

      • 3.3.3. Threat of substitutes

      • 3.3.4. Threat of new entrants

      • 3.3.5. Intensity of rivalry

    • 3.4. Market dynamics

      • 3.4.1. Drivers

        • 3.4.1.1. Changing lifestyle and food habits
        • 3.4.1.2. Surge in female working population
        • 3.4.1.3. Surge in disposable income

      • 3.4.2. Restraints

        • 3.4.2.1. Lack of Trust on online purchasing
        • 3.4.2.2. Digital illiteracy and limited digital infrastructure

      • 3.4.3. Opportunities

        • 3.4.3.1. Increasing smartphone penetration and growing internet users
        • 3.4.3.2. Rapid development of the food service industry and retail sector

    • 3.5. COVID-19 Impact Analysis on the market

  • CHAPTER 4: HYPERLOCAL SERVICES MARKET, BY NATURE

    • 4.1. Overview

      • 4.1.1. Market size and forecast

    • 4.2. Goods Delivery

      • 4.2.1. Key market trends, growth factors and opportunities

      • 4.2.2. Market size and forecast, by region

      • 4.2.3. Market share analysis by country

    • 4.3. Utility Services

      • 4.3.1. Key market trends, growth factors and opportunities

      • 4.3.2. Market size and forecast, by region

      • 4.3.3. Market share analysis by country

  • CHAPTER 5: HYPERLOCAL SERVICES MARKET, BY TYPE

    • 5.1. Overview

      • 5.1.1. Market size and forecast

    • 5.2. Food Ordering

      • 5.2.1. Key market trends, growth factors and opportunities

      • 5.2.2. Market size and forecast, by region

      • 5.2.3. Market share analysis by country

    • 5.3. Grocery Ordering

      • 5.3.1. Key market trends, growth factors and opportunities

      • 5.3.2. Market size and forecast, by region

      • 5.3.3. Market share analysis by country

    • 5.4. Home Utility Service

      • 5.4.1. Key market trends, growth factors and opportunities

      • 5.4.2. Market size and forecast, by region

      • 5.4.3. Market share analysis by country

      • 5.4.4. Home Utility Service Hyperlocal Services Market by Sub Type

        • 5.4.4.1. Interior Design Market size and forecast, by region
        • 5.4.4.2. Interior Design Market size and forecast, by country
        • 5.4.4.3. Furniture Installation Services Market size and forecast, by region
        • 5.4.4.4. Furniture Installation Services Market size and forecast, by country
        • 5.4.4.5. Home Painting Services Market size and forecast, by region
        • 5.4.4.6. Home Painting Services Market size and forecast, by country
        • 5.4.4.7. Plumbing Services Market size and forecast, by region
        • 5.4.4.8. Plumbing Services Market size and forecast, by country
        • 5.4.4.9. Electronic Appliance Repair and Maintenance Market size and forecast, by region
        • 5.4.4.10. Electronic Appliance Repair and Maintenance Market size and forecast, by country
        • 5.4.4.11. Kitchen Cleaning and Maintenance Market size and forecast, by region
        • 5.4.4.12. Kitchen Cleaning and Maintenance Market size and forecast, by country
        • 5.4.4.13. Car Cleaning Services Market size and forecast, by region
        • 5.4.4.14. Car Cleaning Services Market size and forecast, by country
        • 5.4.4.15. Carpet Sofa and Curtain Cleaning Market size and forecast, by region
        • 5.4.4.16. Carpet Sofa and Curtain Cleaning Market size and forecast, by country
        • 5.4.4.17. Home Cleaning Market size and forecast, by region
        • 5.4.4.18. Home Cleaning Market size and forecast, by country
        • 5.4.4.19. Pest Control Services Market size and forecast, by region
        • 5.4.4.20. Pest Control Services Market size and forecast, by country
        • 5.4.4.21. Beauty and spa services Market size and forecast, by region
        • 5.4.4.22. Beauty and spa services Market size and forecast, by country
        • 5.4.4.23. Salon Services Market size and forecast, by region
        • 5.4.4.24. Salon Services Market size and forecast, by country
        • 5.4.4.25. Pet care services Market size and forecast, by region
        • 5.4.4.26. Pet care services Market size and forecast, by country
        • 5.4.4.27. Childcare services Market size and forecast, by region
        • 5.4.4.28. Childcare services Market size and forecast, by country
        • 5.4.4.29. Waste Disposal Market size and forecast, by region
        • 5.4.4.30. Waste Disposal Market size and forecast, by country
        • 5.4.4.31. Professional Photographers Market size and forecast, by region
        • 5.4.4.32. Professional Photographers Market size and forecast, by country
        • 5.4.4.33. Yoga and Fitness Market size and forecast, by region
        • 5.4.4.34. Yoga and Fitness Market size and forecast, by country
        • 5.4.4.35. Others Market size and forecast, by region
        • 5.4.4.36. Others Market size and forecast, by country
    • 5.5. Logistic Service Providers

      • 5.5.1. Key market trends, growth factors and opportunities

      • 5.5.2. Market size and forecast, by region

      • 5.5.3. Market share analysis by country

    • 5.6. Pharmaceuticals

      • 5.6.1. Key market trends, growth factors and opportunities

      • 5.6.2. Market size and forecast, by region

      • 5.6.3. Market share analysis by country

    • 5.7. Pet Food and Medicines

      • 5.7.1. Key market trends, growth factors and opportunities

      • 5.7.2. Market size and forecast, by region

      • 5.7.3. Market share analysis by country

    • 5.8. Clothing and Accessories

      • 5.8.1. Key market trends, growth factors and opportunities

      • 5.8.2. Market size and forecast, by region

      • 5.8.3. Market share analysis by country

    • 5.9. Others

      • 5.9.1. Key market trends, growth factors and opportunities

      • 5.9.2. Market size and forecast, by region

      • 5.9.3. Market share analysis by country

  • CHAPTER 6: HYPERLOCAL SERVICES MARKET, BY REGION

    • 6.1. Overview

      • 6.1.1. Market size and forecast By Region

    • 6.2. North America

      • 6.2.1. Key trends and opportunities

      • 6.2.2. Market size and forecast, by Nature

      • 6.2.3. Market size and forecast, by Type

        • 6.2.3.1. North America Home Utility Service Hyperlocal Services Market by Sub Type
      • 6.2.4. Market size and forecast, by country

        • 6.2.4.1. U.S.
          • 6.2.4.1.1. Key market trends, growth factors and opportunities
          • 6.2.4.1.2. Market size and forecast, by Nature
          • 6.2.4.1.3. Market size and forecast, by Type
            • 6.2.4.1.3.1. U.S. Home Utility Service Hyperlocal Services Market by Sub Type

        • 6.2.4.2. Canada
          • 6.2.4.2.1. Key market trends, growth factors and opportunities
          • 6.2.4.2.2. Market size and forecast, by Nature
          • 6.2.4.2.3. Market size and forecast, by Type
            • 6.2.4.2.3.1. Canada Home Utility Service Hyperlocal Services Market by Sub Type

        • 6.2.4.3. Mexico
          • 6.2.4.3.1. Key market trends, growth factors and opportunities
          • 6.2.4.3.2. Market size and forecast, by Nature
          • 6.2.4.3.3. Market size and forecast, by Type
            • 6.2.4.3.3.1. Mexico Home Utility Service Hyperlocal Services Market by Sub Type

    • 6.3. Europe

      • 6.3.1. Key trends and opportunities

      • 6.3.2. Market size and forecast, by Nature

      • 6.3.3. Market size and forecast, by Type

        • 6.3.3.1. Europe Home Utility Service Hyperlocal Services Market by Sub Type
      • 6.3.4. Market size and forecast, by country

        • 6.3.4.1. France
          • 6.3.4.1.1. Key market trends, growth factors and opportunities
          • 6.3.4.1.2. Market size and forecast, by Nature
          • 6.3.4.1.3. Market size and forecast, by Type
            • 6.3.4.1.3.1. France Home Utility Service Hyperlocal Services Market by Sub Type

        • 6.3.4.2. Germany
          • 6.3.4.2.1. Key market trends, growth factors and opportunities
          • 6.3.4.2.2. Market size and forecast, by Nature
          • 6.3.4.2.3. Market size and forecast, by Type
            • 6.3.4.2.3.1. Germany Home Utility Service Hyperlocal Services Market by Sub Type

        • 6.3.4.3. Italy
          • 6.3.4.3.1. Key market trends, growth factors and opportunities
          • 6.3.4.3.2. Market size and forecast, by Nature
          • 6.3.4.3.3. Market size and forecast, by Type
            • 6.3.4.3.3.1. Italy Home Utility Service Hyperlocal Services Market by Sub Type

        • 6.3.4.4. Spain
          • 6.3.4.4.1. Key market trends, growth factors and opportunities
          • 6.3.4.4.2. Market size and forecast, by Nature
          • 6.3.4.4.3. Market size and forecast, by Type
            • 6.3.4.4.3.1. Spain Home Utility Service Hyperlocal Services Market by Sub Type

        • 6.3.4.5. UK
          • 6.3.4.5.1. Key market trends, growth factors and opportunities
          • 6.3.4.5.2. Market size and forecast, by Nature
          • 6.3.4.5.3. Market size and forecast, by Type
            • 6.3.4.5.3.1. UK Home Utility Service Hyperlocal Services Market by Sub Type

        • 6.3.4.6. Russia
          • 6.3.4.6.1. Key market trends, growth factors and opportunities
          • 6.3.4.6.2. Market size and forecast, by Nature
          • 6.3.4.6.3. Market size and forecast, by Type
            • 6.3.4.6.3.1. Russia Home Utility Service Hyperlocal Services Market by Sub Type

        • 6.3.4.7. Rest of Europe
          • 6.3.4.7.1. Key market trends, growth factors and opportunities
          • 6.3.4.7.2. Market size and forecast, by Nature
          • 6.3.4.7.3. Market size and forecast, by Type
            • 6.3.4.7.3.1. Rest of Europe Home Utility Service Hyperlocal Services Market by Sub Type

    • 6.4. Asia-Pacific

      • 6.4.1. Key trends and opportunities

      • 6.4.2. Market size and forecast, by Nature

      • 6.4.3. Market size and forecast, by Type

        • 6.4.3.1. Asia-Pacific Home Utility Service Hyperlocal Services Market by Sub Type
      • 6.4.4. Market size and forecast, by country

        • 6.4.4.1. China
          • 6.4.4.1.1. Key market trends, growth factors and opportunities
          • 6.4.4.1.2. Market size and forecast, by Nature
          • 6.4.4.1.3. Market size and forecast, by Type
            • 6.4.4.1.3.1. China Home Utility Service Hyperlocal Services Market by Sub Type

        • 6.4.4.2. Japan
          • 6.4.4.2.1. Key market trends, growth factors and opportunities
          • 6.4.4.2.2. Market size and forecast, by Nature
          • 6.4.4.2.3. Market size and forecast, by Type
            • 6.4.4.2.3.1. Japan Home Utility Service Hyperlocal Services Market by Sub Type

        • 6.4.4.3. India
          • 6.4.4.3.1. Key market trends, growth factors and opportunities
          • 6.4.4.3.2. Market size and forecast, by Nature
          • 6.4.4.3.3. Market size and forecast, by Type
            • 6.4.4.3.3.1. India Home Utility Service Hyperlocal Services Market by Sub Type

        • 6.4.4.4. South Korea
          • 6.4.4.4.1. Key market trends, growth factors and opportunities
          • 6.4.4.4.2. Market size and forecast, by Nature
          • 6.4.4.4.3. Market size and forecast, by Type
            • 6.4.4.4.3.1. South Korea Home Utility Service Hyperlocal Services Market by Sub Type

        • 6.4.4.5. Australia
          • 6.4.4.5.1. Key market trends, growth factors and opportunities
          • 6.4.4.5.2. Market size and forecast, by Nature
          • 6.4.4.5.3. Market size and forecast, by Type
            • 6.4.4.5.3.1. Australia Home Utility Service Hyperlocal Services Market by Sub Type

        • 6.4.4.6. Rest of Asia-Pacific
          • 6.4.4.6.1. Key market trends, growth factors and opportunities
          • 6.4.4.6.2. Market size and forecast, by Nature
          • 6.4.4.6.3. Market size and forecast, by Type
            • 6.4.4.6.3.1. Rest of Asia-Pacific Home Utility Service Hyperlocal Services Market by Sub Type

    • 6.5. LAMEA

      • 6.5.1. Key trends and opportunities

      • 6.5.2. Market size and forecast, by Nature

      • 6.5.3. Market size and forecast, by Type

        • 6.5.3.1. LAMEA Home Utility Service Hyperlocal Services Market by Sub Type
      • 6.5.4. Market size and forecast, by country

        • 6.5.4.1. Latin America
          • 6.5.4.1.1. Key market trends, growth factors and opportunities
          • 6.5.4.1.2. Market size and forecast, by Nature
          • 6.5.4.1.3. Market size and forecast, by Type
            • 6.5.4.1.3.1. Latin America Home Utility Service Hyperlocal Services Market by Sub Type

        • 6.5.4.2. Middle East
          • 6.5.4.2.1. Key market trends, growth factors and opportunities
          • 6.5.4.2.2. Market size and forecast, by Nature
          • 6.5.4.2.3. Market size and forecast, by Type
            • 6.5.4.2.3.1. Middle East Home Utility Service Hyperlocal Services Market by Sub Type

        • 6.5.4.3. Africa
          • 6.5.4.3.1. Key market trends, growth factors and opportunities
          • 6.5.4.3.2. Market size and forecast, by Nature
          • 6.5.4.3.3. Market size and forecast, by Type
            • 6.5.4.3.3.1. Africa Home Utility Service Hyperlocal Services Market by Sub Type

  • CHAPTER 7: COMPETITIVE LANDSCAPE

    • 7.1. Introduction

    • 7.2. Top winning strategies

    • 7.3. Product Mapping of Top 10 Player

    • 7.4. Competitive Dashboard

    • 7.5. Competitive Heatmap

    • 7.6. Top player positioning, 2021

  • CHAPTER 8: COMPANY PROFILES

    • 8.1. AskforTask Inc.

      • 8.1.1. Company overview

      • 8.1.2. Key Executives

      • 8.1.3. Company snapshot

      • 8.1.4. Operating business segments

      • 8.1.5. Product portfolio

    • 8.2. Delivery Hero SE

      • 8.2.1. Company overview

      • 8.2.2. Key Executives

      • 8.2.3. Company snapshot

      • 8.2.4. Operating business segments

      • 8.2.5. Product portfolio

      • 8.2.6. Business performance

      • 8.2.7. Key strategic moves and developments

    • 8.3. Grofers India Private Limited

      • 8.3.1. Company overview

      • 8.3.2. Key Executives

      • 8.3.3. Company snapshot

      • 8.3.4. Operating business segments

      • 8.3.5. Product portfolio

    • 8.4. Housekeep Limited

      • 8.4.1. Company overview

      • 8.4.2. Key Executives

      • 8.4.3. Company snapshot

      • 8.4.4. Operating business segments

      • 8.4.5. Product portfolio

    • 8.5. Instacart

      • 8.5.1. Company overview

      • 8.5.2. Key Executives

      • 8.5.3. Company snapshot

      • 8.5.4. Operating business segments

      • 8.5.5. Product portfolio

    • 8.6. Just Eat Takeaway N.V.

      • 8.6.1. Company overview

      • 8.6.2. Key Executives

      • 8.6.3. Company snapshot

      • 8.6.4. Operating business segments

      • 8.6.5. Product portfolio

      • 8.6.6. Business performance

      • 8.6.7. Key strategic moves and developments

    • 8.7. Uber Technologies, Inc.

      • 8.7.1. Company overview

      • 8.7.2. Key Executives

      • 8.7.3. Company snapshot

      • 8.7.4. Operating business segments

      • 8.7.5. Product portfolio

      • 8.7.6. Business performance

      • 8.7.7. Key strategic moves and developments

    • 8.8. Urban Company

      • 8.8.1. Company overview

      • 8.8.2. Key Executives

      • 8.8.3. Company snapshot

      • 8.8.4. Operating business segments

      • 8.8.5. Product portfolio

    • 8.9. Zomato Ltd.

      • 8.9.1. Company overview

      • 8.9.2. Key Executives

      • 8.9.3. Company snapshot

      • 8.9.4. Operating business segments

      • 8.9.5. Product portfolio

      • 8.9.6. Business performance

    • 8.10. Angi Inc.

      • 8.10.1. Company overview

      • 8.10.2. Key Executives

      • 8.10.3. Company snapshot

      • 8.10.4. Operating business segments

      • 8.10.5. Product portfolio

      • 8.10.6. Business performance

      • 8.10.7. Key strategic moves and developments

  • LIST OF FIGURES

  • FIGURE 1. SEGMENTATION OF HYPERLOCAL SERVICES MARKET,2021-2031
    FIGURE 2. HYPERLOCAL SERVICES MARKET,2021-2031
    FIGURE 3. TOP INVESTMENT POCKETS, BY REGION
    FIGURE 4. PORTER FIVE-1
    FIGURE 5. PORTER FIVE-2
    FIGURE 6. PORTER FIVE-3
    FIGURE 7. PORTER FIVE-4
    FIGURE 8. PORTER FIVE-5
    FIGURE 9. HYPERLOCAL SERVICES MARKET:DRIVERS, RESTRAINTS AND OPPORTUNITIES
    FIGURE 10. HYPERLOCAL SERVICES MARKET,BY NATURE,2021(%)
    FIGURE 11. COMPARATIVE SHARE ANALYSIS OF GOODS DELIVERY HYPERLOCAL SERVICES MARKET, 2021 AND 2031(%)
    FIGURE 12. COMPARATIVE SHARE ANALYSIS OF UTILITY SERVICES HYPERLOCAL SERVICES MARKET, 2021 AND 2031(%)
    FIGURE 13. HYPERLOCAL SERVICES MARKET,BY TYPE,2021(%)
    FIGURE 14. COMPARATIVE SHARE ANALYSIS OF FOOD ORDERING HYPERLOCAL SERVICES MARKET, 2021 AND 2031(%)
    FIGURE 15. COMPARATIVE SHARE ANALYSIS OF GROCERY ORDERING HYPERLOCAL SERVICES MARKET, 2021 AND 2031(%)
    FIGURE 16. COMPARATIVE SHARE ANALYSIS OF HOME UTILITY SERVICE HYPERLOCAL SERVICES MARKET, 2021 AND 2031(%)
    FIGURE 17. COMPARATIVE SHARE ANALYSIS OF LOGISTIC SERVICE PROVIDERS HYPERLOCAL SERVICES MARKET, 2021 AND 2031(%)
    FIGURE 18. COMPARATIVE SHARE ANALYSIS OF PHARMACEUTICALS HYPERLOCAL SERVICES MARKET, 2021 AND 2031(%)
    FIGURE 19. COMPARATIVE SHARE ANALYSIS OF PET FOOD AND MEDICINES HYPERLOCAL SERVICES MARKET, 2021 AND 2031(%)
    FIGURE 20. COMPARATIVE SHARE ANALYSIS OF CLOTHING AND ACCESSORIES HYPERLOCAL SERVICES MARKET, 2021 AND 2031(%)
    FIGURE 21. COMPARATIVE SHARE ANALYSIS OF OTHERS HYPERLOCAL SERVICES MARKET, 2021 AND 2031(%)
    FIGURE 22. HYPERLOCAL SERVICES MARKET BY REGION,2021
    FIGURE 23. U.S. HYPERLOCAL SERVICES MARKET,2021-2031($BILLION)
    FIGURE 24. CANADA HYPERLOCAL SERVICES MARKET,2021-2031($BILLION)
    FIGURE 25. MEXICO HYPERLOCAL SERVICES MARKET,2021-2031($BILLION)
    FIGURE 26. FRANCE HYPERLOCAL SERVICES MARKET,2021-2031($BILLION)
    FIGURE 27. GERMANY HYPERLOCAL SERVICES MARKET,2021-2031($BILLION)
    FIGURE 28. ITALY HYPERLOCAL SERVICES MARKET,2021-2031($BILLION)
    FIGURE 29. SPAIN HYPERLOCAL SERVICES MARKET,2021-2031($BILLION)
    FIGURE 30. UK HYPERLOCAL SERVICES MARKET,2021-2031($BILLION)
    FIGURE 31. RUSSIA HYPERLOCAL SERVICES MARKET,2021-2031($BILLION)
    FIGURE 32. REST OF EUROPE HYPERLOCAL SERVICES MARKET,2021-2031($BILLION)
    FIGURE 33. CHINA HYPERLOCAL SERVICES MARKET,2021-2031($BILLION)
    FIGURE 34. JAPAN HYPERLOCAL SERVICES MARKET,2021-2031($BILLION)
    FIGURE 35. INDIA HYPERLOCAL SERVICES MARKET,2021-2031($BILLION)
    FIGURE 36. SOUTH KOREA HYPERLOCAL SERVICES MARKET,2021-2031($BILLION)
    FIGURE 37. AUSTRALIA HYPERLOCAL SERVICES MARKET,2021-2031($BILLION)
    FIGURE 38. REST OF ASIA-PACIFIC HYPERLOCAL SERVICES MARKET,2021-2031($BILLION)
    FIGURE 39. LATIN AMERICA HYPERLOCAL SERVICES MARKET,2021-2031($BILLION)
    FIGURE 40. MIDDLE EAST HYPERLOCAL SERVICES MARKET,2021-2031($BILLION)
    FIGURE 41. AFRICA HYPERLOCAL SERVICES MARKET,2021-2031($BILLION)
    FIGURE 42. TOP WINNING STRATEGIES, BY YEAR
    FIGURE 43. TOP WINNING STRATEGIES, BY DEVELOPMENT
    FIGURE 44. TOP WINNING STRATEGIES, BY COMPANY
    FIGURE 45. PRODUCT MAPPING OF TOP 10 PLAYERS
    FIGURE 46. COMPETITIVE DASHBOARD
    FIGURE 47. COMPETITIVE HEATMAP OF TOP 10 KEY PLAYERS
    FIGURE 48. TOP PLAYER POSITIONING, 2021
    FIGURE 49. GROFERS INDIA PRIVATE LIMITED.: NET SALES ($BILLION)
    FIGURE 50. HOUSEKEEP LIMITED.: NET SALES ($BILLION)
    FIGURE 51. INSTACART.: NET SALES ($BILLION)
    FIGURE 52. JUST EAT TAKEAWAY N.V..: NET SALES ($BILLION)
    FIGURE 53. UBER TECHNOLOGIES, INC..: NET SALES ($BILLION)
    FIGURE 54. URBAN COMPANY.: NET SALES ($BILLION)
    FIGURE 55. ZOMATO LTD..: NET SALES ($BILLION)
    FIGURE 56. DELIVERY HERO SE.: NET SALES ($BILLION)
    FIGURE 57. ANGI INC..: NET SALES ($BILLION)
    FIGURE 58. ASKFORTASK INC..: NET SALES ($BILLION)


Innovation in services is key for the growth of global hyperlocal services market in terms of value sales. Customers are increasingly inclined to have comfortable, convenient and hustle free shopping, which is anticipated to fuel the growth of the hyperlocal services during the forecast period. Online food and grocery ordering platforms are enhancing the shopping experience by using improved technologies in logistic including online tracking system which allows customers to track their order from ordering to delivery. In addition, discounts, combo offers, referring rewards and first-time ordering discounts are increasing customers on the online ordering platforms.

Growing utility of smartphones and its user base is lucrative opportunities for the new entrants and growing funding for the start-ups through government and big giants are further adding to the growth of the hyperlocal services market. Key players in the market have adopted new product launch, continuous innovation, and acquisition as their key developmental strategies to fulfill the rising demand for hyperlocal services including online food, grocery, furniture, home services, and drugs Jugnoo acquired SubKuchFresh, an online grocery store in 2021, to strengthen hyperlocal services India. Jugnoo is India's 3rd largest ride-hailing company, operating in 50+ cities pan-India.

However, unorganized retail sector, improper transportation facilities, growing cybercrimes and digital illiteracy, has been hampering the growth of the hyperlocal services market during the forecast period. Additionally, customer’s lack of trust on online shopping is big challenge for the online business operating firms.

PURCHASE OPTIONS

Call or Email us

U.S.-Canada Toll-free: +1-800-792-5285
Int'l : +1-503-894-6022
Europe : +44-845-528-1300
Email : help@alliedmarketresearch.com
 
FREQUENTLY ASKED QUESTIONS?

A. Growing smartphone user base and internet accessibility is majorly driving the growth of the hyperlocal service market.

A. Home utility service is the leading nature of Hyperlocal Services Market.

A. The North America is the largest regional market for Hyperlocal Services.

A. The global hyperlocal service market was valued at $1,484.8 billion in 2021, and is projected to reach $5,851.7 billion by 2031, registering a CAGR of 14.4% from 2022 to 2031.

A. The major players operating in the market are Delivery Hero, Just-Eat, Takeaway.com, GrubHub, Grofers, Instacart, Housekeep, Uber Technologies Inc., Handy, and AskForTask.

Looking for Customization?

 Customization Request

Have a Question?

 Speak with Analyst

Any Confusion?

 Inquire Before Buying

Have a glance of the Report

  Request Sample
RELATED TAGS

Purchase Full Report of
Hyperlocal Services Market

Start reading instantly.
This Report and over 67,404+ more Reports, Available with Avenue Library. T&C*.

  • Online Only
  • $3,570
  • Online cloud access only
  • Restricted print, copy, paste & download
  • Read only
  • Free industry update
    (Within 180 days)
  • Free report update in next update cycle
    (Feb 2024 - Feb 2025)
  • Data Pack
  • $3,840
  • Restricted to one authorized user
  • One print only
  • Available in
    Excel
  • Free industry update
    (Within 180 days)
  •   Free report update in next update cycle
    (Feb 2024 - Feb 2025)
  • Single User
  • $5,730
  • Restricted to one authorized user
  • One print only
  • Available in
    PDF
  • Free industry update
    (Within 180 days)
  •   Free report update in next update cycle
    (Feb 2024 - Feb 2025)
  • Five Users
  • $6,450
  • Limited to five authorized users
  • Print upto five copies
  • Available in
    PDF
  • Free industry update
    (Within 180 days)
  •   Free report update in next update cycle
    (Feb 2024 - Feb 2025)
  • Enterprise
    License/PDF

  • $9,600
  • Unlimited
    within
    company/enterprise
  • Available in Excel & PDF
  • Free industry update
    (Within 180 days)
  •   Free report update in next update cycle
    (Feb 2024 - Feb 2025)
  • Library
    Membership

  • $999 $ 1,175
    Per User/ Per month/ Billed annually
  • Published Content
    E-access
  • Company Profiles
    E-access
  • Newly Added Content Access
  • 10 PDF
    Downloads
  • 5 Excel Data
    Pack Downloads
  • 250 Company Profiles PDF Downloads
  • Buy Now

*Taxes/Fees, if applicable will be added during checkout. All prices in USD

RELATED REPORTS
 

Why Allied Market Research?


Infallible Methodology

To ensure high-level data integrity, accurate analysis, and impeccable forecasts

Analyst Support

For complete satisfaction

Customization

On-demand customization of scope of the report to exactly meet your needs

TARGETED MARKET VIEW

Targeted market view to provide pertinent information and save time of readers

Get fresh content delivered

Get insights on topics that are crucial for your business. Stay abreast of your interest areas.

Get Industry Data Alerts

Why Allied Market Research?

Infallible Methodology

To ensure high-level data integrity, accurate analysis, and impeccable forecasts

Analyst Support

For complete satisfaction

Customization

On-demand customization of scope of the report to exactly meet your needs

TARGETED MARKET VIEW

Targeted market view to provide pertinent information and save time of readers