0
2021
Hypersonic Technology Market

Hypersonic Technology Market

by Launch Mode (Air Launched, Surface Launched, and Subsea Launched), End User (Military, Air Force, Navy, and Space), and Type (Hypersonic Glide Vehicle, Hypersonic Cruise Missile, and Hypersonic Spaceplanes): Global Opportunity Analysis and Industry Forecast, 2021-2030

Report Code: A13635
Sep 2021 | Pages: 290
Tables: 110
Charts: 66
  • Formats*:

  • pdf

    Single User License, Five User
    License & Enterprise User License

  • xls

    Data Pack Excel License

  • ppt

    It comes with the additional cost
    of $2500.00 contact sales.


COVID-19

Pandemic disrupted the entire world and affected many industries.

Get detailed COVID-19 impact analysis on the Hypersonic Technology Market

Request Now !

Hypersonic Technology Market Statistics 2030 -

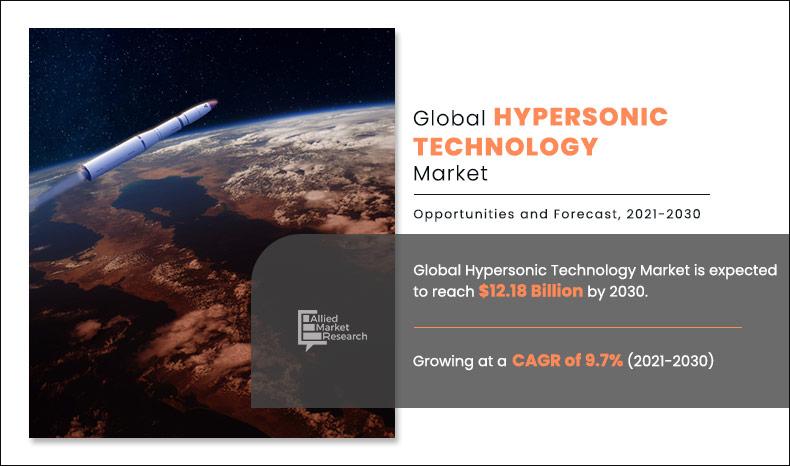
The global hypersonic technology market was valued at $4.98 billion in 2020, and is projected to reach $12.18 billion by 2030, registering a CAGR of 9.7%.

The COVID-19 outbreak led to adverse economic situations across the world and especially impacted the deployment of high investment technologies such as hypersonic technologies. The development and testing of hypersonic technologies for the defense sector across various nations were put on hold owing to adverse economic conditions and disruption in the supply chain of key components. The economic downfall witnessed throughout the world has impacted the adoption of efficient and fast technologies such as hypersonic missiles and aircraft. With the ongoing vaccination across the globe, the hypersonic technology industry is expected to attract investments and consequently come on track in the coming years.

In aerodynamic studies, a hypersonic speed is that significantly surpasses speed of sound, often specified as starting at speeds of Mach 5 (Mach number is an important quantity to compare the speed of any object with a speed of sound) and above. Hypersonic technologies for instance, long-range missiles; theater-reach and global-reach aircraft designed to deliver weapons or for reconnaissance missions; and space launch vehicles have a Mach number between 5 and 10. Hypersonic vehicles can enable a new class of flight vehicles that enable faster access to space, rapid military response at long range, and other advantages.

Hypersonic-Technology-Market

The market is divided on the basis of launch mode, end-user, type, and region. The launch mode segment is further divided into air launched, surface launched, and subsea launched. On the basis of end user, it is segmented into military, air force, navy, and space. By type, it is segmented into hypersonic glide vehicle, hypersonic cruise missile, and hypersonic spaceplanes. Region wise, the market is analyzed across North America, Europe, Asia-Pacific, and LAMEA.

Key players operating in the global hypersonic technology market include BAE Systems plc, Dynetics, Inc., Hermeus Corp., Lockheed Martin Corporation, MBDA, Northrop Grumman Corporation, Raytheon Technologies Corporation, Reaction Engines, The Boeing Company, and Velontra.

Rise in number of territorial conflicts throughout the world

Six countries lay overlapping rights to the South and East China Seas, which is an area that is abundant in natural gas and hydrocarbons, and via which trillions of dollars of international trade flow happen annually. As China enlarges its naval dominance and constructs military bases on man-made islands, it has been met by increasing forcefulness from other regional claimants such as Japan, Vietnam, and the Philippines. Frequent standoffs range from the Senkaku/Diaoyu Islands on China’s eastern edge, to the long stretch of archipelagos in the South China Sea that encompasses hundreds of islands.  U.S. has also built up its maritime presence in the area, indicating its higher role in the clashes, which, if not handled properly, might turn part of Asia’s naval regions from flourishing trade channels into grounds of continuous conflicts. Rise in conflicts across different parts of the world to gain dominance in commercial or defense arenas is expected to drive growth of the global hypersonic technology market during the forecast period. Advantages offered by hypersonic technologies in case of war-like situations can be really helpful in taking urgent military decisions. Hypersonic vehicles fly faster than five times the speed of sound and enable a new class of flight vehicles that enable rapid military response at long range. These factors are expected to open new avenues for growth of the hypersonic technology market during the forecast period. 

Hypersonic Technology Market
By Launch Mode

Your browser does not support the canvas element.

Air Launched is projected as the most lucrative segments

Get more information on this report : Request Sample Pages

Increase in developments regarding deployment of hypersonic technologies across the world

U.S. is aiming to deploy hypersonic weapons in the coming years, amid the rise in initiatives by both Russia and China to deploy significantly hypersonic technologies much sooner than the U.S. Russia claimed in 2019 that its Avengard missile was operational and has recently upgraded Kh-32s with the capability to carry hypersonic missiles, while China has developed DF-17, which could potentially strike the U.S. mainland if fired from a naval vessel.

U.S. continues its investments, which previously included major contracts to develop hypersonic weapons (Hacksaw). U.S. is also developing a common missile body for use by multiple military branches (C-HGB). By 2027, the Institute for Defense and Government (IDGA) projects an estimated global total of $127.3 billion is expected to be spent on hypersonic weaponry alone and Defense Department budget numbers in the U.S. are expected to reach $2.5 billion in classified hypersonic work by 2024. Aerospace giant, Boeing is developing its own hypersonic transportation technology and startups such as Hermeus are underway in for development of Mach 5 jet, which would make travel time between New York to Paris as short as 90 minutes. Such developments are expected to fuel growth of the hypersonic technology market during the forecast period.

Hypersonic Technology Market
By End-user

Your browser does not support the canvas element.

Air Force is projected as the most lucrative segments

Get more information on this report : Request Sample Pages

Testing challenges of hypersonic technologies

According to the most recent study on the hypersonic technologies conducted by the Institute for Defense Analyses (IDA) in 2014, the U.S. has 48 critical hypersonic test facilities and mobile assets that were necessary at that point for maturation of hypersonic technology. These facilities are intended to simulate unique conditions experienced by a missile in hypersonic flight including speed, pressure, and atmospheric heating effects unique to travel at hypersonic velocities. According to that report, these resources comprised 10 DoD hypersonic ground test facilities, 11 DoD open-air ranges, 11 DoD mobile assets, 9 NASA facilities, 2 Department of Energy facilities, and 5 assorted industry/academic facilities. However, the report also noted that no current U.S. facility can provide full-scale, time-dependent, coupled aerodynamic and thermal-loading environments for flight durations necessary to evaluate these characteristics above Mach 8. This implies that the U.S. needs more Federally Funded Research and Development Centers (FFRDCs), more testing facilities, more research and development laboratories; and other requirements. Moreover, the U.S. would need facilities capable of testing navigation guidance and control systems, thermal propulsion systems, heat resistant materials, and shielding. All these factors are expected to incur a huge cost for testing of hypersonic technologies, which is expected to limit growth of the hypersonic technology market during the forecast period.

Hypersonic Technology Market
By Type

Your browser does not support the canvas element.

Hypersonic Cruise Missile is projected as the most lucrative segments

Get more information on this report : Request Sample Pages

Advancements in scramjet technology for hypersonic missiles

Scramjet engine is crucial for acquiring hypersonic speeds, and thus, only a few nations across the world have the capability to develop scramjet technology for hypersonic missiles. Although, in recent years, nations such as India, the U.S., and Australia have pushed development of scramjet technology. For instance, in September 2020, India successfully tested an indigenously-developed hypersonic technology demonstrator vehicle (HSTDV) powered by a scramjet engine. With the successful launch, India joined the club of nations that have mastered the hypersonic technology. In November 2020, the U.S. Air Force Research Laboratory completed a series of tests of a scramjet engine. Furthermore, in January 2021, the U.S. and Australia joined forces to build air-launched hypersonic cruise missiles that could shift the military balance of power in Asia-Pacific. The new U.S.-Australian project known as the Southern Cross Integrated Flight Research Experiment, or SCIFiRE, is an Allied Prototyping Initiative that was formally announced by two nations in December 2020. Development of a powerful and reliable scramjet engines is essential for hypersonic technologies and rise in initiatives regarding production of efficient scramjet engines globally is expected to propel growth of the hypersonic technology market during the forecast period.

Hypersonic Technology Market
By Region

2030
Asia-pacific 
North America
Europe
LAMEA

North America would exhibit the highest CAGR of 11.1% during 2021-2030.

Get more information on this report : Request Sample Pages

COVID-19 Impact Analysis

  • The COVID-19 impact on the hypersonic technology market is unpredictable, and is expected to remain in force till the second quarter of 2021.
  • The COVID-19 outbreak forced governments across the globe to implement stringent lockdown and ban import–export of raw materials items for most of 2020. This led to sudden fall in the availability of important raw materials for manufacturing ground defense equipment.
  • Moreover, nationwide lockdown forced parts manufacturing facilities to partially or completely shut their operations.
  • Adverse impacts of the COVID-19 pandemic have resulted in delays in activities and initiatives regarding development of modern hypersonic technologies globally.

Key Benefits For Stakeholders

  • This study presents analytical depiction of the global hypersonic technology market analysis along with the current trends and future estimations to depict imminent investment pockets.
  • The overall hypersonic technology market opportunity is determined by understanding profitable trends to gain a stronger foothold.
  • The report presents information related to key drivers, restraints, and opportunities of the global hypersonic technology market with a detailed impact analysis.
  • The current hypersonic technology market is quantitatively analyzed from 2020 to 2030 to benchmark the financial competency.
  • Porter’s five forces analysis illustrates the potency of the buyers and suppliers in the industry.

KEY MARKET SEGMENTS

By Launch Mode

  •  
  • Air Launched
  • Surface Launched
  • Subsea Launched

By End-User

  •  
  • Military
  • Air Force
  • Navy
  • Space

By Type

  •  
  • Hypersonic Glide Vehicle
  • Hypersonic Cruise Missile
  • Hypersonic Spaceplanes    

By Region

  •  
  • North America
    • U.S.
    • Canada
    • Mexico
  • Europe
    • Germany
    • UK
    • France
    • Russia
    • Rest of Europe
  • Asia-Pacific
    • China
    • Japan
    • India
    • South Korea
    • Rest of Asia Pacific
  • LAMEA
    • Latin America
    • Middle East
    • Africa

KEY PLAYERS

  •  
  • BAE Systems plc
  • Dynetics, Inc.
  • Hermeus Corp.
  • Lockheed Martin Corporation
  • MBDA
  • Northrop Grumman Corporation
  • Raytheon Technologies Corporation
  • Reaction Engines
  • The Boeing Company
  • Velontra

Hypersonic Technology Market Report Highlights

Aspects Details
By LAUNCH MODE
  • Air launched
  • Surface launched
  • Subsea launched
By END-USER
  • Military
  • Air force
  • Navy
  • Space
By TYPE
  • Hypersonic glide vehicle
  • Hypersonic cruise missile
  • Hypersonic spaceplanes
By Region
  • North America  (U.S., Canada, Mexico)
  • Europe  (France, Germany, Italy, Spain, UK, Russia, Rest of Europe)
  • Asia-Pacific  (China, Japan, India, South Korea, Australia, Thailand, Malaysia, Indonesia, Rest of Asia-Pacific)
  • LAMEA  (Brazil, South Africa, Saudi Arabia, UAE, Argentina, Rest of LAMEA)
Key Market Players BAE SYSTEMS PLC, LOCKHEED MARTIN CORPORATION, Velontra, THE BOEING COMPANY, RAYTHEON TECHNOLOGIES CORPORATION, Reaction Engines, HERMEUS CORP., Dynetics, Inc. (Subsidiary of Leidos Holdings, Inc.), NORTHROP GRUMMAN CORPORATION, .MBDA
 

CHAPTER 1:INTRODUCTION

1.1.Report description
1.2.Key benefits for stakeholders
1.3.Key market segments
1.4.Research methodology

1.4.1.Primary research
1.4.2.Secondary research
1.4.3.Analyst tools and models

CHAPTER 2:EXECUTIVE SUMMARY

2.1.CXO perspective

CHAPTER 3:MARKET OVERVIEW

3.1.Market definition and scope
3.2.Key findings

3.2.1.Top impacting factors
3.2.2.Top investment pockets
3.2.3.Top winning strategies

3.3.Porter’s five forces analysis
3.4.Key player positioning, 2020
3.5.Market dynamics

3.5.1.Drivers

3.5.1.1.Rise in number of territorial conflicts throughout the world
3.5.1.2.Increase in developments regarding the deployment of hypersonic technologies across the world

3.5.2.Restraints

3.5.2.1.Testing challenges of hypersonic technologies
3.5.2.2.Materials development challenges

3.5.3.Opportunities

3.5.3.1.Advancements in scramjet technology for hypersonic missiles
3.5.3.2.Rise in defense spending globally

3.6.COVID-19 impact analysis

3.6.1.Evolution of outbreak
3.6.2.Micro economic impact analysis

3.6.2.1.Consumer trends
3.6.2.2.Technology trends
3.6.2.3.Regulatory trends

3.6.3.Macro-economic impact analysis

3.6.3.1.GDP
3.6.3.2.Import/export analysis
3.6.3.3.Employment index

3.6.4.Impact on the hypersonic technology industry

CHAPTER 4:HYPERSONIC TECHNOLOGY MARKET, BY LAUNCH MODE

4.1.Overview
4.2.Air launched

4.2.1.Key market trends, growth factors, and opportunities
4.2.2.Market size and forecast, by region
4.2.3.Market analysis, by country

4.3.Surface launched

4.3.1.Key market trends, growth factors, and opportunities
4.3.2.Market size and forecast, by region
4.3.3.Market analysis, by country

4.4.Subsea launched

4.4.1.Key market trends, growth factors, and opportunities
4.4.2.Market size and forecast, by region
4.4.3.Market analysis, by country

CHAPTER 5:HYPERSONIC TECHNOLOGY MARKET, BY END-USER

5.1.Overview
5.2.Military

5.2.1.Key market trends, growth factors, and opportunities
5.2.2.Market size and forecast, by region
5.2.3.Market analysis, by country

5.3.Air force

5.3.1.Key market trends, growth factors, and opportunities
5.3.2.Market size and forecast, by region
5.3.3.Market analysis, by country

5.4.Navy

5.4.1.Key market trends, growth factors, and opportunities
5.4.2.Market size and forecast, by region
5.4.3.Market analysis, by country

5.5.Space

5.5.1.Key market trends, growth factors, and opportunities
5.5.2.Market size and forecast, by region
5.5.3.Market analysis, by country

CHAPTER 6:HYPERSONIC TECHNOLOGY MARKET, BY TYPE

6.1.Overview
6.2.Hypersonic glide vehicle

6.2.1.Key market trends, growth factors, and opportunities
6.2.2.Market size and forecast, by region
6.2.3.Market analysis, by country

6.3.Hypersonic cruise missile

6.3.1.Key market trends, growth factors, and opportunities
6.3.2.Market size and forecast, by region
6.3.3.Market analysis, by country

6.4.Hypersonic spaceplanes

6.4.1.Key market trends, growth factors, and opportunities
6.4.2.Market size and forecast, by region
6.4.3.Market analysis, by country

CHAPTER 7:HYPERSONIC TECHNOLOGY MARKET, BY REGION

7.1.Overview
7.2.North America

7.2.1.Key market trends, growth factors, and opportunities
7.2.2.Market size and forecast, by Launch mode
7.2.3.Market size and forecast, by End-user
7.2.4.Market size and forecast, by Type
7.2.5.Market size and forecast, by country

7.2.5.1.U.S.

7.2.5.1.1.Market size and forecast, by launch mode
7.2.5.1.2.Market size and forecast, by end-user
7.2.5.1.3.Market size and forecast, by type

7.2.5.2.Canada

7.2.5.2.1.Market size and forecast, by launch mode
7.2.5.2.2.Market size and forecast, by end-user
7.2.5.2.3.Market size and forecast, by type

7.2.5.3.Mexico

7.2.5.3.1.Market size and forecast, by launch mode
7.2.5.3.2.Market size and forecast, by end-user
7.2.5.3.3.Market size and forecast, by type

7.3.Europe

7.3.1.Key market trends, growth factors, and opportunities
7.3.2.Market size and forecast, by Launch mode
7.3.3.Market size and forecast, by End-user
7.3.4.Market size and forecast, by Type
7.3.5.Market size and forecast, by country

7.3.5.1.Germany

7.3.5.1.1.Market size and forecast, by launch mode
7.3.5.1.2.Market size and forecast, by end-user
7.3.5.1.3.Market size and forecast, by type

7.3.5.2.UK

7.3.5.2.1.Market size and forecast, by launch mode
7.3.5.2.2.Market size and forecast, by end-user
7.3.5.2.3.Market size and forecast, by type

7.3.5.3.France

7.3.5.3.1.Market size and forecast, by launch mode
7.3.5.3.2.Market size and forecast, by end-user
7.3.5.3.3.Market size and forecast, by type

7.3.5.4.Russia

7.3.5.4.1.Market size and forecast, by launch mode
7.3.5.4.2.Market size and forecast, by end-user
7.3.5.4.3.Market size and forecast, by type

7.3.5.5.Rest of Europe

7.3.5.5.1.Market size and forecast, by launch mode
7.3.5.5.2.Market size and forecast, by end-user
7.3.5.5.3.Market size and forecast, by type

7.4.Asia-Pacific

7.4.1.Key market trends, growth factors, and opportunities
7.4.2.Market size and forecast, by Launch mode
7.4.3.Market size and forecast, by End-user
7.4.4.Market size and forecast, by Type
7.4.5.Market size and forecast, by country

7.4.5.1.China

7.4.5.1.1.Market size and forecast, by launch mode
7.4.5.1.2.Market size and forecast, by end-user
7.4.5.1.3.Market size and forecast, by type

7.4.5.2.Japan

7.4.5.2.1.Market size and forecast, by launch mode
7.4.5.2.2.Market size and forecast, by end-user
7.4.5.2.3.Market size and forecast, by type

7.4.5.3.India

7.4.5.3.1.Market size and forecast, by launch mode
7.4.5.3.2.Market size and forecast, by end-user
7.4.5.3.3.Market size and forecast, by type

7.4.5.4.South Korea

7.4.5.4.1.Market size and forecast, by launch mode
7.4.5.4.2.Market size and forecast, by end-user
7.4.5.4.3.Market size and forecast, by type

7.4.5.5.Rest of Asia-Pacific

7.4.5.5.1.Market size and forecast, by launch mode
7.4.5.5.2.Market size and forecast, by end-user
7.4.5.5.3.Market size and forecast, by type

7.5.LAMEA

7.5.1.Key market trends, growth factors, and opportunities
7.5.2.Market size and forecast, by Launch mode
7.5.3.Market size and forecast, by End-user
7.5.4.Market size and forecast, by Type
7.5.5.Market size and forecast, by country

7.5.5.1.Latin America

7.5.5.1.1.Market size and forecast, by launch mode
7.5.5.1.2.Market size and forecast, by end-user
7.5.5.1.3.Market size and forecast, by type

7.5.5.2.Middle East

7.5.5.2.1.Market size and forecast, by launch mode
7.5.5.2.2.Market size and forecast, by end-user
7.5.5.2.3.Market size and forecast, by type

7.5.5.3.Africa

7.5.5.3.1.Market size and forecast, by launch mode
7.5.5.3.2.Market size and forecast, by end-user
7.5.5.3.3.Market size and forecast, by type

CHAPTER 8:COMPANY PROFILES

8.1.BAE SYSTEMS PLC

8.1.1.Company overview
8.1.2.Company snapshot
8.1.3.Operating business segments
8.1.4.Product portfolio
8.1.5.Business performance
8.1.6.Key strategic moves and developments

8.2.Dynetics, Inc. (Subsidiary of Leidos Holdings, Inc.)

8.2.1.Company overview
8.2.2.Company snapshot
8.2.3.Operating business segments
8.2.4.Product portfolio
8.2.5.Business performance
8.2.6.Key strategic moves and developments

8.3.HERMEUS CORP.

8.3.1.Company overview
8.3.2.Company snapshot
8.3.3.Product portfolio
8.3.4.Key strategic moves and developments

8.4.LOCKHEED MARTIN CORPORATION

8.4.1.Company overview
8.4.2.Company snapshot
8.4.3.Operating business segments
8.4.4.Product portfolio
8.4.5.Business performance
8.4.6.Key strategic moves and developments

8.5.MBDA

8.5.1.Company overview
8.5.2.Company snapshot
8.5.3.Product portfolio
8.5.4.Business performance
8.5.5.key strategic moves and developments

8.6.NORTHROP GRUMMAN CORPORATION

8.6.1.Company overview
8.6.2.Company snapshot
8.6.3.Operating business segments
8.6.4.Product portfolio
8.6.5.Business performance
8.6.6.Key strategic moves and developments

8.7.RAYTHEON TECHNOLOGIES CORPORATION

8.7.1.Company overview
8.7.2.Company snapshot
8.7.3.Operating business segments
8.7.4.Product portfolio
8.7.5.Business performance

8.8.Reaction Engines

8.8.1.Company overview
8.8.2.Company snapshot
8.8.3.Product portfolio
8.8.4.Key strategic moves and developments

8.9.THE BOEING COMPANY

8.9.1.Company overview
8.9.2.Key executives
8.9.3.Company snapshot
8.9.4.Operating business segments
8.9.5.Product portfolio
8.9.6.Business performance
8.9.7.Key strategic moves and developments

8.10.Velontra

8.10.1.Company overview
8.10.2.Company snapshot
8.10.3.Product portfolio
8.10.4.Key strategic moves and developments

LIST OF TABLES

TABLE 01.HYPERSONIC TECHNOLOGY MARKET, BY LAUNCH MODE, 2020–2030 ($MILLION)
TABLE 02.HYPERSONIC TECHNOLOGY MARKET FOR AIR LAUNCHED, BY REGION 2020–2030 ($MILLION)
TABLE 03.HYPERSONIC TECHNOLOGY MARKET FOR SURFACE LAUNCHED, BY REGION 2020–2030 ($MILLION)
TABLE 04.HYPERSONIC TECHNOLOGY MARKET FOR SUBSEA LAUNCHED, BY REGION 2020–2030 ($MILLION)
TABLE 05.HYPERSONIC TECHNOLOGY MARKET, BY END-USER, 2020–2030 ($MILLION)
TABLE 06.HYPERSONIC TECHNOLOGY MARKET FOR MILITARY, BY REGION 2020–2030 ($MILLION)
TABLE 07.HYPERSONIC TECHNOLOGY MARKET FOR AIR FORCE, BY REGION 2020–2030 ($MILLION)
TABLE 08.HYPERSONIC TECHNOLOGY MARKET FOR NAVY, BY REGION 2020–2030 ($MILLION)
TABLE 09.HYPERSONIC TECHNOLOGY MARKET FOR SPACE, BY REGION 2020–2030 ($MILLION)
TABLE 10.HYPERSONIC TECHNOLOGY MARKET, BY TYPE, 2020–2030 ($MILLION)
TABLE 11.HYPERSONIC TECHNOLOGY MARKET FOR HYPERSONIC GLIDE VEHICLE, BY REGION 2020–2030 ($MILLION)
TABLE 12.HYPERSONIC TECHNOLOGY MARKET FOR HYPERSONIC CRUISE MISSILE, BY REGION 2020–2030 ($MILLION)
TABLE 13.HYPERSONIC TECHNOLOGY MARKET FOR HYPERSONIC SPACEPLANES, BY REGION 2020–2030 ($MILLION)
TABLE 14.HYPERSONIC TECHNOLOGY MARKET, BY REGION, 2020–2030 ($MILLION)
TABLE 15.NORTH AMERICA HYPERSONIC TECHNOLOGY MARKET, BY LAUNCH MODE, 2020–2030 ($MILLION)
TABLE 16.NORTH AMERICA HYPERSONIC TECHNOLOGY MARKET, BY END-USER, 2020–2030 ($MILLION)
TABLE 17.NORTH AMERICA HYPERSONIC TECHNOLOGY MARKET, BY TYPE, 2020–2030 ($MILLION)
TABLE 18.U.S. HYPERSONIC TECHNOLOGY MARKET, BY LAUNCH MODE, 2020–2030 ($MILLION)
TABLE 19.U.S. HYPERSONIC TECHNOLOGY MARKET, BY END-USER, 2020–2030 ($MILLION)
TABLE 20.U.S. HYPERSONIC TECHNOLOGY MARKET, BY TYPE, 2020–2030 ($MILLION)
TABLE 21.CANADA HYPERSONIC TECHNOLOGY MARKET, BY LAUNCH MODE, 2020–2030 ($MILLION)
TABLE 22.CANADA HYPERSONIC TECHNOLOGY MARKET, BY END-USER, 2020–2030 ($MILLION)
TABLE 23.CANADA HYPERSONIC TECHNOLOGY MARKET, BY TYPE, 2020–2030 ($MILLION)
TABLE 24.MEXICO HYPERSONIC TECHNOLOGY MARKET, BY LAUNCH MODE, 2020–2030 ($MILLION)
TABLE 25.MEXICO HYPERSONIC TECHNOLOGY MARKET, BY END-USER, 2020–2030 ($MILLION)
TABLE 26.MEXICO HYPERSONIC TECHNOLOGY MARKET, BY TYPE, 2020–2030 ($MILLION)
TABLE 27.EUROPE HYPERSONIC TECHNOLOGY MARKET, BY LAUNCH MODE, 2020–2030 ($MILLION)
TABLE 28.EUROPE HYPERSONIC TECHNOLOGY MARKET, BY END-USER, 2020–2030 ($MILLION)
TABLE 29.EUROPE HYPERSONIC TECHNOLOGY MARKET, BY TYPE, 2020–2030 ($MILLION)
TABLE 30.GERMANY HYPERSONIC TECHNOLOGY MARKET, BY LAUNCH MODE, 2020–2030 ($MILLION)
TABLE 31.GERMANY HYPERSONIC TECHNOLOGY MARKET, BY END-USER, 2020–2030 ($MILLION)
TABLE 32.GERMANY HYPERSONIC TECHNOLOGY MARKET, BY TYPE, 2020–2030 ($MILLION)
TABLE 33.UK HYPERSONIC TECHNOLOGY MARKET, BY LAUNCH MODE, 2020–2030 ($MILLION)
TABLE 34.UK HYPERSONIC TECHNOLOGY MARKET, BY END-USER, 2020–2030 ($MILLION)
TABLE 35.UK HYPERSONIC TECHNOLOGY MARKET, BY TYPE, 2020–2030 ($MILLION)
TABLE 36.FRANCE HYPERSONIC TECHNOLOGY MARKET, BY LAUNCH MODE, 2020–2030 ($MILLION)
TABLE 37.FRANCE HYPERSONIC TECHNOLOGY MARKET, BY END-USER, 2020–2030 ($MILLION)
TABLE 38.FRANCE HYPERSONIC TECHNOLOGY MARKET, BY TYPE, 2020–2030 ($MILLION)
TABLE 39.RUSSIA HYPERSONIC TECHNOLOGY MARKET, BY LAUNCH MODE, 2020–2030 ($MILLION)
TABLE 40.RUSSIA HYPERSONIC TECHNOLOGY MARKET, BY END-USER, 2020–2030 ($MILLION)
TABLE 41.RUSSIA HYPERSONIC TECHNOLOGY MARKET, BY TYPE, 2020–2030 ($MILLION)
TABLE 42.REST OF EUROPE HYPERSONIC TECHNOLOGY MARKET, BY LAUNCH MODE, 2020–2030 ($MILLION)
TABLE 43.REST OF EUROPE HYPERSONIC TECHNOLOGY MARKET, BY END-USER, 2020–2030 ($MILLION)
TABLE 44.REST OF EUROPE HYPERSONIC TECHNOLOGY MARKET, BY TYPE, 2020–2030 ($MILLION)
TABLE 45.ASIA-PACIFIC HYPERSONIC TECHNOLOGY MARKET, BY LAUNCH MODE, 2020–2030 ($MILLION)
TABLE 46.ASIA-PACIFIC HYPERSONIC TECHNOLOGY MARKET, BY END-USER, 2020–2030 ($MILLION)
TABLE 47.ASIA-PACIFIC HYPERSONIC TECHNOLOGY MARKET, BY TYPE, 2020–2030 ($MILLION)
TABLE 48.CHINA HYPERSONIC TECHNOLOGY MARKET, BY LAUNCH MODE, 2020–2030 ($MILLION)
TABLE 49.CHINA HYPERSONIC TECHNOLOGY MARKET, BY END-USER, 2020–2030 ($MILLION)
TABLE 50.CHINA HYPERSONIC TECHNOLOGY MARKET, BY TYPE, 2020–2030 ($MILLION)
TABLE 51.JAPAN HYPERSONIC TECHNOLOGY MARKET, BY LAUNCH MODE, 2020–2030 ($MILLION)
TABLE 52.JAPAN HYPERSONIC TECHNOLOGY MARKET, BY END-USER, 2020–2030 ($MILLION)
TABLE 53.JAPAN HYPERSONIC TECHNOLOGY MARKET, BY TYPE, 2020–2030 ($MILLION)
TABLE 54.INDIA HYPERSONIC TECHNOLOGY MARKET, BY LAUNCH MODE, 2020–2030 ($MILLION)
TABLE 55.INDIA HYPERSONIC TECHNOLOGY MARKET, BY END-USER, 2020–2030 ($MILLION)
TABLE 56.INDIA HYPERSONIC TECHNOLOGY MARKET, BY TYPE, 2020–2030 ($MILLION)
TABLE 57.SOUTH KOREA HYPERSONIC TECHNOLOGY MARKET, BY LAUNCH MODE, 2020–2030 ($MILLION)
TABLE 58.SOUTH KOREA HYPERSONIC TECHNOLOGY MARKET, BY END-USER, 2020–2030 ($MILLION)
TABLE 59.SOUTH KOREA HYPERSONIC TECHNOLOGY MARKET, BY TYPE, 2020–2030 ($MILLION)
TABLE 60.REST OF ASIA-PACIFIC HYPERSONIC TECHNOLOGY MARKET, BY LAUNCH MODE, 2020–2030 ($MILLION)
TABLE 61.REST OF ASIA-PACIFIC HYPERSONIC TECHNOLOGY MARKET, BY END-USER, 2020–2030 ($MILLION)
TABLE 62.REST OF ASIA-PACIFIC HYPERSONIC TECHNOLOGY MARKET, BY TYPE, 2020–2030 ($MILLION)
TABLE 63.LAMEA HYPERSONIC TECHNOLOGY MARKET, BY LAUNCH MODE, 2020–2030 ($MILLION)
TABLE 64.LAMEA HYPERSONIC TECHNOLOGY MARKET, BY END-USER, 2020–2030 ($MILLION)
TABLE 65.LAMEA HYPERSONIC TECHNOLOGY MARKET, BY TYPE, 2020–2030 ($MILLION)
TABLE 66.LATIN AMERICA HYPERSONIC TECHNOLOGY MARKET, BY LAUNCH MODE, 2020–2030 ($MILLION)
TABLE 67.LATIN AMERICA HYPERSONIC TECHNOLOGY MARKET, BY END-USER, 2020–2030 ($MILLION)
TABLE 68.LATIN AMERICA HYPERSONIC TECHNOLOGY MARKET, BY TYPE, 2020–2030 ($MILLION)
TABLE 69.MIDDLE EAST HYPERSONIC TECHNOLOGY MARKET, BY LAUNCH MODE, 2020–2030 ($MILLION)
TABLE 70.MIDDLE EAST HYPERSONIC TECHNOLOGY MARKET, BY END-USER, 2020–2030 ($MILLION)
TABLE 71.MIDDLE EAST HYPERSONIC TECHNOLOGY MARKET, BY TYPE, 2020–2030 ($MILLION)
TABLE 72.AFRICA HYPERSONIC TECHNOLOGY MARKET, BY LAUNCH MODE, 2020–2030 ($MILLION)
TABLE 73.AFRICA HYPERSONIC TECHNOLOGY MARKET, BY END-USER, 2020–2030 ($MILLION)
TABLE 74.AFRICA HYPERSONIC TECHNOLOGY MARKET, BY TYPE, 2020–2030 ($MILLION)
TABLE 75.BAE SYSTEMS PLC: COMPANY SNAPSHOT
TABLE 76.BAE SYSTEMS PLC: OPERATING SEGMENTS
TABLE 77.BAE SYSTEMS PLC: PRODUCT PORTFOLIO
TABLE 78.BAE SYSTEMS PLC: KEY STRATEGIC MOVES AND DEVELOPMENTS
TABLE 79.DYNETICS, INC.: COMPANY SNAPSHOT
TABLE 80.DYNETICS, INC. OPERATING SEGMENTS
TABLE 81.DYNETICS, INC.: PRODUCT PORTFOLIO
TABLE 82.DYNETICS, INC.: KEY STRATEGIC MOVES AND DEVELOPMENTS
TABLE 83.HERMEUS CORP.: COMPANY SNAPSHOT
TABLE 84.HERMEUS CORP.: PRODUCT PORTFOLIO
TABLE 85.HERMEUS CORP.: KEY STRATEGIC MOVES AND DEVELOPMENTS
TABLE 86.LOCKHEED MARTIN CORPORATION: COMPANY SNAPSHOT
TABLE 87.LOCKHEED MARTIN CORPORATION: OPERATING SEGMENTS
TABLE 88.LOCKHEED MARTIN CORPORATION: PRODUCT PORTFOLIO
TABLE 89.LOCKHEED MARTIN CORPORATION: KEY STRATEGIC MOVES AND DEVELOPMENTS
TABLE 90.MBDA: COMPANY SNAPSHOT
TABLE 91.MBDA: PRODUCT PORTFOLIO
TABLE 92.MBDA: KEY STRATEGIC MOVES AND DEVELOPMENTS
TABLE 93.NORTHROP GRUMMAN CORPORATION: COMPANY SNAPSHOT
TABLE 94.NORTHROP GRUMMAN CORPORATION: OPERATING SEGMENTS
TABLE 95.NORTHROP GRUMMAN CORPORATION: PRODUCT PORTFOLIO
TABLE 96.NORTHROP GRUMMAN CORPORATION: KEY STRATEGIC MOVES AND DEVELOPMENTS
TABLE 97.RAYTHEON TECHNOLOGIES CORPORATION: COMPANY SNAPSHOT
TABLE 98.RAYTHEON TECHNOLOGIES CORPORATION: OPERATING SEGMENTS
TABLE 99.RAYTHEON TECHNOLOGIES CORPORATION: PRODUCT PORTFOLIO
TABLE 100.REACTION ENGINES: COMPANY SNAPSHOT
TABLE 101.REACTION ENGINES: PRODUCT PORTFOLIO
TABLE 102.REACTION ENGINES: KEY STRATEGIC MOVES AND DEVELOPMENTS
TABLE 103.THE BOEING COMPANY: KEY EXECUTIVES
TABLE 104.THE BOEING COMPANY: COMPANY SNAPSHOT
TABLE 105.THE BOEING COMPANY: OPERATING SEGMENTS
TABLE 106.THE BOEING COMPANY: PRODUCT PORTFOLIO
TABLE 107.THE BOEING COMPANY: KEY STRATEGIC MOVES AND DEVELOPMENTS
TABLE 108.VELONTRA: COMPANY SNAPSHOT
TABLE 109.VELONTRA: PRODUCT PORTFOLIO
TABLE 110.VELONTRA: KEY STRATEGIC MOVES AND DEVELOPMENTS

LIST OF FIGURES

FIGURE 01.KEY MARKET SEGMENTS
FIGURE 02.EXECUTIVE SUMMARY
FIGURE 03.EXECUTIVE SUMMARY
FIGURE 04.TOP IMPACTING FACTORS
FIGURE 05.TOP INVESTMENT POCKETS
FIGURE 06.TOP WINNING STRATEGIES, BY YEAR, 2019–2021*
FIGURE 07.TOP WINNING STRATEGIES, BY DEVELOPMENT, 2019–2021*
FIGURE 08.TOP WINNING STRATEGIES, BY COMPANY, 2019–2021*
FIGURE 09.LOW-TO-HIGH BARGAINING POWER OF SUPPLIERS
FIGURE 10.MODERATE-TO-HIGH THREAT OF NEW ENTRANTS
FIGURE 11.LOW-TO-MODERATE THREAT OF SUBSTITUTES
FIGURE 12.LOW-TO-HIGH INTENSITY OF RIVALRY
FIGURE 13.LOW-TO-HIGH MODERATE POWER OF BUYERS
FIGURE 14.KEY PLAYER POSITIONING (2020)
FIGURE 15.HYPERSONIC TECHNOLOGY MARKET SHARE, BY LAUNCH MODE, 2020–2030 (%)
FIGURE 16.COMPARATIVE SHARE ANALYSIS OF HYPERSONIC TECHNOLOGY MARKET FOR AIR LAUNCHED, BY COUNTRY, 2020 & 2030 (%)
FIGURE 17.COMPARATIVE SHARE ANALYSIS OF HYPERSONIC TECHNOLOGY MARKET FOR SURFACE LAUNCHED,  BY COUNTRY, 2020 & 2030 (%)
FIGURE 18.COMPARATIVE SHARE ANALYSIS OF HYPERSONIC TECHNOLOGY MARKET FOR SUBSEA LAUNCHED,  BY COUNTRY, 2020 & 2030 (%)
FIGURE 19.HYPERSONIC TECHNOLOGY MARKET SHARE, BY END-USER, 2020–2030 (%)
FIGURE 20.COMPARATIVE SHARE ANALYSIS OF HYPERSONIC TECHNOLOGY MARKET FOR MILITARY, BY COUNTRY, 2020 & 2030 (%)
FIGURE 21.COMPARATIVE SHARE ANALYSIS OF HYPERSONIC TECHNOLOGY MARKET FOR AIR FORCE, BY COUNTRY, 2020 & 2030 (%)
FIGURE 22.COMPARATIVE SHARE ANALYSIS OF HYPERSONIC TECHNOLOGY MARKET FOR NAVY, BY COUNTRY, 2020 & 2030 (%)
FIGURE 23.COMPARATIVE SHARE ANALYSIS OF HYPERSONIC TECHNOLOGY MARKET FOR SPACE, BY COUNTRY, 2020 & 2030 (%)
FIGURE 24.HYPERSONIC TECHNOLOGY MARKET SHARE, BY TYPE, 2020–2030 (%)
FIGURE 25.COMPARATIVE SHARE ANALYSIS OF HYPERSONIC TECHNOLOGY MARKET FOR HYPERSONIC GLIDE VEHICLE, BY COUNTRY, 2020 & 2030 (%)
FIGURE 26.COMPARATIVE SHARE ANALYSIS OF HYPERSONIC TECHNOLOGY MARKET FOR HYPERSONIC CRUISE MISSILE, BY COUNTRY, 2020 & 2030 (%)
FIGURE 27.COMPARATIVE SHARE ANALYSIS OF HYPERSONIC TECHNOLOGY MARKET FOR HYPERSONIC SPACEPLANES, BY COUNTRY, 2020 & 2030 (%)
FIGURE 28.HYPERSONIC TECHNOLOGY MARKET, BY REGION, 2020–2030 (%)
FIGURE 29.COMPARATIVE SHARE ANALYSIS OF HYPERSONIC TECHNOLOGY MARKET, BY COUNTRY, 2020–2030 (%)
FIGURE 30.U.S. HYPERSONIC TECHNOLOGY MARKET, 2020–2030 ($MILLION)
FIGURE 31.CANADA HYPERSONIC TECHNOLOGY MARKET, 2020–2030 ($MILLION)
FIGURE 32.MEXICO HYPERSONIC TECHNOLOGY MARKET, 2020–2030 ($MILLION)
FIGURE 33.COMPARATIVE SHARE ANALYSIS OF HYPERSONIC TECHNOLOGY MARKET, BY COUNTRY, 2020–2030 (%)
FIGURE 34.GERMANY HYPERSONIC TECHNOLOGY MARKET, 2020–2030 ($MILLION)
FIGURE 35.UK HYPERSONIC TECHNOLOGY MARKET, 2020–2030 ($MILLION)
FIGURE 36.FRANCE HYPERSONIC TECHNOLOGY MARKET, 2020–2030 ($MILLION)
FIGURE 37.RUSSIA HYPERSONIC TECHNOLOGY MARKET, 2020–2030 ($MILLION)
FIGURE 38.REST OF EUROPE HYPERSONIC TECHNOLOGY MARKET, 2020–2030 ($MILLION)
FIGURE 39.COMPARATIVE SHARE ANALYSIS OF HYPERSONIC TECHNOLOGY MARKET, BY COUNTRY, 2020–2030 (%)
FIGURE 40.CHINA HYPERSONIC TECHNOLOGY MARKET, 2020–2030 ($MILLION)
FIGURE 41.JAPAN HYPERSONIC TECHNOLOGY MARKET, 2020–2030 ($MILLION)
FIGURE 42.INDIA HYPERSONIC TECHNOLOGY MARKET, 2020–2030 ($MILLION)
FIGURE 43.SOUTH KOREA HYPERSONIC TECHNOLOGY MARKET, 2020–2030 ($MILLION)
FIGURE 44.REST OF ASIA-PACIFIC HYPERSONIC TECHNOLOGY MARKET, 2020–2030 ($MILLION)
FIGURE 45.COMPARATIVE SHARE ANALYSIS OF HYPERSONIC TECHNOLOGY MARKET, BY COUNTRY, 2020–2030 (%)
FIGURE 46.LATIN AMERICA HYPERSONIC TECHNOLOGY MARKET, 2020–2030 ($MILLION)
FIGURE 47.MIDDLE EAST HYPERSONIC TECHNOLOGY MARKET, 2020–2030 ($MILLION)
FIGURE 48.AFRICA HYPERSONIC TECHNOLOGY MARKET, 2020–2030 ($MILLION)
FIGURE 49.BAE SYSTEMS PLC: REVENUE, 2018–2020 ($MILLION)
FIGURE 50.BAE SYSTEMS PLC: REVENUE SHARE BY SEGMENT, 2020 (%)
FIGURE 51.BAE SYSTEMS PLC: REVENUE SHARE BY REGION, 2020 (%)
FIGURE 52.DYNETICS, INC. 2018–2020 ($MILLION)
FIGURE 53.DYNETICS, INC.: REVENUE SHARE BY SEGMENT, 2020 (%)
FIGURE 54.LOCKHEED MARTIN CORPORATION: REVENUE, 2018–2020 ($MILLION)
FIGURE 55.LOCKHEED MARTIN CORPORATION: REVENUE SHARE BY SEGMENT, 2020 (%)
FIGURE 56.LOCKHEED MARTIN CORPORATION: REVENUE SHARE BY REGION, 2020 (%)
FIGURE 57.MBDA: REVENUE, 2018–2020 ($MILLION)
FIGURE 58.NORTHROP GRUMMAN CORPORATION: REVENUE, 2018–2020 ($MILLION)
FIGURE 59.NORTHROP GRUMMAN CORPORATION: REVENUE SHARE BY SEGMENT, 2020 (%)
FIGURE 60.NORTHROP GRUMMAN CORPORATION: REVENUE SHARE BY REGION, 2020 (%)
FIGURE 61.RAYTHEON TECHNOLOGIES CORPORATION: REVENUE, 2018–2020 ($MILLION)
FIGURE 62.RAYTHEON TECHNOLOGIES CORPORATION: REVENUE SHARE BY SEGMENT, 2020 (%)
FIGURE 63.RAYTHEON TECHNOLOGIES CORPORATION: REVENUE SHARE BY REGION, 2020 (%)
FIGURE 64.THE BOEING COMPANY: REVENUE, 2018–2020 ($MILLION)
FIGURE 65.THE BOEING COMPANY: REVENUE SHARE BY SEGMENT, 2020 (%)
FIGURE 66.THE BOEING COMPANY: REVENUE SHARE BY REGION, 2020 (%)


The global hypersonic technology market is expected to witness significant growth, owing to rise in defense spending along with rise in defense modernization programs that aim to equip defense forces with the modern, more lethal and fast response technologies, making defense systems more reliable, robust, efficient, and accurate.

Rise in number of territorial conflicts throughout the world and increase in developments regarding deployment of hypersonic technologies across the globe are expected to drive the hypersonic technology market during the forecast period. However, testing challenges of hypersonic technologies and materials development challenges are anticipated to hamper growth of the market. Moreover, advancements in scramjet technology for hypersonic missiles and rise in defense spending globally are expected to offer lucrative opportunities for the market in the future.

In order to gain a fair share of the market, major players adopted different strategies, for instance, product development, contract, partnership, and acquisition. Among these, contract and product development are the leading strategies used by prominent players such as BAE Systems plc, Dynetics, Inc., MBDA, Northrop Grumman Corporation, and Velontra. Aforementioned Companies signed contracts with the defense forces seeking to develop cutting-edge hypersonic technologies.

PURCHASE OPTIONS

Call or Email us

U.S.-Canada Toll-free: +1-800-792-5285
Int'l : +1-503-894-6022
Europe : +44-845-528-1300
Email : help@alliedmarketresearch.com
 
FREQUENTLY ASKED QUESTIONS?

A. The global hypersonic technology market valued at $4,980.65 million in 2020, and is projected to reach $12,183.65 million by 2030, registering a CAGR of 9.7% from 2021 to 2030.

A. Hypersonic technologies can enable a new class of flight vehicles that enable faster access to space, rapid military response at long range, and faster means of commercial air travel.

A. The report sample for global hypersonic technology market report can be obtained on demand from the website.

A. Leading players in the field of hypersonic technologies are the U.S., China, and Russia

A. Between 2021 and 2030, the hypersonic technology market is expected to witness a CAGR of 9.7%

A. The company profiles of the top players of the market can be obtained from the company profile section mentioned in the report. This section includes analysis of top ten player’s operating in the industry along with their last three-year revenue, segmental revenue, product offerings, key strategies adopted, and geographical revenue generated

A. Rise in number of territorial conflicts throughout the world and increase in developments regarding the deployment of hypersonic technologies across the world are the factors that are expected to fuel the growth of the market during the forecast period

A. Increase in the deployment of cutting-edge hypersonic weapons worldwide, advent of hypersonic aircraft

A. The U.S. and China are the key matured markets growing in the hypersonic technology industry

Looking for Customization?

 Customization Request

Have a Question?

 Speak with Analyst

Any Confusion?

 Inquire Before Buying

Have a glance of the Report

  Request Sample
RELATED TAGS

Purchase Full Report of
Hypersonic Technology Market

Start reading instantly.
This Report and over 66,905+ more Reports, Available with Avenue Library. T&C*.

  • Online Only
  • $3,456
  • Online cloud access only
  • Restricted print, copy, paste & download
  • Read only
  • Free industry update
    (Within 180 days)
  • Free report update in next update cycle
    (Sep 2022 - Sep 2023)
  • Data Pack
  • $3,840
  • Restricted to one authorized user
  • One print only
  • Available in
    Excel
  • Free industry update
    (Within 180 days)
  •   Free report update in next update cycle
    (Sep 2022 - Sep 2023)
  • Single User
  • $5,769
  • Restricted to one authorized user
  • One print only
  • Available in
    PDF
  • Free industry update
    (Within 180 days)
  •   Free report update in next update cycle
    (Sep 2022 - Sep 2023)
  • Five Users
  • $6,450
  • Limited to five authorized users
  • Print upto five copies
  • Available in
    PDF
  • Free industry update
    (Within 180 days)
  •   Free report update in next update cycle
    (Sep 2022 - Sep 2023)
  • Enterprise
    License/PDF

  • $10,995
  • Unlimited
    within
    company/enterprise
  • Available in Excel & PDF
  • Free industry update
    (Within 180 days)
  •   Free report update in next update cycle
    (Sep 2022 - Sep 2023)
  • Library
    Membership

  • $999 $ 1,175
    Per User/ Per month/ Billed annually
  • Published Content
    E-access
  • Company Profiles
    E-access
  • Newly Added Content Access
  • 10 PDF
    Downloads
  • 5 Excel Data
    Pack Downloads
  • 250 Company Profiles PDF Downloads
  • Buy Now

*Taxes/Fees, if applicable will be added during checkout. All prices in USD

RELATED REPORTS
 

Why Allied Market Research?


Infallible Methodology

To ensure high-level data integrity, accurate analysis, and impeccable forecasts

Analyst Support

For complete satisfaction

Customization

On-demand customization of scope of the report to exactly meet your needs

TARGETED MARKET VIEW

Targeted market view to provide pertinent information and save time of readers

Get fresh content delivered

Get insights on topics that are crucial for your business. Stay abreast of your interest areas.

Get Industry Data Alerts

Why Allied Market Research?

Infallible Methodology

To ensure high-level data integrity, accurate analysis, and impeccable forecasts

Analyst Support

For complete satisfaction

Customization

On-demand customization of scope of the report to exactly meet your needs

TARGETED MARKET VIEW

Targeted market view to provide pertinent information and save time of readers