
Ice Thermal Energy Storage Market Research, 2030
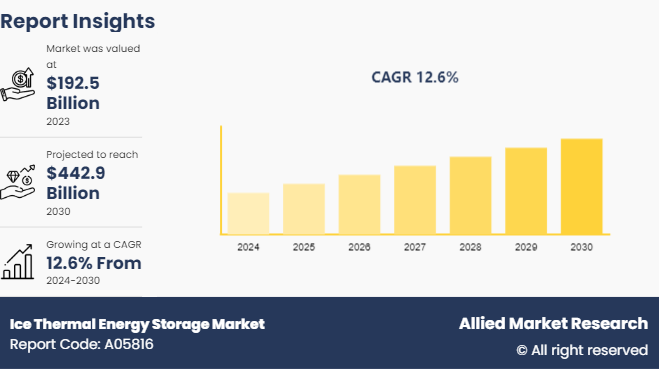
The global ice thermal energy storage market size was valued at $192.5 billion in 2023, and is projected to reach $442.9 billion by 2030, growing at a CAGR of 12.6% from 2024 to 2030.
Market Introduction and Definition
Ice thermal energy storage (ITES) is a technology used for storing thermal energy by freezing water into ice during periods of low energy demand, typically at night, and then using the stored ice to provide cooling during periods of high energy demand, usually during the day. This process helps to balance energy supply and demand, reduce energy costs, and enhance the efficiency of cooling systems. In addition, Ice thermal energy storage systems contribute to sustainability efforts by enhancing the efficiency of energy use and reducing greenhouse gas emissions. The integration of ITES with renewable energy sources, such as solar or wind power, further improve environmental benefits by ensuring that excess renewable energy generated during off-peak hours is effectively utilized.
Key Takeaways
The ice thermal energy storage market report covers 20 countries. The research includes a segment analysis of each country in terms of value ($billion) for the projected period 2023-2030.
More than 1, 800 product literatures, industry releases, annual reports, and other such documents of major ice thermal energy storage industry participants along with authentic industry journals, trade associations' releases, and government websites have been reviewed for generating high-value industry insights.
The study integrated high-quality data, professional opinions and analysis, and critical independent perspectives. The research approach is intended to provide a balanced view of global markets and to assist stakeholders in making educated decisions to achieve their most ambitious growth objectives.
Key Market Dynamics
Ice thermal energy storage works by using electricity during off-peak hours to freeze water into ice. This ice is then used during peak demand periods to provide cooling, significantly reducing the need for electricity when demand and rates are highest. This process helps in flattening the load curve, leading to more stable and efficient operation of the power grid. By reducing the need for power plants to ramp up production during peak hours, ice TES systems contribute to a more balanced and efficient energy distribution network. In addition, the integration of ice TES systems in commercial and industrial buildings can lead to substantial energy savings. These systems allow facilities to reduce their peak demand charges, which are often a significant portion of their electricity bills. In climates with high cooling needs, ice TES systems can provide a cost-effective and energy-efficient solution for air conditioning, thereby enhancing the overall energy efficiency of the building. All these factors are expected to drive the demand for the ice thermal energy storage market during the forecast period.
However, the high capital investment is compounded by the fact that the benefits of ITES systems, such as energy cost savings and reduced peak demand charges, are realized over a long period. This extended payback period can make the technology less attractive to potential users who seek quicker returns on their investments. Financial decision-makers often prioritize projects with shorter payback times, and the lengthy period required to recoup the initial costs of ITES results in hesitation and reluctance to adopt the technology. All these factors are hamper the growth of the ice thermal energy storage market growth.
As renewable energy sources such as solar and wind become more prevalent, the energy grid faces the challenge of managing the intermittent and variable nature of these sources. Renewable energy generation is not constant it fluctuates based on weather conditions and time of day, which lead to periods of surplus energy production followed by periods of low generation. ITES systems play a crucial role in addressing this challenge by storing excess renewable energy during times of high production. This stored energy is used to create ice, which can be melted later to provide cooling during periods when renewable energy generation is low or energy demand is high, thereby balancing the supply and demand on the grid. All these factors are anticipated to offer new growth opportunities in ice thermal energy storage market forecast.
Patent Analysis for Ice Thermal Energy Storage Market

The U.S. collectively hold less than half of the total ice thermal energy storage patents that indicate strong innovation and investment in this technology in U.S. countries. This suggests fierce competition and a significant focus on ice thermal energy storage R&D in these leading economies. U.S. has the highest patent filed those accounts for 43% of the total global patents related to the ice thermal energy storage market. Europe and PCT, although holding smaller percentages of ice thermal energy storage patents individually, collectively contribute to the overall Asian dominance in ice thermal energy storage innovation. This reflects the region's strong presence in materials science and engineering R&D.
Market Segmentation
The ice thermal energy storage market is segmented by system, ice storage type, application, and region. Based on system, the market is classified into simple, and detailed. By ice storage type, the market is classified into ice on coil internal and ice on coil external. By application, the market is divided into residential, commercial, and industrial. Region-wise, the market is analyzed across North America, Europe, Asia-Pacific, and LAMEA.
Regional Market Outlook
Rapid urbanization and industrialization in Asia-Pacific drives the significant investments in energy storage solution. Governments countries such as China, India, Japan, and South Korea. As these economies continue to grow, the need for reliable and efficient energy storage solutions has become increasingly important to manage peak electricity demand and reduce the strain on power grids. Ice TES systems are particularly attractive in these markets due to their ability to store cooling energy during off-peak hours and release it during peak hours, thus optimizing energy consumption and reducing electricity costs. According to research agency ICRA, India's installed renewable energy capacity is projected to rise to approximately 170 GW by March 2025, up from the current 136.57 GW recorded as of December 2023. This growth underscores a significant expansion in India's renewable energy infrastructure over the coming years.
Competitive Landscape
The major players operating in the ice thermal energy storage market overview BrightSource Energy, Brenmiller Energy Ltd, ICE ENERGY SOLUTIONS PVT LTD, Thermofin, Thermal Energy International Inc., Terrafore Technologies LLC, Waaree Energies Ltd. EVAPCO, Inc., Enphase Energy., Viking Cold Solutions, Inc., HTS, IMEC Electro Mechanical Engineering, and others.
Net Solar PV Electricity Capacity Additions by Geography

Net solar PV electricity capacity has had a profound impact on ice thermal energy storage systems worldwide. As countries or region such as China, Europe, the U.S., India, and Brazil have significantly increased their solar PV capacity in 2023, the demand for efficient energy storage solutions has grown in tandem. Ice thermal energy storage systems have emerged as a viable solution to manage and store excess electricity generated from solar PV during peak production hours. The varying solar PV electricity capacities across different countries in 2023 China leading with 147.6 GW, followed by Europe with 45.1 GW, the U.S. with 27.2 GW, India with 16.4 GW, and Brazil with 10.5 GW have collectively spurred the adoption and evolution of ice Thermal Energy Storage (TES) systems.
Industry Trends
According to India Brand Equity Foundation (IBEF) , Ministry of New and Renewable Energy targets 500 GW non-fossil-based electricity generation by 2030, as per the Prime Minister's COP26 announcement, with an added installation of 13.5 GW renewable energy capacity in 2023, corresponding to an investment of around $ 8.90 billion.
In July 2023, Brenmiller Energy Ltd., a clean energy company specializing in Thermal Energy Storage (TES) systems for global industrial and utility markets, announced a partnership with Waaree Energies Ltd. to implement their bGen TES technology in India.
In May 2023, Brenmiller has inaugurated its first thermal energy storage gigafactory in Dimona, Israel. The factory is anticipated to achieve a total annual capacity of 4 GWh by the end of 2023. To support the construction of the facility, the company has secured an $8 million credit line from the European Investment Bank (EIB) .
Key Sources Referred
Invest India
International Renewable Energy Agency (IREA)
India brand Equity foundation (IBEF)
Air-Conditioning, Heating, and Refrigeration Institute
Department of Energy
World Economic Forum
Key Benefits For Stakeholders
This report provides a quantitative analysis of the market segments, current trends, estimations, and dynamics of the ice thermal energy storage market analysis from 2024 to 2030 to identify the prevailing ice thermal energy storage market opportunities.
The market research is offered along with information related to key drivers, restraints, and opportunities.
Porter's five forces analysis highlights the potency of buyers and suppliers to enable stakeholders make profit-oriented business decisions and strengthen their supplier-buyer network.
In-depth analysis of the ice thermal energy storage market statistics and segmentation assists to determine the prevailing market opportunities.
Major countries in each region are mapped according to their ice thermal energy storage market share.
Market player positioning facilitates benchmarking and provides a clear understanding of the present position of the market players.
The report includes the analysis of the regional as well as global ice thermal energy storage market trends, key players, market segments, application areas, and market growth strategies.
Ice Thermal Energy Storage Market Report Highlights
| Aspects | Details |
| Market Size By 2030 | USD 442.9 Billion |
| Growth Rate | CAGR of 12.6% |
| Forecast period | 2024 - 2030 |
| Report Pages | 340 |
| By System |
|
| By Ice Storage Type |
|
| By Application |
|
| By Region |
|
| Key Market Players | Enphase Energy., EVAPCO, Inc., Terrafore Technologies LLC, ICE ENERGY SOLUTIONS PVT LTD, Thermal Energy International Inc., IMEC Electro Mechanical Engineering, BrightSource Energy, Waaree Energies Ltd., Thermofin, Viking Cold Solutions, Inc. |
Demand for renewable energy integration, technological advancements in thermal storage systems are the upcoming trends of Ice Thermal Energy Storage Market in the world.
Commercial is the leading application of Ice Thermal Energy Storage Market.
Asia-Pacific is the largest regional market for Ice Thermal Energy Storage
$442.9 billion is the estimated industry size of Ice Thermal Energy Storage by 2030.
BrightSource Energy, Brenmiller Energy Ltd, ICE ENERGY SOLUTIONS PVT LTD, Thermofin, Thermal Energy International Inc., Terrafore Technologies LLC, Waaree Energies Ltd. EVAPCO, Inc., Enphase Energy., Viking Cold Solutions, Inc., HTS, IMEC Electro Mechanical Engine are the top companies to hold the market share in Ice Thermal Energy Storage
Loading Table Of Content...

