In Vitro Toxicity Testing Market (By Type: Absorption, Toxic Substances, and Dose; End Users: Cosmetics and Household Products, Pharmaceutical Industry, Food Industry, and Chemical Industry) - Global Opportunity Analysis and Industry Forecast, 2014-2022 Update Available On-Demand
A01199 | Pages: 110 | Dec 2016 | 7166 Views | | |
Author(s) : Sriram Radhakrishnan | Tables: 7 | Charts: NA | Formats*: | |
COVID-19
Pandemic disrupted the entire world and affected many industries.
Get detailed COVID-19 impact analysis on the In Vitro Toxicity Testing Market
Request Now !In Vitro Toxicity Testing Market Overview:
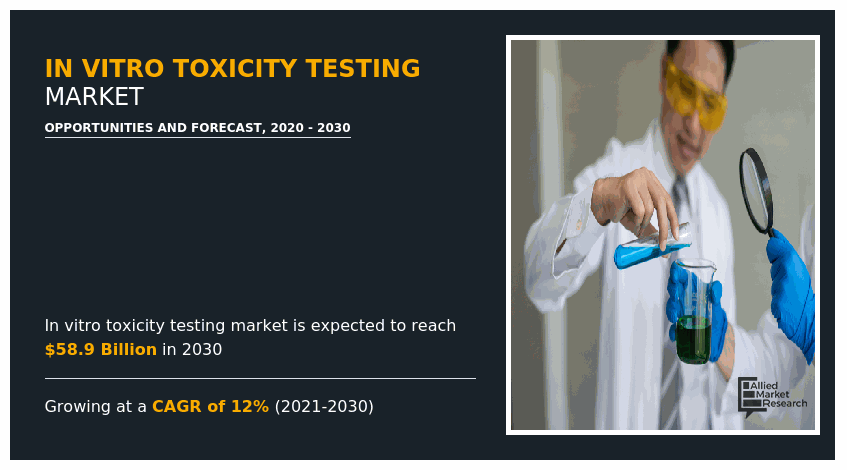
Global In Vitro Toxicity Testing(IVTT) Market was valued at $3,366 million in 2016, and is expected to reach $7,813 million by 2022, supported by a CAGR of 15.01% during the forecast period 2016 - 2022. In vitro is the process that helps examine harmful chemicals over the isolated part of the organism. It is used to identify hazardous chemical substances and helps detect the toxicity at early stages of the development of new products such as drugs, cosmetics, and food additives. The in vitro toxicity testing is mainly used for safety evaluation in drug development and also for ranking the chemicals according to their potency. The absorption, distribution, metabolism, excretion (ADME), dose response, threshold response of drug can also be determined by the in vitro toxicity testing.
Get more information on this report : Request Sample PagesÂ
The global in vitro toxicity testing market is expected to witness notable growth during the analysis period due to the increase in number of R&D procedures, which require in vitro testing, ban on animal testing, and increase in awareness about the environmental concerns. In addition, advancement in genetics and genetic screening approaches and emergence of new approaches of 3D cell culture can boost the in vitro toxicity testing market. The large size companies have focused on new product launch to meet the specific requirements of the researchers.
In Vitro Toxicity Testing Market Segment Review
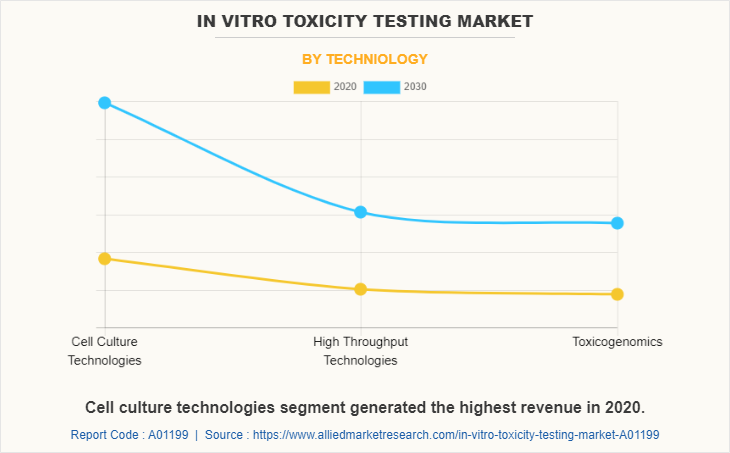
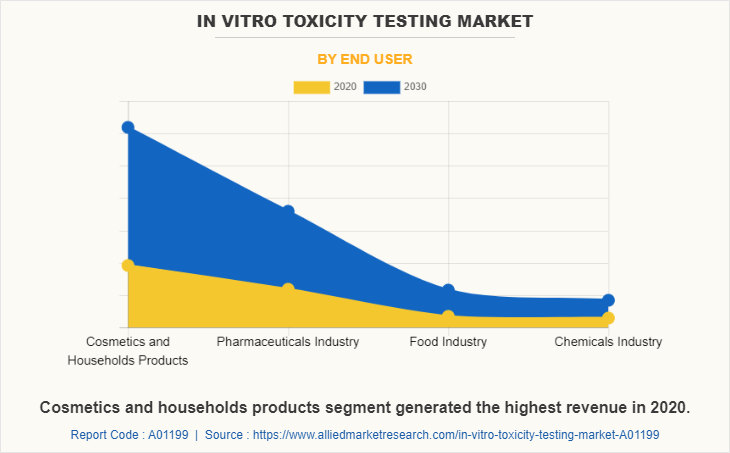
The report analyzes the in vitro toxicity testing market into three segments, namely: type, end users, and geography. By type, the market is segmented into absorption, toxic substances, and dose. Based on end users, the market is categorized into cosmetic and household products, pharmaceutical industry, food industry, and chemical industry. Based on geography, the in vitro toxicity testing market is categorized into North America, Europe, Asia-Pacific, and LAMEA.
Â
At present, absorption segment has witnessed large-scale adoption of IVTT market. Toxic substances and dose screening are some of the other segments in the global IVTT market. These segments are anticipated to witness increase in market share due to increase in the demand for IVTT in pharmaceutical, chemicals, cosmetics, and household products. Moreover, stringent government regulations to reduce the cruelty while performing experiment on animals, increase global illicit drug abusers and enhanced efficiency of IVTT in diagnosis are some other driving factors of this market. However, decrease in adoption rate of IVTT and incapability of IVTT to detect toxicities due to autoimmunity and immunostimulation can hinder the market growth.
Get more information on this report : Request Sample PagesÂ
The significant impacting factors include increase in demand for in vitro models as compared to in vivo models and screening of toxicity in early stages of drug development. Along with these factors, the market is influenced by the stringent government regulations towards the environment, increased global illicit drug abusers, enhanced efficiency of IVTT in cancer diagnosis, advancement in technologies of IVTT, and many others. However, each factor would have its definite impact on the market during the forecast period.
  Get more information on this report : Request Sample PagesÂ
The key players profiled in this report include Agilent Technologies, Inc., BioReliance, Inc., Alere, Inc., Charles River Laboratories International, Inc., General Electric Company, Covance, Inc., Catalent, Inc., Eurofins Scientific, Bio-Rad Laboratories, Inc., and Thermo Fisher Scientific, Inc. There are other players in the in vitro toxicity testing market, which include Cyprotex plc, Accelrys, Inc., Molecular Toxicology Inc., MatTek Corporation, Xenometrix AG, and Quest Diagnostics Incorporation.
IN VITRO TOXICITY TESTING MARKETÂ KEY BENEFITS:
The report provides an extensive analysis of the current trends and highlights the market potential from 2014 to 2022, in terms of value.
The market scenario is comprehensively analyzed with respect to the type and end users.
Comprehensive analysis of the patents is provided to determine the prevailing opportunities.
Recent developments, key manufacturers, and market shares are listed in this report to analyze the competitive scenario of the market.
In-depth analysis of the market based on geography gives an understanding of the regional market, which assists in strategic business planning.
IN VITRO TOXICITY TESTING MARKETÂ KEY SEGMENTS
The global in vitro toxicity testing market segmentation is explained below:
By Type
Absorption
Toxic Substances
Dose
By End users
Cosmetics and Household Products
Pharmaceutical Industry
Food Industry
Chemical Industry
By Geography
North America
Europe
Asia-Pacific
LAMEA
CHAPTER 1 INTRODUCTION
1.1 Report description
1.2 Key benefits
1.3 Key market segments
1.4 Research methodology
1.4.1 Secondary research
1.4.2 Primary research
1.4.3 Analyst tools and models
CHAPTER 2 EXECUTIVE SUMMARY
2.1 CXO perspective
CHAPTER 3 MARKET OVERVIEW
3.1 Market definition and scope
3.2 Key Findings
3.2.1 Top impacting factor
3.2.2 Top winning strategies
3.2.3 Top investment pockets
3.3 Value chain analysis
3.4 Porters five forces analysis
3.4.1 Low bargaining power of suppliers due to large number of suppliers and low switching cost
3.4.2 Moderate bargaining power of buyer due to high dem and, high product dependency and low switching cost
3.4.3 Moderate threat of substitutes due to less product differentiation and minimum ease of substitution
3.4.4 Moderate threat of substitutes due to increasing legal barriers, implementation of government policies and high dem and potential
3.4.5 Presence of numerous players, moderate product innovation and low switching cost increases the competition among rivalries
3.5 Drivers
3.5.1 Increased awareness of regulatory authorities concerning environment welfare
3.5.2 Replacement of in-vivo models by in-vitro models
3.5.3 Dem and of in-vitro methods for cancer diagnosis
3.5.4 Increase in global illicit drug abusers
3.6 RESTRAINTS
3.6.1 Reduction in adoption rate of in-vitro toxicity testing methods
3.6.2 Incapability of in vitro models to determine autoimmunity and immunostimulation
3.7 OPPORTUNITIES
3.7.1 Advancement in in-vitro technologies
3.7.2 Development of new in-vitro models
CHAPTER 4 WORLD IVTT MARKET, BY TYPE
4.1 Overview
4.2 Absorption
4.2.1 Key Market Trends
4.2.2 Key Growth Factors and Opportunities
4.2.3 Market Size and Forecast
4.2.4 North America Absorption Market, ($Million), Growth (%) 2014-2022
4.2.5 Europe Absorption Market, ($Million), Growth (%) 2014-2022
4.2.6 Asia-pacific Absorption Market, ($Million), Growth (%) 2014-2022
4.2.7 LAMEA Absorption Market, ($Million), Growth (%) 2014-2022
4.3 Toxic substances
4.3.1 Key Market Trends
4.3.2 Key Growth Factors and Opportunities
4.3.3 Market Size and Forecast
4.3.4 North America Toxic Substances Market, ($Million), Growth (%) 2014-2022
4.3.5 Europe Toxic Substances Market, ($Million), Growth (%) 2014-2022
4.3.6 Asia Pacific Toxic Substances Market, ($Million), Growth (%) 2014-2022
4.3.7 LAMEA Toxic Substances Market, ($Million), Growth (%) 2014-2022
4.4 Dose
4.4.1 Key Market Trends
4.4.2 Key Growth Factors and Opportunities
4.4.3 Market Size and Forecast
4.4.4 North America Dose Market, ($Million), Growth (%) 2014-2022
4.4.5 Europe Dose Market, ($Million), Growth (%) 2014-2022
4.4.6 Asia Pacific Dose Market, ($Million), Growth (%) 2014-2022
4.4.7 LAMEA Dose Market, ($Million), Growth (%) 2014-2022
CHAPTER 5 WORLD IVTT MARKET, BY END USER
5.1 Overview
5.2 Cosmetics and Household products
5.2.1 Key Market Trends
5.2.2 Key Growth Factors and Opportunities
5.2.3 Market Size and Forecast
5.2.4 North America Cosmetics and Household Products Market, ($Million), Growth (%) 2014-2022
5.2.5 Europe Cosmetics and Household Products Market, ($Million), Growth (%) 2014-2022
5.2.6 Asia Pacific Cosmetics and Household Products Market, ($Million), Growth (%) 2014-2022
5.2.7 LAMEA Cosmetics and Household Products Market, ($Million), Growth (%) 2014-2022
5.3 Pharmaceutical industry
5.3.1 Key Market Trends
5.3.2 Key Growth Factors and Opportunities
5.3.3 Market Size and Forecast
5.3.4 North America Pharmaceutical Industry Market, ($Million), Growth (%) 2014-2022
5.3.5 Europe Pharmaceutical Industry Market, ($Million), Growth (%) 2014-2022
5.3.6 Asia Pacific Pharmaceutical Industry Market, ($Million), Growth (%) 2014-2022
5.3.7 LAMEA Pharmaceutical Industry Market, ($Million), Growth (%) 2014-2022
5.4 Food industry
5.4.1 Key Market Trends
5.4.2 Key Growth Factors and Opportunities
5.4.3 Market Size and Forecast
5.4.4 North America Food Industry Market, ($Million), Growth (%) 2014-2022
5.4.5 Europe Food Industry Market, ($Million), Growth (%) 2014-2022
5.4.6 Asia-pacific Food Industry Market, ($Million), Growth (%) 2014-2022
5.4.7 LAMEA Food Industry Market, ($Million), Growth (%) 2014-2022
5.5 Chemical industry
5.5.1 Key Market Trends
5.5.2 Key Growth Factors and Opportunities
5.5.3 Market Size and Forecast
5.5.4 North America Chemical Industry Market, ($Million), Growth (%) 2014-2022
5.5.5 Europe Chemical Industry Market, ($Million), Growth (%) 2014-2022
5.5.6 Asia Pacific Chemical Industry Market, ($Million), Growth (%) 2014-2022
5.5.7 LAMEA Chemical Industry Market, ($Million), Growth (%) 2014-2022
CHAPTER 6 WORLD IVTT MARKET BY GEOGRAPHY
6.1 Overview
6.2 North America
6.2.1 Key Market Trends
6.2.2 Key Growth Factors and Opportunities
6.2.3 Market Size and Forecast
6.3 Europe
6.3.1 Key Market Trends
6.3.2 Key Growth Factors and Opportunities
6.3.3 Market Size and Forecast
6.4 Asia-Pacific
6.4.1 Key Market Trends
6.4.2 Key Growth Factors and Opportunities
6.4.3 Market Size and Forecast
6.5 LAMEA
6.5.1 Key Market Trends
6.5.2 Key Growth Factors and Opportunities
6.5.3 Market Size and Forecast
CHAPTER 7 COMPANY PROFILES
7.1 Agilent Technologies, Inc.
7.1.1 Company Snapshot
7.1.2 Operating business segments
7.1.3 Business performance
7.1.4 Key strategies & development
7.2 BioReliance, Inc.
7.2.1 Company Snapshot
7.2.2 Operating business segments
7.2.3 Business performance
7.2.4 Key strategies & development
7.3 Alere, Inc.
7.3.1 Company Snapshot
7.3.2 Operating business segments
7.3.3 Business performance
7.3.4 Key strategies & development
7.4 Charles River Laboratories International, Inc.
7.4.1 Company Snapshot
7.4.2 Operating business segments
7.4.3 Business performance
7.4.4 Key strategies & development
7.5 General Electric Company
7.5.1 Company Snapshot
7.5.2 Operating business segments
7.5.3 Business performance
7.5.4 Key strategies & development
7.6 Covance, Inc.
7.6.1 Company Snapshot
7.6.2 Operating business segments
7.6.3 Business performance
7.6.4 Key strategies & development
7.7 Catalent, Inc.
7.7.1 Company Snapshot
7.7.2 Operating business segments
7.7.3 Business performance
7.7.4 Key strategies & development
7.8 Eurofins Scientific
7.8.1 Company Snapshot
7.8.2 Operating business segments
7.8.3 Business performance
7.8.4 Key strategies & development
7.9 Bio-Rad Laboratories, Inc.
7.9.1 Company Snapshot
7.9.2 Operating business segments
7.9.3 Business performance
7.9.4 Key strategies & development
7.10 Thermo Fisher Scientific, Inc.
7.10.1 Company Snapshot
7.10.2 Operating business segments
7.10.3 Business performance
7.10.4 Key strategies & development
List of Figures
FIG. 1 TOP IMPACTING FACTORS
FIG. 2 TOP INVESTMENT POCKETS
FIG. 3 PORTERS FIVE FORCES ANALYSIS OF IVTT MARKET
FIG. 4 INCREASE NUMBER OF PEOPLE SUFFERING FROM COLON CANCER IN U.S., 2013-16
FIG. 5 WORLD IVTT MARKET BY TYPE, 2015(PIE CHART OF GLOBAL NUMBERS BY TYPE)
FIG. 6 WORLD IVTT MARKET BY END USER, 2015(PIE CHART OF GLOBAL NUMBERS BY END USER)
FIG. 7 WORLD IVTT MARKET BY GEOGRAPHY, 2015
List of Tables
TABLE 1 WORLD ABSORPTION MARKET, ($MILLION), GROWTH (%)2014-2022
TABLE 2 NORTH AMERICA ABSORPTION MARKET, ($MILLION), GROWTH (%) 2014-2022
TABLE 3 EUROPE ABSORPTION MARKET, ($MILLION), GROWTH (%) 2014-2022
TABLE 4 ASIA PACIFIC ABSORPTION MARKET, ($MILLION), GROWTH (%) 2014-2022
TABLE 5 LAMEA ABSORPTION MARKET, ($MILLION), GROWTH (%) 2014-2022
TABLE 6 WORLD TOXIC SUBSTANCES MARKET, ($MILLION), GROWTH (%)2014-2022
TABLE 7 NORTH AMERICA TOXIC SUBSTANCES MARKET, ($MILLION), GROWTH (%) 2014-2022
TABLE 8 EUROPE TOXIC SUBSTANCES MARKET, ($MILLION), GROWTH (%) 2014-2022
TABLE 9 ASIA PACIFIC TOXIC SUBSTANCES MARKET, ($MILLION), GROWTH (%) 2014-2022
TABLE 10 LAMEA TOXIC SUBSTANCES MARKET, ($MILLION), GROWTH (%) 2014-2022
TABLE 11 WORLD DOSE MARKET, ($MILLION), GROWTH (%)2014-2022
TABLE 12 NORTH AMERICA DOSE MARKET, ($MILLION), GROWTH (%) 2014-2022
TABLE 13 EUROPE DOSE MARKET, ($MILLION), GROWTH (%) 2014-2022
TABLE 14 ASIA PACIFIC DOSE MARKET, ($MILLION), GROWTH (%) 2014-2022
TABLE 15 LAMEA DOSE MARKET, ($MILLION), GROWTH (%) 2014-2022
TABLE 16 WORLD COSMETICS and HOUSEHOLD PRODUCTS MARKET, ($MILLION), GROWTH (%)2014-2022
TABLE 17 NORTH AMERICA COSMETICS and HOUSEHOLD PRODUCTS MARKET, ($MILLION), GROWTH (%) 2014-2022
TABLE 18 EUROPE COSMETICS and HOUSEHOLD PRODUCTS MARKET, ($MILLION), GROWTH (%) 2014-2022
TABLE 19 ASIA PACIFIC COSMETICS and HOUSEHOLD PRODUCTS MARKET, ($MILLION), GROWTH (%) 2014-2022
TABLE 20 LAMEA COSMETICS and HOUSEHOLD PRODUCTS MARKET, ($MILLION), GROWTH (%) 2014-2022
TABLE 21 WORLD PHARMACEUTICAL INDUSTRY MARKET, ($MILLION), GROWTH (%)2014-2022
TABLE 22 NORTH AMERICA PHARMACEUTICAL INDUSTRY MARKET, ($MILLION), GROWTH (%) 2014-2022
TABLE 23 EUROPE PHARMACEUTICAL INDUSTRY MARKET, ($MILLION), GROWTH (%) 2014-2022
TABLE 24 ASIA PACIFIC PHARMACEUTICAL INDUSTRY MARKET, ($MILLION), GROWTH (%) 2014-2022
TABLE 25 LAMEA PHARMACEUTICAL INDUSTRY MARKET, ($MILLION), GROWTH (%) 2014-2022
TABLE 26 WORLD FOOD INDUSTRY MARKET, ($MILLION), GROWTH (%)2014-2022
TABLE 27 NORTH AMERICA FOOD INDUSTRY MARKET, ($MILLION), GROWTH (%) 2014-2022
TABLE 28 EUROPE FOOD INDUSTRY MARKET, ($MILLION), GROWTH (%) 2014-2022
TABLE 29 ASIA PACIFIC FOOD INDUSTRY MARKET, ($MILLION), GROWTH (%) 2014-2022
TABLE 30 LAMEA FOOD INDUSTRY MARKET, ($MILLION), GROWTH (%) 2014-2022
TABLE 31 WORLD CHEMICAL INDUSTRY MARKET, ($MILLION), GROWTH (%)2014-2022
TABLE 32 NORTH AMERICA CHEMICAL INDUSTRY MARKET, ($MILLION), GROWTH (%) 2014-2022
TABLE 33 EUROPE CHEMICAL INDUSTRY MARKET, ($MILLION), GROWTH (%) 2014-2022
TABLE 34 ASIA PACIFIC CHEMICAL INDUSTRY MARKET, ($MILLION), GROWTH (%) 2014-2022
TABLE 35 LAMEA CHEMICAL INDUSTRY MARKET, ($MILLION), GROWTH (%) 2014-2022
TABLE 36 NORTH AMERICA IVTT MARKET, ($MILLION), GROWTH (%)2014-2022
TABLE 37 EUROPE IVTT MARKET, ($MILLION), GROWTH (%)2014-2022
TABLE 38 ASIA-PACIFIC IVTT MARKET, ($MILLION), GROWTH (%)2014-2022
TABLE 39 LAMEA IVTT MARKET, ($MILLION), GROWTH (%)2014-2022
TABLE 40 AGILENT TECHNOLOGIES, INC..: COMPANY SNAPSHOT
TABLE 41 AGILENT TECHNOLOGIES, INC.: OPERATING SEGMENTS
TABLE 42 BIORELIANCE, INC.: COMPANY SNAPSHOT
TABLE 43 BIORELIANCE, INC. INC.: OPERATING SEGMENTS
TABLE 44 ALERE, INC.: COMPANY SNAPSHOT
TABLE 45 ALERE, INC.: OPERATING SEGMENTS
TABLE 46 CHARLES RIVER LABORATORIES INTERNATIONAL, INC.: COMPANY SNAPSHOT
TABLE 47 CHARLES RIVER LABORATORIES INTERNATIONAL, INC.: OPERATING SEGMENTS
TABLE 48 GENERAL ELECTRIC COMPANY: COMPANY SNAPSHOT
TABLE 49 GENERAL ELECTRIC COMPANY OPERATING SEGMENTS
TABLE 50 COVANCE, INC.: COMPANY SNAPSHOT
TABLE 51 COVANCE, INC: OPERATING SEGMENTS
TABLE 52 CATALENT, INC.: COMPANY SNAPSHOT
TABLE 53 CATALENT, INC.: OPERATING SEGMENTS
TABLE 54 EUROFINS SCIENTIFIC.: COMPANY SNAPSHOT
TABLE 55 EUROFINS SCIENTIFIC.: OPERATING SEGMENTS
TABLE 56 BIO-RAD LABORATORIES, INC.: COMPANY SNAPSHOT
TABLE 57 BIO-RAD LABORATORIES, INC.: OPERATING SEGMENTS
TABLE 58 THERMO FISHER SCIENTIFIC, INC.: COMPANY SNAPSHOT
TABLE 59 THERMO FISHER SCIENTIFIC, INC.: OPERATING SEGMENTS
In vitro toxicity testing is used to identify hazardous chemical substances and helps detect the toxicity at early stages of the development of new products such as drugs, cosmetics, and food additives. The in vitro toxicity testing is mainly used for safety evaluation in drug development and also for ranking the chemicals according to their potency. The absorption, distribution, metabolism, excretion (ADME), dose response, and threshold response of the drug can also be determined by the in vitro toxicity testing.
The increase in rate of global illicit manufacture of drugs and supply of illicit drugs are expected to expand the global in vitro toxicity testing market. Europe is the lucrative market in the illicit drug abuse followed by North America (U.S.). To detect eye irritancy, the in vivo test known as Draize test is replaced by Bovine corneal opacity and permeability (BCOP) test and isolated Chicken eye method (in vitro test) and to detect skin irritancy and corrosivity, the classic Draize skin test (in vivo test) is replaced by EPISKIN and EpiDerm (in vitro test) which are approved by the European Centre for the Validation of Alternative Methods (ECVAM).
Increase in adoption of IVTT in food industry is expected to make food industry the fastest growing segment and is thus identified as one of the lucrative targets for investment. As compared to other segments, this segment possesses larger market size by value. Other emerging applications in the chemical industry are expected to witness good growth in the coming years. This is due to the introduction of advanced technologies and investment in new technologies in IVTT for detecting toxicity at the early stages of development.
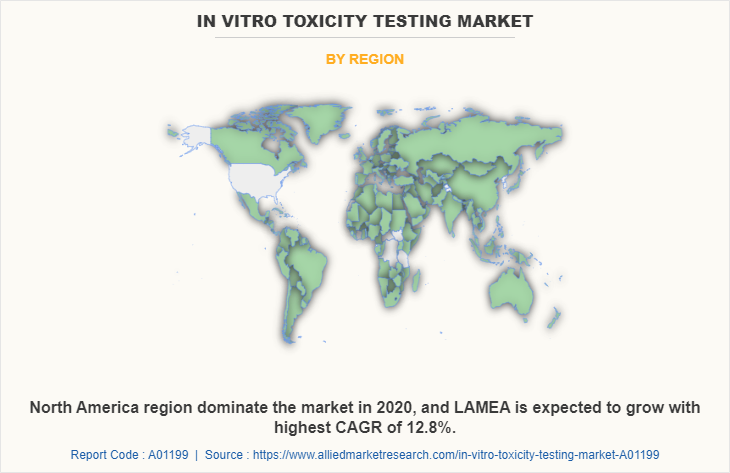
Europe is the largest contributor in the in vitro toxicity testing market due to the improvement in technologies and increased R&D to detect toxicity followed by North America and then Asia-Pacific. India and China are expected to be the fast growing regions in the global in vitro toxicity testing market. Further advancements such as the limited production and sale of the animal tested cosmetics and promotion of the anti-animal testing laws are anticipated to expand the market growth of the global in vitro toxicity testing market.
Key players in the in vitro toxicity testing include Agilent technologies Alere (Covance Inc. Bio Rad Laboratories General Electric Company Eurofins Scientific, Sigma-Aldrich Co. Charles River Laboratories International, ThermoFisher Scientific Inc., and Catalent.
Access from any device, anywhere
Clients can easily download both quantitative as well as
qualitative reports in PDF and excel formats.
Download Sample
Purchase Full Report of
In Vitro Toxicity Testing Market- Global Opportunity Analysis and Industry Forecast, 2014-2022
- Online Only
- $3,565
- Online cloud access only
- Restricted print, copy, paste & download
- Read only
- Free quarterly industry update
- Free report update (Within 180 days)
- Subscription model sign in
- Data Pack
- $3,961
- Restricted to one authorized user
- One print only
- Available in
Excel - Free quarterly industry update
- Free report update (Within 180 days)
- Subscription model sign in
- Single User
- $5,939
- Restricted to one authorized user
- One print only
- Available in Excel & PDF
- Free quarterly industry update
- Free report update (Within 180 days)
- Subscription model sign in
- Five Users
- $6,654
- Limited to five authorized users
- Print upto five copies
- Available in Excel & PDF
- Free quarterly industry update
- Free report update (Within 180 days)
- Subscription model sign in
-
Enterprise
License/PDF - $9,280
- Unlimited
within
company/enterprise - Available in Excel & PDF
- Free quarterly industry update
- Free report update (Within 180 days)
- Subscription model sign in
- Library Membership
- $ 699/mo
- Published Content
E-access - Company Profiles
E-access - Newly Added Content Access
- 10 PDF
Downloads - 5 Excel Data
Pack Downloads - 250 Company Profiles PDF Downloads
-
Start reading instantly.
Buy Now
This title and over 12,000+ are available on the Avenue Library. T&C*.
*Taxes/Fees, if applicable will be added during checkout. All prices in USD
Why Allied Market Research?
Infallible Methodology
To ensure high-level data integrity, accurate analysis, and impeccable forecasts
Analyst Support
For complete satisfaction
Customization
On-demand customization of scope of the report to exactly meet your needs
TARGETED MARKET VIEW
Targeted market view to provide pertinent information and save time of readers
Featured Reports
Get fresh content delivered
Get insights on topics that are crucial for your business. Stay abreast of your interest areas.
Why Allied Market Research?
Infallible Methodology
To ensure high-level data integrity, accurate analysis, and impeccable forecasts
Analyst Support
For complete satisfaction
Customization
On-demand customization of scope of the report to exactly meet your needs
TARGETED MARKET VIEW
Targeted market view to provide pertinent information and save time of readers