A15678 | Pages: 187 | Feb 2022 | 544 Views | | |
Author(s) : Pradeep Ravi, Aarti Goswami , Vineet Kumar | Tables: 99 | Charts: 68 |
|
Pandemic disrupted the entire world and affected many industries.
Get detailed COVID-19 impact analysis on the India Access Control Market
Request Now !
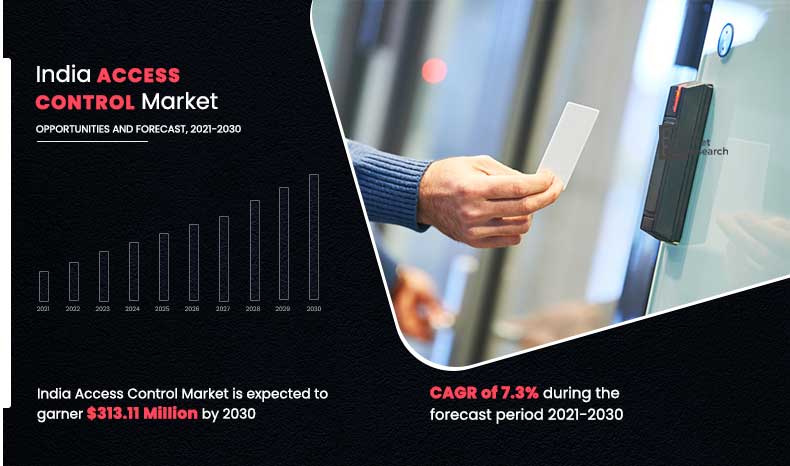
The India access control market size was valued at $160.20 million in 2021, and is projected to reach $313.11 million by 2030, growing at a CAGR of 7.3% from 2021 to 2030.
The COVID-19 pandemic has proven to be a trigger for expansion of access control systems as increasing worries about cyberattacks and phishing assaults were pushing business adoption of multifactor authentication systems. In addition, rising cases of money laundering and theft on online platforms in India during the pandemic has led to growth of the access control systems market.
Access control systems in the form of keyless entry and card access systems is an easy way to manage building security. An access control system provides proper access to each employee in their workplace facility, enabling them to easily enter the right building or office, without concern of a security breach. Depending on the industry or facility, there may be certain offices, laboratories, or production areas that require additional security, either because they are high-risk and require specific safety training, or because they contain sensitive information. An access control system allows users to require specific mandatory credentials from anyone attempting to enter that area. This ensures a safety and security requirements of a facility are met without the hassle of traditional security systems.
Get more information on this report : Request Sample Pages
One of the key benefits of access control systems is that in the event of an accident or theft, organizations can see exactly who accessed a specific area during the time of the incident. Beyond just security measures, this feature is also helpful for collecting data on who enters and exits specific buildings or offices, when, and how often. This is considered as an important factor that propels the access control market in India. In addition, ease of accessibility, owing to access control systems and increasing threat of terrorism & criminal activities are some of the major factors that propel the India access control market growth.
However, lack of knowledge about benefits of advanced security solutions and higher prices for installment of access control systems at workplaces are some of the factors that limit the India access control market growth. Furthermore, increase in usage of advanced technologies such as artificial intelligence, machine learning, biometrics, and RFID technology is expected to grow tremendously in the coming years for the India access control industry.
The report focuses on growth prospects, restraints, and trends of the India access control market analysis. The study provides Porter’s five forces analysis to understand the impact of various factors, such as bargaining power of suppliers, competitive intensity of competitors, threat of new entrants, threat of substitutes, and bargaining power of buyers, on the India access control market.
The India access control market is segmented on the basis of component, type, industry vertical. By component, it is segmented into hardware, software and service. By type, it is bifurcated into card based and biometric based. Based on industry vertical, it is segregated into IT & telecom, BFSI, defense & aerospace, manufacturing, transportation & logistics, government and others.
COVID-19 impact analysis
The COVID-19 pandemic has increased the need for access control management among different organizations to perceive better management of staff in the office premises. With the social distancing norms and fear of spread of virus, the need to check individuals entering a premise for their temperature using biometrics and veins recognition technology helps to identify people who could possibly be infected with diseases and virus. Furthermore, since workplaces, are prime locations for viruses such as COVID-19 to spread, there is a major shift in coronavirus office policies. Therefore, the demand for access control has tremendously increased during the COVID-19 pandemic.
The increasing adoption of access control devices by companies and houseowners for enhanced security is benefiting the expansion of the market. The advancement in features in the access control systems such as biometrics, blockchain authentication and other is attracting the customers to adopt access control systems. In addition, biometrics for security is seen as a serious investment in developing technology parks and manufacturing enterprises. Because modern security systems require larger expenditures, many end-users are hesitant to replace the current biometric authentication systems, benefiting the growth of access control systems market. Moreover, use of access control devices for attendance, monitoring or tracking working times and others has increased its popularity in industrial sectors. Furthermore, it also helps in increasing ease of access to employees in any commercial work space by providing key card or input of a PIN in the systems. Thus, the increasing popularity of access control devices in commercial spaces to monitor employee activities is fueling the growth of the market.
Get more information on this report : Request Sample Pages
The users are not always aware about the technological features upgraded in the access control systems. In addition, the access control system often gets slow without the technological updates in the interfaces. Additionally, many users are also not aware about advance biometrics features such as iris scanner and other advance features. As a result, the customers using traditional access control systems cannot get a convenient experience through the systems. Moreover, the slow working of the systems owing to no upgrades in the system makes the systems vulnerable for cyberattacks. Thus, the less awareness among users about benefits of advanced security solutions is restraining the growth of the market.
Multiple firms are creating advanced technologies to fulfil the demand for more complex and secure access technology, which is a vital aspect of physical security systems. The integration of artificial intelligence (AI) and machine learning (ML) in the systems is enabling the technological advancements in the systems. In addition, the companies are rapidly adopting mobile access control owing to convenience of functioning through mobile. Moreover, cloud-based access control technologies have reduced the costs for the systems which has enabled small scale enterprises to adopt it. Furthermore, advanced features such as multi-factor authentication, multimodal authentication, blockchain authentication, biometric access control and other features are increasingly attracting the customers to adopt the access control systems. Hence, the access control market is rapidly growing with the technological advancements and enhancing the security. Thus, these factors are anticipated to provide lucrative opportunities for the market to grow in upcoming years.
Get more information on this report : Request Sample Pages
Key benefits for stakeholders
Key Market Segments
Key Market Players
CHAPTER 1: INTRODUCTION
1.1.Report Description
1.2.Key Market Segments
1.3.Key Benefits
1.4.Research Methodology
1.4.1.Primary Research
1.4.2.Secondary Research
1.4.3.Analyst Tools and Models
CHAPTER 2: EXECUTIVE SUMMARY
2.1.CXO Perspective
CHAPTER 3: MARKET LANDSCAPE
3.1.Market Definition and Scope
3.2.Key Findings
3.2.1.Top Investment Pockets
3.2.2.Top Winning Strategies
3.3.Porter's Five Forces Analysis
3.3.1.Bargaining Power of Suppliers
3.3.2.Threat of New Entrants
3.3.3.Threat of Substitutes
3.3.4.Competitive Rivalry
3.3.5.Bargaining Power among Buyers
3.4.Market Share Analysis/Top Player Positioning
3.4.1.Market Share Analysis/Top Player Positioning 2020
3.5.Market Dynamics
3.5.1.Drivers
3.5.2.Restraints
3.5.3.Opportunities
3.6.COVID-19 Impact Analysis
3.8.Key Regulation Analysis
3.9.Market Share Analysis
3.10.Competitive Heatmap
3.11.Regulatory Guidelines
CHAPTER 4: INDIA ACCESS CONTROL MARKET, BY COMPONENT
4.1.Market Overview
4.1.1.Market Size and Forecast, By Component
4.2.Hardware
4.2.1.Key Market Trends, Growth Factors and Opportunities
4.2.2.Market Size and Forecast, By Country
4.3.Software
4.3.1.Key Market Trends, Growth Factors and Opportunities
4.3.2.Market Size and Forecast, By Country
4.4.Service
4.4.1.Key Market Trends, Growth Factors and Opportunities
4.4.2.Market Size and Forecast, By Country
CHAPTER 5: INDIA ACCESS CONTROL MARKET, BY TYPE
5.1.Market Overview
5.1.1.Market Size and Forecast, By Type
5.2.Card Based
5.2.1.Key Market Trends, Growth Factors and Opportunities
5.2.2.Market Size and Forecast, By Country
5.3.Biometric Based
5.3.1.Key Market Trends, Growth Factors and Opportunities
5.3.2.Market Size and Forecast, By Country
5.3.3.Facial Recognition
5.3.3.1.Market Size and Forecast
5.3.3.Iris Recognition
5.3.3.1.Market Size and Forecast
5.3.3.Palm Vein Recognition
5.3.3.1.Market Size and Forecast
5.3.3.Others
5.3.3.1.Market Size and Forecast
CHAPTER 6: INDIA ACCESS CONTROL MARKET, BY INDUSTRY VERTICALS
6.1.Market Overview
6.1.1.Market Size and Forecast, By Industry Verticals
6.2.IT & Telecom
6.2.1.Key Market Trends, Growth Factors and Opportunities
6.2.2.Market Size and Forecast, By Country
6.3.BFSI
6.3.1.Key Market Trends, Growth Factors and Opportunities
6.3.2.Market Size and Forecast, By Country
6.4.Defence & Aerospace
6.4.1.Key Market Trends, Growth Factors and Opportunities
6.4.2.Market Size and Forecast, By Country
6.5.Manufacturing
6.5.1.Key Market Trends, Growth Factors and Opportunities
6.5.2.Market Size and Forecast, By Country
6.6.Healthcare
6.6.1.Key Market Trends, Growth Factors and Opportunities
6.6.2.Market Size and Forecast, By Country
6.7.Transportation & Logistics
6.7.1.Key Market Trends, Growth Factors and Opportunities
6.7.2.Market Size and Forecast, By Country
6.8.Government
6.8.1.Key Market Trends, Growth Factors and Opportunities
6.8.2.Market Size and Forecast, By Country
6.9.Others
6.9.1.Key Market Trends, Growth Factors and Opportunities
6.9.2.Market Size and Forecast, By Country
CHAPTER 7: COMPANY PROFILES
7.1.Honeywell International Inc.
7.1.1.Company Overview
7.1.2.Key Executives
7.1.3.Company snapshot
7.1.4.Operating business segments
7.1.5.Product portfolio
7.1.6.Business Performance
7.1.7.Key Strategic Moves and Developments
7.2.Robert Bosch GmbH
7.2.1.Company Overview
7.2.2.Key Executives
7.2.3.Company snapshot
7.2.4.Operating business segments
7.2.5.Product portfolio
7.2.6.Business Performance
7.2.7.Key Strategic Moves and Developments
7.3.Johnson Controls
7.3.1.Company Overview
7.3.2.Key Executives
7.3.3.Company snapshot
7.3.4.Operating business segments
7.3.5.Product portfolio
7.3.6.Business Performance
7.3.7.Key Strategic Moves and Developments
7.4.Tyco Security Products
7.4.1.Company Overview
7.4.2.Key Executives
7.4.3.Company snapshot
7.4.4.Operating business segments
7.4.5.Product portfolio
7.4.6.Business Performance
7.4.7.Key Strategic Moves and Developments
7.5.Paxton Access Ltd.
7.5.1.Company Overview
7.5.2.Key Executives
7.5.3.Company snapshot
7.5.4.Operating business segments
7.5.5.Product portfolio
7.5.6.Business Performance
7.5.7.Key Strategic Moves and Developments
7.6.HID Global Corporation
7.6.1.Company Overview
7.6.2.Key Executives
7.6.3.Company snapshot
7.6.4.Operating business segments
7.6.5.Product portfolio
7.6.6.Business Performance
7.6.7.Key Strategic Moves and Developments
7.7.IDCUBE
7.7.1.Company Overview
7.7.2.Key Executives
7.7.3.Company snapshot
7.7.4.Operating business segments
7.7.5.Product portfolio
7.7.6.Business Performance
7.7.7.Key Strategic Moves and Developments
7.8.Siemens
7.8.1.Company Overview
7.8.2.Key Executives
7.8.3.Company snapshot
7.8.4.Operating business segments
7.8.5.Product portfolio
7.8.6.Business Performance
7.8.7.Key Strategic Moves and Developments
7.9.Gallagher Security
7.9.1.Company Overview
7.9.2.Key Executives
7.9.3.Company snapshot
7.9.4.Operating business segments
7.9.5.Product portfolio
7.9.6.Business Performance
7.9.7.Key Strategic Moves and Developments
7.10.RBH Access Technologies
7.10.1.Company Overview
7.10.2.Key Executives
7.10.3.Company snapshot
7.10.4.Operating business segments
7.10.5.Product portfolio
7.10.6.Business Performance
7.10.7.Key Strategic Moves and Developments
7.11.ASSA ABLOY
7.11.1.Company Overview
7.11.2.Key Executives
7.11.3.Company snapshot
7.11.4.Operating business segments
7.11.5.Product portfolio
7.11.6.Business Performance
7.11.7.Key Strategic Moves and Developments
7.12.Mercury Security
7.12.1.Company Overview
7.12.2.Key Executives
7.12.3.Company snapshot
7.12.4.Operating business segments
7.12.5.Product portfolio
7.12.6.Business Performance
7.12.7.Key Strategic Moves and Developments
7.13.SOLUS
7.13.1.Company Overview
7.13.2.Key Executives
7.13.3.Company snapshot
7.13.4.Operating business segments
7.13.5.Product portfolio
7.13.6.Business Performance
7.13.7.Key Strategic Moves and Developments
7.14.Suprema
7.14.1.Company Overview
7.14.2.Key Executives
7.14.3.Company snapshot
7.14.4.Operating business segments
7.14.5.Product portfolio
7.14.6.Business Performance
7.14.7.Key Strategic Moves and Developments
7.15.Hangzhou Hikvision Digital Technology Co., Ltd.
7.15.1.Company Overview
7.15.2.Key Executives
7.15.3.Company snapshot
7.15.4.Operating business segments
7.15.5.Product portfolio
7.15.6.Business Performance
7.15.7.Key Strategic Moves and Developments
7.16. IDEMIA
7.16.1.Company Overview
7.16.2.Key Executives
7.16.3.Company snapshot
7.16.4.Operating business segments
7.16.5.Product portfolio
7.16.6.Business Performance
7.16.7.Key Strategic Moves and Developments
7.17.Mantra Softech India Private Limited
7.17.1.Company Overview
7.17.2.Key Executives
7.17.3.Company snapshot
7.17.4.Operating business segments
7.17.5.Product portfolio
7.17.6.Business Performance
7.17.7.Key Strategic Moves and Developments
7.18.Dahua Technology Co., Ltd
7.18.1.Company Overview
7.18.2.Key Executives
7.18.3.Company snapshot
7.18.4.Operating business segments
7.18.5.Product portfolio
7.18.6.Business Performance
7.18.7.Key Strategic Moves and Developments
7.19.ZkTeco Co., Ltd
7.19.1.Company Overview
7.19.2.Key Executives
7.19.3.Company snapshot
7.19.4.Operating business segments
7.19.5.Product portfolio
7.19.6.Business Performance
7.19.7.Key Strategic Moves and Developments
7.20.Realtime Biometric
7.20.1.Company Overview
7.20.2.Key Executives
7.20.3.Company snapshot
7.20.4.Operating business segments
7.20.5.Product portfolio
7.20.6.Business Performance
7.20.7.Key Strategic Moves and Developments
7.21.eSSL
7.21.1.Company Overview
7.21.2.Key Executives
7.21.3.Company snapshot
7.21.4.Operating business segments
7.21.5.Product portfolio
7.21.6.Business Performance
7.21.7.Key Strategic Moves and Developments
7.22.Gemalto (3M Cogent)
7.22.1.Company Overview
7.22.2.Key Executives
7.22.3.Company snapshot
7.22.4.Operating business segments
7.22.5.Product portfolio
7.22.6.Business Performance
7.22.7.Key Strategic Moves and Developments
7.23.Godrej
7.23.1.Company Overview
7.23.2.Key Executives
7.23.3.Company snapshot
7.23.4.Operating business segments
7.23.5.Product portfolio
7.23.6.Business Performance
7.23.7.Key Strategic Moves and Developments
7.24.Virdi
7.24.1.Company Overview
7.24.2.Key Executives
7.24.3.Company snapshot
7.24.4.Operating business segments
7.24.5.Product portfolio
7.24.6.Business Performance
7.24.7.Key Strategic Moves and Developments
LIST OF TABLES
TABLE 1. INDIA ACCESS CONTROL MARKET, BY COMPONENT, 2020-2030 ($MILLION)
TABLE 2. INDIA ACCESS CONTROL MARKET, BY TYPE, 2020-2030 ($MILLION)
TABLE 3. INDIA ACCESS CONTROL MARKET, BY INDUSTRY VERTICALS, 2020-2030 ($MILLION)
TABLE 4.HONEYWELL INTERNATIONAL INC.: COMPANY SNAPSHOT
TABLE 5.HONEYWELL INTERNATIONAL INC.: OPERATING SEGMENTS
TABLE 6.HONEYWELL INTERNATIONAL INC.: PRODUCT PORTFOLIO
TABLE 7.HONEYWELL INTERNATIONAL INC.: KEY STRATEGIC MOVES AND DEVELOPMENTS
TABLE 8.ROBERT BOSCH GMBH: COMPANY SNAPSHOT
TABLE 9.ROBERT BOSCH GMBH: OPERATING SEGMENTS
TABLE 10.ROBERT BOSCH GMBH: PRODUCT PORTFOLIO
TABLE 11.ROBERT BOSCH GMBH: KEY STRATEGIC MOVES AND DEVELOPMENTS
TABLE 12.JOHNSON CONTROLS: COMPANY SNAPSHOT
TABLE 13.JOHNSON CONTROLS: OPERATING SEGMENTS
TABLE 14.JOHNSON CONTROLS: PRODUCT PORTFOLIO
TABLE 15.JOHNSON CONTROLS: KEY STRATEGIC MOVES AND DEVELOPMENTS
TABLE 16.TYCO SECURITY PRODUCTS: COMPANY SNAPSHOT
TABLE 17.TYCO SECURITY PRODUCTS: OPERATING SEGMENTS
TABLE 18.TYCO SECURITY PRODUCTS: PRODUCT PORTFOLIO
TABLE 19.TYCO SECURITY PRODUCTS: KEY STRATEGIC MOVES AND DEVELOPMENTS
TABLE 20.PAXTON ACCESS LTD.: COMPANY SNAPSHOT
TABLE 21.PAXTON ACCESS LTD.: OPERATING SEGMENTS
TABLE 22.PAXTON ACCESS LTD.: PRODUCT PORTFOLIO
TABLE 23.PAXTON ACCESS LTD.: KEY STRATEGIC MOVES AND DEVELOPMENTS
TABLE 24.HID GLOBAL CORPORATION: COMPANY SNAPSHOT
TABLE 25.HID GLOBAL CORPORATION: OPERATING SEGMENTS
TABLE 26.HID GLOBAL CORPORATION: PRODUCT PORTFOLIO
TABLE 27.HID GLOBAL CORPORATION: KEY STRATEGIC MOVES AND DEVELOPMENTS
TABLE 28.IDCUBE: COMPANY SNAPSHOT
TABLE 29.IDCUBE: OPERATING SEGMENTS
TABLE 30.IDCUBE: PRODUCT PORTFOLIO
TABLE 31.IDCUBE: KEY STRATEGIC MOVES AND DEVELOPMENTS
TABLE 32.SIEMENS: COMPANY SNAPSHOT
TABLE 33.SIEMENS: OPERATING SEGMENTS
TABLE 34.SIEMENS: PRODUCT PORTFOLIO
TABLE 35.SIEMENS: KEY STRATEGIC MOVES AND DEVELOPMENTS
TABLE 36.GALLAGHER SECURITY: COMPANY SNAPSHOT
TABLE 37.GALLAGHER SECURITY: OPERATING SEGMENTS
TABLE 38.GALLAGHER SECURITY: PRODUCT PORTFOLIO
TABLE 39.GALLAGHER SECURITY: KEY STRATEGIC MOVES AND DEVELOPMENTS
TABLE 40.RBH ACCESS TECHNOLOGIES: COMPANY SNAPSHOT
TABLE 41.RBH ACCESS TECHNOLOGIES: OPERATING SEGMENTS
TABLE 42.RBH ACCESS TECHNOLOGIES: PRODUCT PORTFOLIO
TABLE 43.RBH ACCESS TECHNOLOGIES: KEY STRATEGIC MOVES AND DEVELOPMENTS
TABLE 44.ASSA ABLOY: COMPANY SNAPSHOT
TABLE 45.ASSA ABLOY: OPERATING SEGMENTS
TABLE 46.ASSA ABLOY: PRODUCT PORTFOLIO
TABLE 47.ASSA ABLOY: KEY STRATEGIC MOVES AND DEVELOPMENTS
TABLE 48.MERCURY SECURITY: COMPANY SNAPSHOT
TABLE 49.MERCURY SECURITY: OPERATING SEGMENTS
TABLE 50.MERCURY SECURITY: PRODUCT PORTFOLIO
TABLE 51.MERCURY SECURITY: KEY STRATEGIC MOVES AND DEVELOPMENTS
TABLE 52.SOLUS: COMPANY SNAPSHOT
TABLE 53.SOLUS: OPERATING SEGMENTS
TABLE 54.SOLUS: PRODUCT PORTFOLIO
TABLE 55.SOLUS: KEY STRATEGIC MOVES AND DEVELOPMENTS
TABLE 56.SUPREMA: COMPANY SNAPSHOT
TABLE 57.SUPREMA: OPERATING SEGMENTS
TABLE 58.SUPREMA: PRODUCT PORTFOLIO
TABLE 59.SUPREMA: KEY STRATEGIC MOVES AND DEVELOPMENTS
TABLE 60.HANGZHOU HIKVISION DIGITAL TECHNOLOGY CO., LTD.: COMPANY SNAPSHOT
TABLE 61.HANGZHOU HIKVISION DIGITAL TECHNOLOGY CO., LTD.: OPERATING SEGMENTS
TABLE 62.HANGZHOU HIKVISION DIGITAL TECHNOLOGY CO., LTD.: PRODUCT PORTFOLIO
TABLE 63.HANGZHOU HIKVISION DIGITAL TECHNOLOGY CO., LTD.: KEY STRATEGIC MOVES AND DEVELOPMENTS
TABLE 64.IDEMIA: COMPANY SNAPSHOT
TABLE 65.IDEMIA: OPERATING SEGMENTS
TABLE 66.IDEMIA: PRODUCT PORTFOLIO
TABLE 67.IDEMIA: KEY STRATEGIC MOVES AND DEVELOPMENTS
TABLE 68.IDEMIA: COMPANY SNAPSHOT
TABLE 69.MANTRA SOFTECH INDIA PRIVATE LIMITED: OPERATING SEGMENTS
TABLE 70.MANTRA SOFTECH INDIA PRIVATE LIMITED: PRODUCT PORTFOLIO
TABLE 71.MANTRA SOFTECH INDIA PRIVATE LIMITED: KEY STRATEGIC MOVES AND DEVELOPMENTS
TABLE 72.DAHUA TECHNOLOGY CO., LTD: COMPANY SNAPSHOT
TABLE 73.DAHUA TECHNOLOGY CO., LTD: OPERATING SEGMENTS
TABLE 74.DAHUA TECHNOLOGY CO., LTD: PRODUCT PORTFOLIO
TABLE 75.DAHUA TECHNOLOGY CO., LTD: KEY STRATEGIC MOVES AND DEVELOPMENTS
TABLE 76.ZKTECO CO., LTD: COMPANY SNAPSHOT
TABLE 77.ZKTECO CO., LTD: OPERATING SEGMENTS
TABLE 78.ZKTECO CO., LTD: PRODUCT PORTFOLIO
TABLE 79.ZKTECO CO., LTD: KEY STRATEGIC MOVES AND DEVELOPMENTS
TABLE 80.REALTIME BIOMETRIC: COMPANY SNAPSHOT
TABLE 81.REALTIME BIOMETRIC: OPERATING SEGMENTS
TABLE 82.REALTIME BIOMETRIC: PRODUCT PORTFOLIO
TABLE 83.REALTIME BIOMETRIC: KEY STRATEGIC MOVES AND DEVELOPMENTS
TABLE 84.eSSL: COMPANY SNAPSHOT
TABLE 85.eSSL: OPERATING SEGMENTS
TABLE 86.eSSL: PRODUCT PORTFOLIO
TABLE 87.eSSL: KEY STRATEGIC MOVES AND DEVELOPMENTS
TABLE 88.GEMALTO (3M COGENT): COMPANY SNAPSHOT
TABLE 89.GEMALTO (3M COGENT): OPERATING SEGMENTS
TABLE 90.GEMALTO (3M COGENT): PRODUCT PORTFOLIO
TABLE 91.GEMALTO (3M COGENT): KEY STRATEGIC MOVES AND DEVELOPMENTS
TABLE 92.GODREJ: COMPANY SNAPSHOT
TABLE 93.GODREJ: OPERATING SEGMENTS
TABLE 94.GODREJ: PRODUCT PORTFOLIO
TABLE 95.GODREJ: KEY STRATEGIC MOVES AND DEVELOPMENTS
TABLE 96.VIRDI: COMPANY SNAPSHOT
TABLE 97.VIRDI: OPERATING SEGMENTS
TABLE 98.VIRDI: PRODUCT PORTFOLIO
TABLE 99.VIRDI: KEY STRATEGIC MOVES AND DEVELOPMENTS
LIST OF FIGURES
FIGURE 1.INDIA ACCESS CONTROL MARKET
FIGURE 2.SEGMENTATION OF INDIA ACCESS CONTROL MARKET
FIGURE 3.TOP INVESTMENT POCKET IN INDIA ACCESS CONTROL MARKET
FIGURE 4.TOP WINNING STRATEGIES, BY YEAR, 2019-2021*
FIGURE 5.TOP WINNING STRATEGIES, BY DEVELOPMENT, 2019-2021*
FIGURE 6.TOP WINNING STRATEGIES, BY COMPANY, 2019-2021*
FIGURE 7.MODERATE BARGAINING POWER OF BUYERS
FIGURE 8.MODERATE BARGAINING POWER OF SUPPLIERS
FIGURE 9.MODERATE THREAT OF NEW ENTRANTS
FIGURE 10.LOW THREAT OF SUBSTITUTION
FIGURE 11.HIGH COMPETITIVE RIVALRY
FIGURE 12.RESTRAINTS AND DRIVERS: INDIA ACCESS CONTROL MARKET
FIGURE 13.INDIA ACCESS CONTROL MARKET SEGMENTATION, BY COMPONENT
FIGURE 14.INDIA ACCESS CONTROL MARKET FOR HARDWARE, BY COUNTRY, 2020-2030 ($MILLION)
FIGURE 15.INDIA ACCESS CONTROL MARKET FOR SOFTWARE, BY COUNTRY, 2020-2030 ($MILLION)
FIGURE 16.INDIA ACCESS CONTROL MARKET FOR SERVICE, BY COUNTRY, 2020-2030 ($MILLION)
FIGURE 17.INDIA ACCESS CONTROL MARKET SEGMENTATION, BY TYPE
FIGURE 18.INDIA ACCESS CONTROL MARKET FOR CARD BASED, BY COUNTRY, 2020-2030 ($MILLION)
FIGURE 19.INDIA ACCESS CONTROL MARKET FOR BIOMETRIC BASED, BY COUNTRY, 2020-2030 ($MILLION)
FIGURE 20.INDIA ACCESS CONTROL MARKET SEGMENTATION, BY INDUSTRY VERTICALS
FIGURE 21.INDIA ACCESS CONTROL MARKET FOR IT & TELECOM, BY COUNTRY, 2020-2030 ($MILLION)
FIGURE 22.INDIA ACCESS CONTROL MARKET FOR BFSI, BY COUNTRY, 2020-2030 ($MILLION)
FIGURE 23.INDIA ACCESS CONTROL MARKET FOR DEFENCE & AEROSPACE, BY COUNTRY, 2020-2030 ($MILLION)
FIGURE 24.INDIA ACCESS CONTROL MARKET FOR MANUFACTURING, BY COUNTRY, 2020-2030 ($MILLION)
FIGURE 25.INDIA ACCESS CONTROL MARKET FOR HEALTHCARE, BY COUNTRY, 2020-2030 ($MILLION)
FIGURE 26.INDIA ACCESS CONTROL MARKET FOR TRANSPORTATION & LOGISTICS, BY COUNTRY, 2020-2030 ($MILLION)
FIGURE 27.INDIA ACCESS CONTROL MARKET FOR GOVERNMENT, BY COUNTRY, 2020-2030 ($MILLION)
FIGURE 28.INDIA ACCESS CONTROL MARKET FOR OTHERS, BY COUNTRY, 2020-2030 ($MILLION)
FIGURE 29.HONEYWELL INTERNATIONAL INC.: KEY EXECUTIVES
FIGURE 30.HONEYWELL INTERNATIONAL INC.: NET SALES, 2018-2020 ($MILLION)
FIGURE 31.HONEYWELL INTERNATIONAL INC.: REVENUE SHARE, BY SEGMENT, 2020 (%)
FIGURE 32.HONEYWELL INTERNATIONAL INC.: REVENUE SHARE, BY GEOGRAPHY, 2020 (%)
FIGURE 33.ROBERT BOSCH GMBH: KEY EXECUTIVES
FIGURE 34.ROBERT BOSCH GMBH: NET SALES, 2018-2020 ($MILLION)
FIGURE 35.ROBERT BOSCH GMBH: REVENUE SHARE, BY SEGMENT, 2020 (%)
FIGURE 36.ROBERT BOSCH GMBH: REVENUE SHARE, BY GEOGRAPHY, 2020 (%)
FIGURE 37.JOHNSON CONTROLS: KEY EXECUTIVES
FIGURE 38.JOHNSON CONTROLS: NET SALES, 2018-2020 ($MILLION)
FIGURE 39.JOHNSON CONTROLS: REVENUE SHARE, BY SEGMENT, 2020 (%)
FIGURE 40.JOHNSON CONTROLS: REVENUE SHARE, BY GEOGRAPHY, 2020 (%)
FIGURE 41.TYCO SECURITY PRODUCTS: KEY EXECUTIVES
FIGURE 42.TYCO SECURITY PRODUCTS: NET SALES, 2018-2020 ($MILLION)
FIGURE 43.TYCO SECURITY PRODUCTS: REVENUE SHARE, BY SEGMENT, 2020 (%)
FIGURE 44.TYCO SECURITY PRODUCTS: REVENUE SHARE, BY GEOGRAPHY, 2020 (%)
FIGURE 45.PAXTON ACCESS LTD.: KEY EXECUTIVES
FIGURE 46.PAXTON ACCESS LTD.: NET SALES, 2018-2020 ($MILLION)
FIGURE 47.PAXTON ACCESS LTD.: REVENUE SHARE, BY SEGMENT, 2020 (%)
FIGURE 48.PAXTON ACCESS LTD.: REVENUE SHARE, BY GEOGRAPHY, 2020 (%)
FIGURE 49.HID GLOBAL CORPORATION: KEY EXECUTIVES
FIGURE 50.HID GLOBAL CORPORATION: NET SALES, 2018-2020 ($MILLION)
FIGURE 51.HID GLOBAL CORPORATION: REVENUE SHARE, BY SEGMENT, 2020 (%)
FIGURE 52.HID GLOBAL CORPORATION: REVENUE SHARE, BY GEOGRAPHY, 2020 (%)
FIGURE 53.IDCUBE: KEY EXECUTIVES
FIGURE 54.IDCUBE: NET SALES, 2018-2020 ($MILLION)
FIGURE 55.IDCUBE: REVENUE SHARE, BY SEGMENT, 2020 (%)
FIGURE 56.IDCUBE: REVENUE SHARE, BY GEOGRAPHY, 2020 (%)
FIGURE 57.SIEMENS: KEY EXECUTIVES
FIGURE 58.SIEMENS: NET SALES, 2018-2020 ($MILLION)
FIGURE 59.SIEMENS: REVENUE SHARE, BY SEGMENT, 2020 (%)
FIGURE 60.SIEMENS: REVENUE SHARE, BY GEOGRAPHY, 2020 (%)
FIGURE 61.GALLAGHER SECURITY: KEY EXECUTIVES
FIGURE 62.GALLAGHER SECURITY: NET SALES, 2018-2020 ($MILLION)
FIGURE 63.GALLAGHER SECURITY: REVENUE SHARE, BY SEGMENT, 2020 (%)
FIGURE 64.GALLAGHER SECURITY: REVENUE SHARE, BY GEOGRAPHY, 2020 (%)
FIGURE 65.RBH ACCESS TECHNOLOGIES: KEY EXECUTIVES
FIGURE 66.RBH ACCESS TECHNOLOGIES: NET SALES, 2018-2020 ($MILLION)
FIGURE 67.RBH ACCESS TECHNOLOGIES: REVENUE SHARE, BY SEGMENT, 2020 (%)
FIGURE 68.RBH ACCESS TECHNOLOGIES: REVENUE SHARE, BY GEOGRAPHY, 2020 (%)
With rapid development in cloud computing and access control, the security and controls market has transformed, in comparison to previous decade in India. Emerging cloud-based technologies provide web- and cloud-based solutions for cost-effectiveness, real-time analytics, easy access to data, integration with other systems & software, sharing of data internally & externally, scalability, and flexibility. Furthermore, initiatives undertaken by companies in India, coupled with awareness about cybercrime and security for data have been gaining ground in recent years. Companies are taking steps to secure enterprise information from various internal and external threats. Increase in awareness about cyber-crimes and data security is expected to drive sales of access control systems in upcoming years.
Furthermore, digitization of workplaces is growing steadily in India, and enterprises are adopting advanced access control technologies including biometrics and access control solutions. Moreover, acceptance and awareness about this technology has increased among industrial users in past few years. Rise in usage of biometric authentication using a range of different identification methods makes access biometrics more accessible in industrial workplace. Moreover, facial recognition technology is also being used by companies to identify their employees as soon as they enter into the organization. In addition, the COVID-19 pandemic has impacted a wide range of industry verticals and social distancing norms are transforming digitalization processes to ensure asset safety. The demand for access control in India has increased during the pandemic owing to increased awareness regarding smart solutions for enhancing security processes. TAdoption of contactless biometrics has increased in the pandemic due to social distancing norms.
Some of the key players profiled in the report include Honeywell International Inc., Robert Bosch GmbH, Johnson Controls, Tyco Security Products, Paxton Access Ltd., HID Global Corporation, IDCUBE, Siemens, Gallagher Security, RBH Access Technologies, ASSA ABLOY, Mercury Security, SOLUS, Suprema, Hikvision, IDEMIA, Mantra Softech India Private Limited, Dahua Technology Co., Ltd, ZkTeco Co., Ltd, Realtime Biometric, eSSL, Gemalto (3M Cogent), Godrej, and Virdi. These players have adopted various strategies to increase their market penetration and strengthen their position in the India access control industry.
Clients can easily download both quantitative as well as
qualitative reports in PDF and excel formats.
Start reading instantly.
This Report and over 13,000+ thousand more Reports, Available with Avenue Library. T&C*.
Enterprise
License/PDF
*Taxes/Fees, if applicable will be added during checkout. All prices in USD
To ensure high-level data integrity, accurate analysis, and impeccable forecasts
For complete satisfaction
On-demand customization of scope of the report to exactly meet your needs
Targeted market view to provide pertinent information and save time of readers
Get insights on topics that are crucial for your business. Stay abreast of your interest areas.
To ensure high-level data integrity, accurate analysis, and impeccable forecasts
For complete satisfaction
On-demand customization of scope of the report to exactly meet your needs
Targeted market view to provide pertinent information and save time of readers