Report Code: A04578 | Jul 2019 | Pages: 180 | ||
Tables: 50 | Charts: 73 |
|
Pandemic disrupted the entire world and affected many industries.
Get detailed COVID-19 impact analysis on the India Home Automation Market
Request Now !The India home automation market size was valued at $1,790.9 million in 2018, and is expected to reach at $13,574.1 million by 2026, growing at a CAGR of 29.8% during the forecast period 2019-2026.
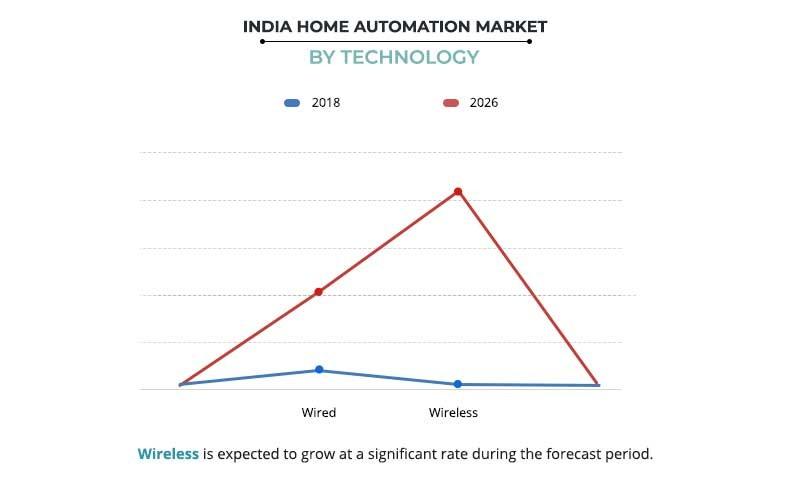
Smart home refers to homes with appliances such as electronic devices is controlled or operated by user via smartphone or a mobile app. Smart devices include appliances such as lighting devices, air conditioning units, ovens, refrigerators, audio & video entertainment systems, and cooling & heating units. The user monitors and controls the functions of smart home devices with home automation technology. There are two types of home automation technology—wireless system and wiring system. The wireless system includes Z-wave, Wi-Fi, Infrared (IR), Bluetooth, and others. The wired systems include cabling for the integration of sensors and smart home systems in the home with internet cables and connectors.
The advantages of home automation are safety and security, convenience, low utility costs, and time saving. The main focus to implement home automation in India is security, and energy efficiency. The home automation technology allows to control the heating and cooling systems in home, which can save considerable energy. Moreover, lights can be automatically switched on or off during sunrise or sunset as well as while leaving or entering the respective room.
The cost effectiveness is one of the driving factors for the India home automation market. Multiple cities, especially Pune, and Mumbai, witness considerable growth in adoption of smart home system every year that are backed by various competitors, which offers home automation at a low cost, thus increasing the India home automation market scope. Surge in economical video surveillance for security solutions that are integrated with real-time analytics are anticipated to boost the growth of the India home automation market. Moreover, the development of smart kitchen appliances such as smart coffeemaker, intelligent oven, precision cooker, and smart grill, has enhanced IoT for smart homes, which continues to provide profitable business opportunities to the players in India home automation market.
However, the market penetration of home automation systems in India is less as compared to other developing nations, owing to the limited connectivity and lower average bandwidth. Furthermore, the lack of standardization of products and components in smart home can lead to failure of the system. Such factors hamper the India home automation market growth.
There has been a rise in smart home startups such as Oakter, Inoho, IFIHomes, and Home Brain in India owing to the government of India programs such as ‘Make in India’, and ‘Digital India’. Many players are developing advanced technologies and devices for the smart home industry in India. For instance, Schneider Electric launched the Easergy P3 in the Indian market in May 2018. It is a medium-voltage protection relay, which combines real-time analytics with advanced technologies and solutions powered by Internet Of Things. Similarly, Apple Inc. developed HomeKit that allows iPhone users to control individual smart home devices such as garage door openers, lights, and security cameras. These factors offer lucrative growth opportunities for the India home automation market.
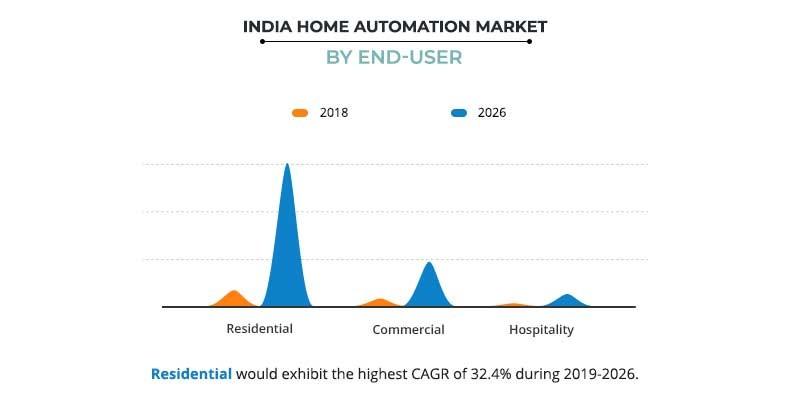
The India home automation market is segmented on the basis of product, technology, and end user. By product, the India home automation market is segregated into lighting, security & safety, HVAC, entertainment, and others. The lighting segment is further divided into relays, dimmers, switches, and others. Security & safety is sub-segmented into bells, locks, security cameras, and others. In 2018, the India home automation share is highest among the Security & safety segment, owing to the growth in urbanization. The HVAC segment is further classified into thermostats, sensors, control valves, and others. Entertainment is subdivided into home theater system, audio, volume & multimedia controls, and others. The others segment includes wall panels, ceiling plates, fans, and wires. Depending on technology, the market is bifurcated into wired and wireless. By end user, it is fragmented into residential, commercial, and hospitality.
COMPETITION ANALYSIS
The key players operating in the market include Fueblabs, Larsen & Toubro, Schneider, Johnson Controls, Harman International, Home Brain, PERT, Silvan Innovation, Oakter, and Elan Home Systems. Many players in the India home automation market adopted product launch, product development, collaboration, and business expansion as their key developmental strategies to sustain the intense competition and improve their product portfolio.
For instance, Harman Professional Solutions collaborated with Zoom Video Communications, Inc. in February 2019 to improve their products for the controller applications for commercial spaces. Through this collaboration companies have developed AMX Acendo Core Collaboration System and the Zoom Meetings service with Zoom Rooms Controller app. Similarly, Johnson Controls launched Metasys 10.0, in December 2018. It is designed to deliver more unified building management. It provides the facility personnel with smarter building automation, faster responses to critical alarms, and new integrations in fire detection, security, and lighting systems with a single common interface. Furthermore, Nortek Security and Control, LLC expanded its Nortek Security & Control New Home Program in February 2019, which includes a complete line-up of solutions. It also includes smart home control, automation, security, access control, and entertainment solutions that cover every aspect of the home.
India Home Automation Market Report Highlights
Aspects | Details |
---|---|
By TYPE |
|
By TECHNOLOGY |
|
By END USER |
|
Key Market Players | JOHNSON CONTROLS INTERNATIONAL PLC, HARMAN INTERNATIONAL INDUSTRIES INCORPORATED, FUEB LABS, PERT INFOCONSULTING PVT. LTD., LARSEN & TOUBRO LIMITED, HOME BRAIN, NORTEK SECURITY & CONTROL LLC (“NSC”), SILVAN INNOVATION LABS PVT. LTD., SCHNEIDER ELECTRIC SE, OAKTER HOME AUTOMATION |
CHAPTER 1: INTRODUCTION
1.1. Report description
1.2. Key benefits for stakeholders
1.3. Key market segments
1.4. Key market players
1.5. Research methodology
1.5.1. Secondary research
1.5.2. Primary research
1.5.3. Analyst tools & models
CHAPTER 2: EXECUTIVE SUMMARY
2.1. CXO perspective
CHAPTER 3: MARKET OVERVIEW
3.1. Market definition and scope
3.2. Key findings
3.2.1. Top investment pockets
3.2.2. Top winning strategies
3.3. Demographics of the presence of smart home
3.4. Porter's five forces analysis
3.5. Market dynamics
3.5.1. Drivers
3.5.1.1. Cost-effectiveness of home automation systems
3.5.1.2. Surge in popularity of Internet of Things (IoT) for smart homes
3.5.1.3. Rise in demand for energy-efficient solutions
3.5.1.4. Rise in need for safety & security for homes
3.5.2. Restraints
3.5.2.1. Limited connectivity and bandwidth issue
3.5.2.2. Lack of standardization and long replacement cycles
3.5.3. Opportunities
3.5.3.1. Technical innovations
3.5.3.2. Urban renewal and planning programs by the Government of India
3.6. List and overview of distributors and electrical commissioning agents
CHAPTER 4: INDIA HOME AUTOMATION MARKET, BY TYPE
4.1. Market overview
4.1.1. Market size and forecast, by type
4.2. Lighting
4.2.1. Key market trends, growth factors, and opportunities
4.2.2. Market size and forecast
4.2.2.1. Relay
4.2.2.1.1. Market size and forecast
4.2.2.2. Dimmers
4.2.2.2.1. Market size and forecast
4.2.2.3. Switches
4.2.2.3.1. Market size and forecast
4.2.2.4. Others
4.2.2.4.1. Market size and forecast
4.3. Security & safety
4.3.1. Key market trends, growth factors, and opportunities
4.3.2. Market size and forecast
4.3.2.1. Bells
4.3.2.1.1. Market size and forecast
4.3.2.2. Locks
4.3.2.2.1. Market size and forecast
4.3.2.3. Security cameras
4.3.2.3.1. Market size and forecast
4.3.2.4. Others
4.3.2.4.1. Market size and forecast
4.4. HVAC
4.4.1. Key market trends, growth factors, and opportunities
4.4.2. Market size and forecast
4.4.2.1. Thermostats
4.4.2.1.1. Market size and forecast
4.4.2.2. Sensors
4.4.2.2.1. Market size and forecast
4.4.2.3. Control valves
4.4.2.3.1. Market size and forecast
4.4.2.4. Others
4.4.2.4.1. Market size and forecast
4.5. Entertainment
4.5.1. Key market trends, growth factors, and opportunities
4.5.2. Market size and forecast
4.5.2.1. Home theater system
4.5.2.1.1. Market size and forecast
4.5.2.2. Audio, volume, and multimedia controls
4.5.2.2.1. Market size and forecast
4.5.2.3. Others
4.5.2.3.1. Market size and forecast
4.6. Others
4.6.1. Key market trends, growth factors, and opportunities
4.6.2. Market size and forecast
CHAPTER 5: INDIA HOME AUTOMATION MARKET, BY TECHNOLOGY
5.1. Market overview
5.1.1. Market size and forecast, by technology
5.2. Wired
5.2.1. Key market trends, growth factors, and opportunities
5.2.2. Market size and forecast
5.3. Wireless
5.3.1. Key market trends, growth factors, and opportunities
5.3.2. Market size and forecast
CHAPTER 6: INDIA HOME AUTOMATION MARKET, BY END USER
6.1. Market overview
6.1.1. Market size and forecast, by end user
6.2. Residential
6.2.1. Key market trends, growth factors, and opportunities
6.2.2. Market size and forecast
6.3. Commercial
6.3.1. Key market trends, growth factors, and opportunities
6.3.2. Market size and forecast
6.4. Hospitality
6.4.1. Key market trends, growth factors, and opportunities
6.4.2. Market size and forecast
CHAPTER 7: COMPANY PROFILES
7.1. FUEB LABS
7.1.1. Company overview
7.1.2. Key Executives
7.1.3. Company snapshot
7.1.4. Product Categories
7.1.5. Product portfolio
7.2. HARMAN INTERNATIONAL INDUSTRIES INCORPORATED
7.2.1. Company overview
7.2.2. Key Executives
7.2.3. Company snapshot
7.2.4. Operating business segments
7.2.5. Product portfolio
7.2.6. Business performance
7.2.8. Key strategic moves and developments
7.3. HOME BRAIN
7.3.1. Company overview
7.3.2. Company snapshot
7.3.3. Product portfolio
7.4. JOHNSON CONTROLS INTERNATIONAL PLC
7.4.1. Company overview
7.4.2. Key Executives
7.4.3. Company snapshot
7.4.4. Operating business segments
7.4.5. Product portfolio
7.4.6. R&D Expenditure
7.4.7. Business performance
7.4.8. Key strategic moves and developments
7.5. LARSEN & TOUBRO LIMITED
7.5.1. Company overview
7.5.2. Key Executives
7.5.3. Company snapshot
7.5.4. Operating business segments
7.5.5. Product portfolio
7.5.6. R&D Expenditure
7.5.7. Business performance
7.6. NORTEK SECURITY & CONTROL LLC (“NSC”)
7.6.1. Company overview
7.6.2. Key Executives
7.6.3. Company snapshot
7.6.4. Product portfolio
7.6.5. Key strategic moves and developments
7.7. OAKTER HOME AUTOMATION
7.7.1. Company overview
7.7.2. Company snapshot
7.7.3. Product portfolio
7.8. PERT INFOCONSULTING PVT. LTD.
7.8.1. Company overview
7.8.2. Key Executives
7.8.3. Company snapshot
7.8.4. Product portfolio
7.9. SCHNEIDER ELECTRIC SE
7.9.1. Company overview
7.9.2. Key Executives
7.9.3. Company snapshot
7.9.4. Operating business segments
7.9.5. Product portfolio
7.9.6. R&D Expenditure
7.9.7. Business performance
7.9.8. Key strategic moves and developments
7.10. SILVAN INNOVATION LABS PVT. LTD.
7.10.1. Company overview
7.10.2. Key Executives
7.10.3. Company snapshot
7.10.4. Product portfolio
LIST OF TABLES
TABLE 01. DEMOGRAPHICS
TABLE 02. LIST AND OVERVIEW OF DISTRIBUTORS
TABLE 03. LIST AND OVERVIEW OF ELECTRICAL COMMISSIONING AGENTS
TABLE 04. INDIA HOME AUTOMATION MARKETREVENUE, BY TYPE, 2018–2026 ($MILLION)
TABLE 05. INDIA HOME AUTOMATION MARKET VOLUME, BY TYPE, 2018–2026 ((THOUSAND UNIT)
TABLE 06. INDIA HOME LIGHTING AUTOMATION MARKET REVENUE, BY SUBTYPE, 2018–2026 (MILLION)
TABLE 07. INDIA HOME LIGHTING AUTOMATION MARKET VOLUME, BY SUBTYPE, 2018–2026 (MILLION)
TABLE 08. INDIA HOME SECURITY & SAFETY AUTOMATION MARKET REVENUE, BY SUBTYPE, 2018–2026 (MILLION)
TABLE 09. INDIA HOME SECURITY & SAFETY AUTOMATION MARKET VOLUME, BY SUBTYPE, 2018–2026 ((THOUSAND UNIT)
TABLE 10. INDIA HOME HVAC AUTOMATION MARKET REVENUE, BY SUBTYPE, 2018–2026 (MILLION)
TABLE 11. INDIA HOME HVAC AUTOMATION MARKET VOLUME, BY SUBTYPE, 2018–2026 ((THOUSAND UNIT)
TABLE 12. INDIA HOME ENTERTAINMENT AUTOMATION MARKET REVENUE, BY SUBTYPE, 2018–2026 (MILLION)
TABLE 13. INDIA HOME ENTERTAINMENT AUTOMATION MARKET VOLUME, BY SUBTYPE, 2018–2026 ((THOUSAND UNIT)
TABLE 14. INDIA HOME AUTOMATION MARKETREVENUE, BY TECHNOLOGY, 2018–2026 ($MILLION)
TABLE 15. INDIA HOME AUTOMATION MARKET VOLUME, BY TECHNOLOGY, 2018–2026 ((THOUSAND UNIT)
TABLE 16. INDIA HOME AUTOMATION MARKET REVENUE, BY END USER, 2018–2026 ($MILLION)
TABLE 17. INDIA HOME AUTOMATION MARKET VOLUME, BY END USER, 2018–2026 ((THOUSAND UNIT)
TABLE 18. KEY EXECUTIVES
TABLE 19. FUEB LABS: COMPANY SNAPSHOT
TABLE 20. FUEB LABS: PRODUCT CATEGORIES
TABLE 21. FUEB LABS: PRODUCT PORTFOLIO
TABLE 22. KEY EXECUTIVES
TABLE 23. COMPANY SNAPSHOT
TABLE 24. HARMAN INTERNATIONAL: OPERATING SEGMENTS
TABLE 25. HARMAN INTERNATIONAL: PRODUCT PORTFOLIO
TABLE 26. HOME BRAIN: COMPANY SNAPSHOT
TABLE 27. HOME BRAIN: PRODUCT PORTFOLIO
TABLE 28. KEY EXECUTIVES
TABLE 29. JOHNSON CONTROLS: COMPANY SNAPSHOT
TABLE 30. JOHNSON CONTROLS: OPERATING SEGMENTS
TABLE 31. JOHNSON CONTROLS: PRODUCT PORTFOLIO
TABLE 32. KEY EXECUTIVES
TABLE 33. LARSEN & TOUBRO: COMPANY SNAPSHOT
TABLE 34. LARSEN & TOUBRO: OPERATING SEGMENTS
TABLE 35. LARSEN & TOUBRO: PRODUCT PORTFOLIO
TABLE 36. KEY EXECUTIVES
TABLE 37. NSC: COMPANY SNAPSHOT
TABLE 38. NSC: PRODUCT PORTFOLIO
TABLE 39. OAKTER: COMPANY SNAPSHOT
TABLE 40. OAKTER: PRODUCT PORTFOLIO
TABLE 41. KEY EXECUTIVES
TABLE 42. PERT: COMPANY SNAPSHOT
TABLE 43. PERT: PRODUCT PORTFOLIO
TABLE 44. KEY EXECUTIVES
TABLE 45. SCHNEIDER ELECTRIC: COMPANY SNAPSHOT
TABLE 46. SCHNEIDER ELECTRIC: OPERATING SEGMENTS
TABLE 47. SCHNEIDER ELECTRIC: PRODUCT PORTFOLIO
TABLE 48. KEY EXECUTIVES
TABLE 49. SILVAN INNOVATION LABS: COMPANY SNAPSHOT
TABLE 50. SILVAN INNOVATION LABS: PRODUCT PORTFOLIO
LIST OF FIGURES
FIGURE 01. INDIA HOME AUTOMATION MARKET, 2018–2026
FIGURE 02. INDIA HOME AUTOMATION MARKET: KEY PLAYERS
FIGURE 03. TOP INVESTMENT POCKETS
FIGURE 04. TOP WINNING STRATEGIES, BY YEAR, 2017–2019*
FIGURE 05. TOP WINNING STRATEGIES, BY DEVELOPMENT, 2017–2019*
FIGURE 06. TOP WINNING STRATEGIES, BY COMPANY, 2017–2019*
FIGURE 07. MODERATE-TO-HIGH BARGAINING POWER OF SUPPLIERS
FIGURE 08. MODERATE-TO-HIGH BARGAINING POWER OF BUYERS
FIGURE 09. MODERATE THREAT OF SUBSTITUTES
FIGURE 10. MODERATE THREAT OF NEW ENTRANTS
FIGURE 11. MODERATE COMPETITIVE RIVALRY
FIGURE 12. INDIA HOME AUTOMATION MARKET: DRIVERS, RESTRAINTS, AND OPPORTUNITIES
FIGURE 13. INDIA HOME AUTOMATION MARKET REVENUE, BY TYPE, 2018–2026 ($MILLION)
FIGURE 14. INDIA HOME AUTOMATION MARKET VOLUME, BY TYPE, 2018–2026 (THOUSAND UNIT)
FIGURE 15. INDIA HOME LIGHTING AUTOMATION MARKET REVENUE FOR RELAY, 2018–2026 (MILLION)
FIGURE 16. INDIA HOME LIGHTING AUTOMATION MARKET VOLUME FOR RELAY, 2018–2026 ((THOUSAND UNIT)
FIGURE 17. INDIA HOME LIGHTING AUTOMATION MARKET REVENUE FOR DIMMERS, 2018–2026 (MILLION)
FIGURE 18. INDIA HOME LIGHTING AUTOMATION MARKET VOLUME FOR DIMMERS, 2018–2026 ((THOUSAND UNIT)
FIGURE 19. INDIA HOME LIGHTING AUTOMATION MARKET REVENUE, BY SWITCHES, 2018–2026 (MILLION)
FIGURE 20. INDIA HOME LIGHTING AUTOMATION MARKET VOLUME, BY SWITCHES, 2018–2026 ((THOUSAND UNIT)
FIGURE 21. INDIA HOME LIGHTING AUTOMATION MARKET REVENUE, BY OTHERS, 2018–2026 (MILLION)
FIGURE 22. INDIA HOME LIGHTING AUTOMATION MARKET VOLUME, BY OTHERS, 2018–2026 ((THOUSAND UNIT)
FIGURE 23. INDIA HOME SECURITY & SAFETY AUTOMATION MARKET REVENUE, BY BELLS, 2018–2026 (MILLION)
FIGURE 24. INDIA HOME SECURITY & SAFETY AUTOMATION MARKET VOLUME, BY BELLS, 2018–2026 ((THOUSAND UNIT)
FIGURE 25. INDIA HOME SECURITY & SAFETY AUTOMATION MARKET REVENUE, BY LOCKS, 2018–2026 (MILLION)
FIGURE 26. INDIA HOME SECURITY & SAFETY AUTOMATION MARKET VOLUME, BY LOCKS, 2018–2026 ((THOUSAND UNIT)
FIGURE 27. INDIA HOME SECURITY & SAFETY AUTOMATION MARKET REVENUE, BY SECURITY CAMERAS, 2018–2026 (MILLION)
FIGURE 28. INDIA HOME SECURITY & SAFETY AUTOMATION MARKET VOLUME, BY SECURITY CAMERAS, 2018–2026 ((THOUSAND UNIT)
FIGURE 29. INDIA HOME SECURITY & SAFETY AUTOMATION MARKET REVENUE, BY OTHERS, 2018–2026 (MILLION)
FIGURE 30. INDIA HOME SECURITY & SAFETY AUTOMATION MARKET VOLUME, BY OTHERS, 2018–2026 ((THOUSAND UNIT)
FIGURE 31. INDIA HOME HVAC AUTOMATION MARKET REVENUE, BY THERMOSTATS, 2018–2026 (MILLION)
FIGURE 32. INDIA HOME HVAC AUTOMATION MARKET VOLUME, BY THERMOSTATS, 2018–2026 ((THOUSAND UNIT)
FIGURE 33. INDIA HOME HVAC AUTOMATION MARKET REVENUE, BY SENSORS, 2018–2026 (MILLION)
FIGURE 34. INDIA HOME HVAC AUTOMATION MARKET VOLUME, BY SENSORS, 2018–2026 ((THOUSAND UNIT)
FIGURE 35. INDIA HOME HVAC AUTOMATION MARKET REVENUE, BY CONTROL VALVES, 2018–2026 (MILLION)
FIGURE 36. INDIA HOME HVAC AUTOMATION MARKET VOLUME, BY CONTROL VALVES, 2018–2026 ((THOUSAND UNIT)
FIGURE 37. INDIA HOME HVAC AUTOMATION MARKET REVENUE, BY OTHERS, 2018–2026 (MILLION)
FIGURE 38. INDIA HOME HVAC AUTOMATION MARKET VOLUME, BY OTHERS, 2018–2026 ((THOUSAND UNIT)
FIGURE 39. INDIA HOME ENTERTAINMENT AUTOMATION MARKET REVENUE FOR HOME THEATER SYSTEM, 2018–2026 (MILLION)
FIGURE 40. INDIA HOME ENTERTAINMENT AUTOMATION MARKET VOLUME, BY HOME THEATER SYSTEM, 2018–2026 ((THOUSAND UNIT)
FIGURE 41. INDIA HOME ENTERTAINMENT AUTOMATION MARKET REVENUE, BY AUDIO, VOLUME AND MULTIMEDIA CONTROLS, 2018–2026 (MILLION)
FIGURE 42. INDIA HOME ENTERTAINMENT AUTOMATION MARKET VOLUME, BY AUDIO,VOLUME AND MULTIMEDIA CONTROL, 2018–2026 ((THOUSAND UNIT)
FIGURE 43. INDIA HOME ENTERTAINMENT AUTOMATION MARKET REVENUE, BY OTHERS, 2018–2026 (MILLION)
FIGURE 44. INDIA HOME ENTERTAINMENT AUTOMATION MARKET VOLUME, BY OTHERS, 2018–2026 ((THOUSAND UNIT)
FIGURE 45. INDIA HOME OTHERS AUTOMATION MARKET REVENUE, BY OTHERS, 2018–2026 (MILLION)
FIGURE 46. INDIA HOME OTHERS AUTOMATION MARKET REVENUE, BY OTHERS, 2018–2026 (THOUSAND UNITS)
FIGURE 47. INDIA HOME AUTOMATION MARKET REVENUE, BY TECHNOLOGY, 2018–2026 ($MILLION)
FIGURE 48. INDIA HOME AUTOMATION MARKET VOLUME, BY TECHNOLOGY, 2018–2026 ((THOUSAND UNIT)
FIGURE 49. INDIA HOME AUTOMATION MARKET REVENUE, BY WIRED, 2018–2026 (MILLION)
FIGURE 50. INDIA HOME AUTOMATION MARKET VOLUME, BY WIRED, 2018–2026 ((THOUSAND UNIT)
FIGURE 51. INDIA HOME AUTOMATION MARKET REVENUE, BY WIRELESS, 2018–2026 (MILLION)
FIGURE 52. INDIA HOME AUTOMATION MARKET VOLUME, BY WIRELESS, 2018–2026 ((THOUSAND UNIT)
FIGURE 53. INDIA HOME AUTOMATION MARKET REVENUE, BY END USER, 2018–2026 ($MILLION)
FIGURE 54. INDIA HOME AUTOMATION MARKET VOLUME, BY END USER, 2018–2026 ((THOUSAND UNIT)
FIGURE 55. INDIA HOME AUTOMATION MARKET REVENUE, BY RESIDENTIAL, 2018–2026 (MILLION)
FIGURE 56. INDIA HOME AUTOMATION MARKET VOLUME, BY RESIDENTIAL, 2018–2026 ((THOUSAND UNIT)
FIGURE 57. INDIA HOME AUTOMATION MARKET REVENUE, BY COMMERCIAL, 2018–2026 (MILLION)
FIGURE 58. INDIA HOME AUTOMATION MARKET VOLUME, BY COMMERCIAL, 2018–2026 ((THOUSAND UNIT)
FIGURE 59. INDIA HOME AUTOMATION MARKET REVENUE, BY HOSPITALITY, 2018–2026 (MILLION)
FIGURE 60. INDIA HOME AUTOMATION MARKET VOLUME, BY HOSPITALITY, 2018–2026 ((THOUSAND UNIT)
FIGURE 61. HARMAN INTERNATIONAL: REVENUE, 2016–2018 ($MILLION)
FIGURE 62. R&D EXPENDITURE, 2016–2018 ($MILLION)
FIGURE 63. JOHNSON CONTROLS: REVENUE, 2016–2018 ($MILLION)
FIGURE 64. JOHNSON CONTROLS: REVENUE SHARE BY SEGMENT, 2018 (%)
FIGURE 65. JOHNSON CONTROLS: REVENUE SHARE BY REGION, 2018 (%)
FIGURE 66. R&D EXPENDITURE, 2016–2018 ($MILLION)
FIGURE 67. LARSEN & TOUBRO: REVENUE, 2017–2019 ($MILLION)
FIGURE 68. LARSEN & TOUBRO: REVENUE SHARE BY SEGMENT, 2019 (%)
FIGURE 69. LARSEN & TOUBRO: REVENUE SHARE BY REGION, 2019 (%)
FIGURE 70. R&D EXPENDITURE, 2016–2018 ($MILLION)
FIGURE 71. SCHNEIDER ELECTRIC: REVENUE, 2016–2018 ($MILLION)
FIGURE 72. SCHNEIDER ELECTRIC: REVENUE SHARE BY SEGMENT, 2018 (%)
FIGURE 73. SCHNEIDER ELECTRIC: REVENUE SHARE BY REGION, 2018 (%)
The home automation market holds high potential in the residential sector. The current business scenario experiences rapid development in smart appliances and devices leading to the readiness to adopt this home automation technology, particularly in the urban areas such as Mumbai, New Delhi, Pune, Gurugram, and Noida. Competitors in this industry adopt various innovative techniques to provide customers with advanced and innovative features. For instance, NSC launched new facial recognition touch panels, video doorbell with built-in analytics at the Consumer Electronics Show (CES) in January 2019. The new touch panels automatically identify the person (who has been previously registered) and trigger a series of commands based on that person’s preferences including lighting levels, temperature and music.
Integration of home automation solution with smart devices are some of the major drivers for this market. However, high cost and lack of standardization of systems and devices impede the growth of this market. Factors such as technological innovations, favorable government policies, and urban renewal and planning programs by the government of India, are expected to create lucrative opportunities for the key players operating in the India home automation market.
The key companies have focused on product launch, product development, collaboration, and business expansion to strengthen their foothold in the market. For instance, in August 2018, Schneider Electric inaugurated ‘Xperience Point’ in Gurugram. The new store hosts the company’s entire suite of products for home automation. This includes products such as variety of color plates, distribution board covers, protection devices. In addition, they also displayed products that are digitized and connected to ensure sustainability and efficiency, along with providing style and comfort quotient to the homes.
Similarly, in April 2019, Schneider Electric established its new center and office facility in Pune, India. The new office is designed on an open office concept. The office works as an integrated facility for all the business operations in India. It aims to strengthen their marketing operations, and expand the smart home products & system businesses in India.
Start reading instantly.
This Report and over 67,068+ more Reports, Available with Avenue Library. T&C*.
Enterprise
License/PDF
Library
Membership
*Taxes/Fees, if applicable will be added during checkout. All prices in USD
To ensure high-level data integrity, accurate analysis, and impeccable forecasts
For complete satisfaction
On-demand customization of scope of the report to exactly meet your needs
Targeted market view to provide pertinent information and save time of readers
Get insights on topics that are crucial for your business. Stay abreast of your interest areas.
Get Industry Data AlertsTo ensure high-level data integrity, accurate analysis, and impeccable forecasts
For complete satisfaction
On-demand customization of scope of the report to exactly meet your needs
Targeted market view to provide pertinent information and save time of readers