0
2022
Industrial Brakes Market

Industrial Brakes Market

by Type (Mechanical, Hydraulic, Pneumatic, Electrical, Others), by Application (Holding Brakes, Dynamic & Emergency Brakes, Tension Brakes), by End User Industry (Manufacturing, Metal & Mining, Construction, Marine & Shipping, Others): Global Opportunity Analysis and Industry Forecast, 2020-2030

✷  Report Code: A04110
Mar 2022 | Pages: 240
Tables: 145
Charts: 59
  • Formats*:

  • pdf

    Single User License, Five User
    License & Enterprise User License

  • xls

    Data Pack Excel License

  • ppt

    It comes with the additional cost
    of $2500.00 contact sales.


Industrial Brakes Market Research, 2030

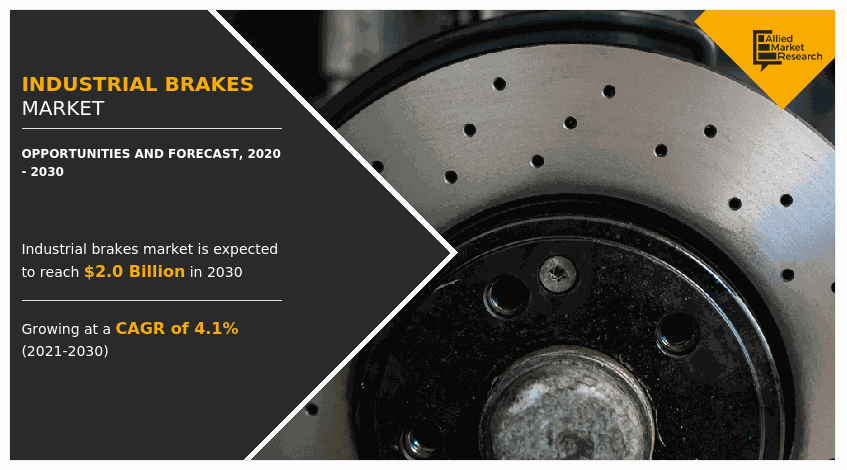
The global industrial brakes market size was valued at $1,295.20 million in 2020, and is projected to reach $1,957.31 million by 2030, growing at a CAGR of 4.1% from 2021 to 2030. Industrial brakes are the type of systems that are used for construction, forestry, axle, trailer, defense, agricultural, material handling, and utility applications. These brakes slow down or provide complete stoppage. These brakes use friction for holding rotating or movable parts in its place when required and converts kinetic energy that is generated through the friction between surfaces to halt the movement. These brakes provide complete safety that is growing in use in different industries.
The industrial brakes market was hampered during the outbreak of COVID-19 pandemic, owing to restrictions on construction activities, which also affected resales sector. In addition, the home warranty services could not be effectively sold through banks and financial channels.

The construction and manufacturing industry is growing, owing to rise in government spending over infrastructure projects and increase in demand for commercial and residential segments. Growth in construction projects is bringing more demand for construction equipment such as excavators, backhoe, graders, bulldozers, trenchers and many other construction equipment used for construction applications. This equipment has different performance needs to handle larger amount of weight. Brakes used helps in letting construction equipment to handle larger quantity of load. In addition, growing production and demand for equipment drives the industrial brakes market. In addition, use of robots for different industries is growing. For instance, industrial robots are used for manufacturing applications to provide pick and place operations. Major risks associated with using large robots over different industries is the non-commanded motion that requires immediate action to stop robots. Brakes used for robots help in providing dynamic stopping during emergency. In addition, growth in use of robots for better productivity in different industries and factories drive demand for the industrial brakes market.

However, industrial brakes are made up of different kind of materials such as  kevlar, fiberglass, fibers, metal, and ceramic to provide high durability for regular industrial usage. Hence, manufacturing using these materials leads to higher cost. This is leading various industries to use servo motors as an alternative due to lower cost and similar functionality . In addition, different countries are bringing industrial safety standards such as minimum safety standards in Europe. This deals with safety and preventing injury and harm that could be caused to humans during the use of the equipment. Hence this is also preventing the use  of certain industrial machines which is limiting the manufacturing of industrial brakes.

Industrial Brakes Market

Furthermore, during the outbreak of the COVID-19 pandemic, construction, manufacturing, hotel, and tourism industries were majorly affected. Manufacturing activities were halted or restricted. Construction and transportation activities, along with their supply chains, were hampered on a global level. This led to decline in manufacturing of industrial brakes as well as their demand in the market, thereby restraining the industrial brakes market growth. Conversely, industries are gradually resuming their regular manufacturing and services. This led to re-initiation of companies manufacturing industrial brakes at their full-scale capacities, which helped the industrial brakes market share to recover by end of 2021.
Industrial Brakes Market

Manufacturing of electric and automatic vehicles is growing, owing to certain benefits it offers over manual functioning vehicles such as reducing the speed prior to collision of vehicle, providing safety to pedestrians, reducing speed of moving vehicles, and handling emergency situations. Brakes used in vehicles are equipped with different sensors such as ultrasonic, infrared, radar, and lidar to scan objects and people nearby to vehicles. It helps in providing instant action for reducing speed, which provides better safety to users. Owing to this, various manufacturers are considering use of brakes with sensors, which is expected to offer new industrial brakes market opportunities.
Industrial Brakes Market

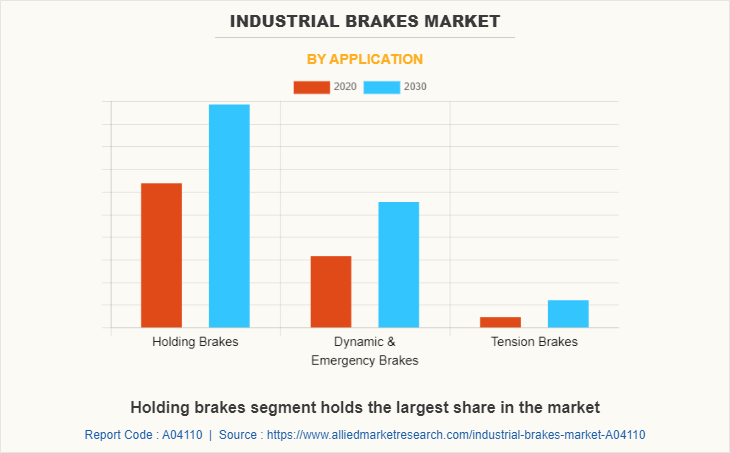
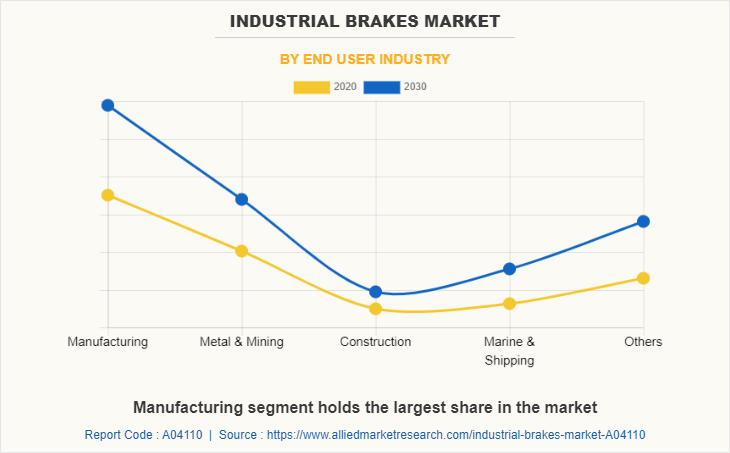
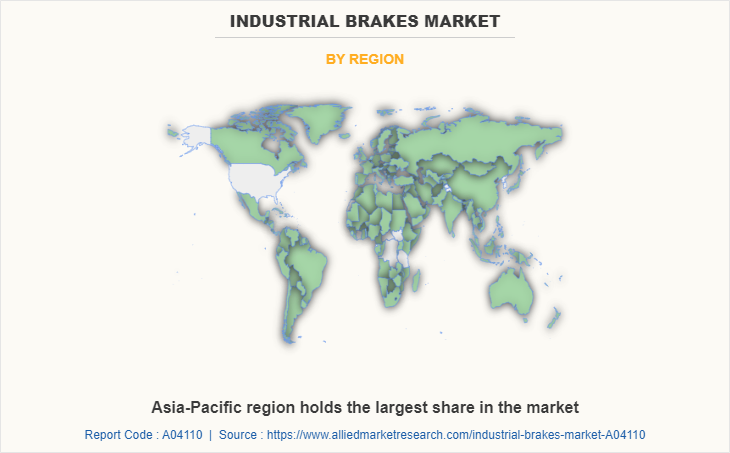
The global industrial brakes market is segmented on the basis of type, application, end user industry, and region. By type, the market is divided into mechanical, hydraulic, pneumatic, electrical, and others. By application, it is divided into holding brakes, dynamic & emergency brakes, and tension brakes. By end user industry, it is divided into manufacturing, metal & mining, construction, marine & shipping, and others. Region wise, the global industrial brakes market analysis is conducted across North America (the U.S., Canada, and Mexico), Europe (the UK, France, Germany, Italy, and rest of Europe), Asia-Pacific (China, Japan, India, South Korea, and rest of Asia-Pacific), and LAMEA (Latin America, the Middle East, and Africa).
Industrial Brakes Market

On the basis of type, in 2020, the electrical segment dominated the industrial brakes industry, in terms of revenue, whereas the others segment is expected to witness growth at the highest CAGR during the forecast period. As per application, in 2020, the holding brakes segment led the industrial brakes market, however, the tension brakes segment is expected to exhibit highest CAGR in the future. By end user industry, the manufacturing segment led the market in 2020, in terms of revenue; however, the others segment is anticipated to register highest CAGR during the forecast period. Region wise, Asia-Pacific garnered the highest revenue in 2020; however, LAMEA is anticipated to register highest CAGR during the forecast period.

COMPETITOR ANALYSIS

The major players profiled in the industrial brakes market include AKEBONO BRAKE INDUSTRY CO., LTD., Altra Motion, Antec Group, Carlisle Brake & Friction, Comer Industries Spa (Walterscheid Powertrain Group), Coremo Ocmea S.p.A., Dellner Bubenzer , Eaton, Ringspann GmbH , and SIBRE.

Major companies in the market have adopted product launch, business expansion, agreement, and acquisition as their key developmental strategies to offer better products and services to customers in the industrial brakes market.

Key Benefits For Stakeholders

  • This report provides a quantitative analysis of the market segments, current trends, estimations, and dynamics of the industrial brakes market forecast from 2020 to 2030 to identify the prevailing market opportunities.
  • The market research is offered along with information related to key drivers, restraints, and opportunities.
  • Porter's five forces analysis highlights the potency of buyers and suppliers to enable stakeholders make profit-oriented business decisions and strengthen their supplier-buyer network.
  • In-depth analysis of the industrial brakes market segmentation assists to determine the prevailing market opportunities.
  • Major countries in each region are mapped according to their revenue contribution to the global market.
  • Market player positioning facilitates benchmarking and provides a clear understanding of the present position of the market players.
  • The report includes the analysis of the regional as well as global industrial brakes market trends, key players, market segments, application areas, and market growth strategies.

Industrial Brakes Market Report Highlights

Aspects Details
By Type
  • Mechanical
  • Hydraulic
  • Pneumatic
  • Electrical
  • Others
By Application
  • Holding Brakes
  • Dynamic & Emergency Brakes
  • Tension Brakes
By End User Industry
  • Manufacturing
  • Metal & Mining
  • Construction
  • Marine & Shipping
  • Others
By Region
  • North America  (U.S., Canada, Mexico)
  • Europe  (Germany, United Kingdom, France, Italy, Rest of Europe)
  • Asia-Pacific  (China, Japan, South Korea, India, Rest of Asia-Pacific)
  • LAMEA  (Latin America, Middle East, Africa)
Key Market Players Dellner Bubenzer, Comer Industries Spa (Walterscheid Powertrain Group), Eaton, Antec Group, AKEBONO BRAKE INDUSTRY CO., LTD., carlisle brake & friction, Altra Motion, Coremo Ocmea S.p.A., SIBRE, ringspann gmbh
 
  • CHAPTER 1:INTRODUCTION

    • 1.1.Report description

    • 1.2.Key market segments

    • 1.3.Key benefits to the stakeholders

    • 1.4.Research Methodology

      • 1.4.1.Secondary research

      • 1.4.2.Primary research

      • 1.4.3.Analyst tools and models

  • CHAPTER 2:EXECUTIVE SUMMARY

    • 2.1.Key findings of the study

    • 2.2.CXO Perspective

  • CHAPTER 3:MARKET OVERVIEW

    • 3.1.Market definition and scope

    • 3.2.Key findings

      • 3.2.1.Top investment pockets

    • 3.3.Porter’s five forces analysis

    • 3.4.Top player positioning

    • 3.5.Market dynamics

      • 3.5.1.Drivers

      • 3.5.2.Restraints

      • 3.5.3.Opportunities

    • 3.6.COVID-19 Impact Analysis on the market

  • CHAPTER 4: INDUSTRIAL BRAKES MARKET, BY TYPE

    • 4.1 Overview

      • 4.1.1 Market size and forecast

    • 4.2 Mechanical

      • 4.2.1 Key market trends, growth factors and opportunities

      • 4.2.2 Market size and forecast, by region

      • 4.2.3 Market analysis by country

    • 4.3 Hydraulic

      • 4.3.1 Key market trends, growth factors and opportunities

      • 4.3.2 Market size and forecast, by region

      • 4.3.3 Market analysis by country

    • 4.4 Pneumatic

      • 4.4.1 Key market trends, growth factors and opportunities

      • 4.4.2 Market size and forecast, by region

      • 4.4.3 Market analysis by country

    • 4.5 Electrical

      • 4.5.1 Key market trends, growth factors and opportunities

      • 4.5.2 Market size and forecast, by region

      • 4.5.3 Market analysis by country

    • 4.6 Others

      • 4.6.1 Key market trends, growth factors and opportunities

      • 4.6.2 Market size and forecast, by region

      • 4.6.3 Market analysis by country

  • CHAPTER 5: INDUSTRIAL BRAKES MARKET, BY APPLICATION

    • 5.1 Overview

      • 5.1.1 Market size and forecast

    • 5.2 Holding Brakes

      • 5.2.1 Key market trends, growth factors and opportunities

      • 5.2.2 Market size and forecast, by region

      • 5.2.3 Market analysis by country

    • 5.3 Dynamic & Emergency Brakes

      • 5.3.1 Key market trends, growth factors and opportunities

      • 5.3.2 Market size and forecast, by region

      • 5.3.3 Market analysis by country

    • 5.4 Tension Brakes

      • 5.4.1 Key market trends, growth factors and opportunities

      • 5.4.2 Market size and forecast, by region

      • 5.4.3 Market analysis by country

  • CHAPTER 6: INDUSTRIAL BRAKES MARKET, BY END USER INDUSTRY

    • 6.1 Overview

      • 6.1.1 Market size and forecast

    • 6.2 Manufacturing

      • 6.2.1 Key market trends, growth factors and opportunities

      • 6.2.2 Market size and forecast, by region

      • 6.2.3 Market analysis by country

    • 6.3 Metal & Mining

      • 6.3.1 Key market trends, growth factors and opportunities

      • 6.3.2 Market size and forecast, by region

      • 6.3.3 Market analysis by country

    • 6.4 Construction

      • 6.4.1 Key market trends, growth factors and opportunities

      • 6.4.2 Market size and forecast, by region

      • 6.4.3 Market analysis by country

    • 6.5 Marine & Shipping

      • 6.5.1 Key market trends, growth factors and opportunities

      • 6.5.2 Market size and forecast, by region

      • 6.5.3 Market analysis by country

    • 6.6 Others

      • 6.6.1 Key market trends, growth factors and opportunities

      • 6.6.2 Market size and forecast, by region

      • 6.6.3 Market analysis by country

  • CHAPTER 7: INDUSTRIAL BRAKES MARKET, BY REGION

    • 7.1 Overview

      • 7.1.1 Market size and forecast

    • 7.2 North America

      • 7.2.1 Key trends and opportunities

      • 7.2.2 North America Market size and forecast, by Type

      • 7.2.3 North America Market size and forecast, by Application

      • 7.2.4 North America Market size and forecast, by End User Industry

      • 7.2.5 North America Market size and forecast, by country

        • 7.2.5.1 U.S.
          • 7.2.5.1.1 Market size and forecast, by Type
          • 7.2.5.1.2 Market size and forecast, by Application
          • 7.2.5.1.3 Market size and forecast, by End User Industry
        • 7.2.5.2 Canada
          • 7.2.5.2.1 Market size and forecast, by Type
          • 7.2.5.2.2 Market size and forecast, by Application
          • 7.2.5.2.3 Market size and forecast, by End User Industry
        • 7.2.5.3 Mexico
          • 7.2.5.3.1 Market size and forecast, by Type
          • 7.2.5.3.2 Market size and forecast, by Application
          • 7.2.5.3.3 Market size and forecast, by End User Industry
    • 7.3 Europe

      • 7.3.1 Key trends and opportunities

      • 7.3.2 Europe Market size and forecast, by Type

      • 7.3.3 Europe Market size and forecast, by Application

      • 7.3.4 Europe Market size and forecast, by End User Industry

      • 7.3.5 Europe Market size and forecast, by country

        • 7.3.5.1 Germany
          • 7.3.5.1.1 Market size and forecast, by Type
          • 7.3.5.1.2 Market size and forecast, by Application
          • 7.3.5.1.3 Market size and forecast, by End User Industry
        • 7.3.5.2 United Kingdom
          • 7.3.5.2.1 Market size and forecast, by Type
          • 7.3.5.2.2 Market size and forecast, by Application
          • 7.3.5.2.3 Market size and forecast, by End User Industry
        • 7.3.5.3 France
          • 7.3.5.3.1 Market size and forecast, by Type
          • 7.3.5.3.2 Market size and forecast, by Application
          • 7.3.5.3.3 Market size and forecast, by End User Industry
        • 7.3.5.4 Italy
          • 7.3.5.4.1 Market size and forecast, by Type
          • 7.3.5.4.2 Market size and forecast, by Application
          • 7.3.5.4.3 Market size and forecast, by End User Industry
        • 7.3.5.5 Rest of Europe
          • 7.3.5.5.1 Market size and forecast, by Type
          • 7.3.5.5.2 Market size and forecast, by Application
          • 7.3.5.5.3 Market size and forecast, by End User Industry
    • 7.4 Asia-Pacific

      • 7.4.1 Key trends and opportunities

      • 7.4.2 Asia-Pacific Market size and forecast, by Type

      • 7.4.3 Asia-Pacific Market size and forecast, by Application

      • 7.4.4 Asia-Pacific Market size and forecast, by End User Industry

      • 7.4.5 Asia-Pacific Market size and forecast, by country

        • 7.4.5.1 China
          • 7.4.5.1.1 Market size and forecast, by Type
          • 7.4.5.1.2 Market size and forecast, by Application
          • 7.4.5.1.3 Market size and forecast, by End User Industry
        • 7.4.5.2 Japan
          • 7.4.5.2.1 Market size and forecast, by Type
          • 7.4.5.2.2 Market size and forecast, by Application
          • 7.4.5.2.3 Market size and forecast, by End User Industry
        • 7.4.5.3 South Korea
          • 7.4.5.3.1 Market size and forecast, by Type
          • 7.4.5.3.2 Market size and forecast, by Application
          • 7.4.5.3.3 Market size and forecast, by End User Industry
        • 7.4.5.4 India
          • 7.4.5.4.1 Market size and forecast, by Type
          • 7.4.5.4.2 Market size and forecast, by Application
          • 7.4.5.4.3 Market size and forecast, by End User Industry
        • 7.4.5.5 Rest of Asia-Pacific
          • 7.4.5.5.1 Market size and forecast, by Type
          • 7.4.5.5.2 Market size and forecast, by Application
          • 7.4.5.5.3 Market size and forecast, by End User Industry
    • 7.5 LAMEA

      • 7.5.1 Key trends and opportunities

      • 7.5.2 LAMEA Market size and forecast, by Type

      • 7.5.3 LAMEA Market size and forecast, by Application

      • 7.5.4 LAMEA Market size and forecast, by End User Industry

      • 7.5.5 LAMEA Market size and forecast, by country

        • 7.5.5.1 Latin America
          • 7.5.5.1.1 Market size and forecast, by Type
          • 7.5.5.1.2 Market size and forecast, by Application
          • 7.5.5.1.3 Market size and forecast, by End User Industry
        • 7.5.5.2 Middle East
          • 7.5.5.2.1 Market size and forecast, by Type
          • 7.5.5.2.2 Market size and forecast, by Application
          • 7.5.5.2.3 Market size and forecast, by End User Industry
        • 7.5.5.3 Africa
          • 7.5.5.3.1 Market size and forecast, by Type
          • 7.5.5.3.2 Market size and forecast, by Application
          • 7.5.5.3.3 Market size and forecast, by End User Industry
  • CHAPTER 8: COMPANY LANDSCAPE

    • 8.1. Introduction

    • 8.2. Top winning strategies

    • 8.3. Product Mapping of Top 10 Player

    • 8.4. Competitive Dashboard

    • 8.5. Competitive Heatmap

    • 8.6. Key developments

  • CHAPTER 9: COMPANY PROFILES

    • 9.1 AKEBONO BRAKE INDUSTRY CO., LTD.

      • 9.1.1 Company overview

      • 9.1.2 Company snapshot

      • 9.1.3 Operating business segments

      • 9.1.4 Product portfolio

      • 9.1.5 Business performance

      • 9.1.6 Key strategic moves and developments

    • 9.2 Altra Motion

      • 9.2.1 Company overview

      • 9.2.2 Company snapshot

      • 9.2.3 Operating business segments

      • 9.2.4 Product portfolio

      • 9.2.5 Business performance

      • 9.2.6 Key strategic moves and developments

    • 9.3 Antec Group

      • 9.3.1 Company overview

      • 9.3.2 Company snapshot

      • 9.3.3 Operating business segments

      • 9.3.4 Product portfolio

      • 9.3.5 Business performance

      • 9.3.6 Key strategic moves and developments

    • 9.4 carlisle brake & friction

      • 9.4.1 Company overview

      • 9.4.2 Company snapshot

      • 9.4.3 Operating business segments

      • 9.4.4 Product portfolio

      • 9.4.5 Business performance

      • 9.4.6 Key strategic moves and developments

    • 9.5 Comer Industries Spa (Walterscheid Powertrain Group)

      • 9.5.1 Company overview

      • 9.5.2 Company snapshot

      • 9.5.3 Operating business segments

      • 9.5.4 Product portfolio

      • 9.5.5 Business performance

      • 9.5.6 Key strategic moves and developments

    • 9.6 Coremo Ocmea S.p.A.

      • 9.6.1 Company overview

      • 9.6.2 Company snapshot

      • 9.6.3 Operating business segments

      • 9.6.4 Product portfolio

      • 9.6.5 Business performance

      • 9.6.6 Key strategic moves and developments

    • 9.7 Dellner Bubenzer

      • 9.7.1 Company overview

      • 9.7.2 Company snapshot

      • 9.7.3 Operating business segments

      • 9.7.4 Product portfolio

      • 9.7.5 Business performance

      • 9.7.6 Key strategic moves and developments

    • 9.8 Eaton

      • 9.8.1 Company overview

      • 9.8.2 Company snapshot

      • 9.8.3 Operating business segments

      • 9.8.4 Product portfolio

      • 9.8.5 Business performance

      • 9.8.6 Key strategic moves and developments

    • 9.9 ringspann gmbh

      • 9.9.1 Company overview

      • 9.9.2 Company snapshot

      • 9.9.3 Operating business segments

      • 9.9.4 Product portfolio

      • 9.9.5 Business performance

      • 9.9.6 Key strategic moves and developments

    • 9.10 SIBRE

      • 9.10.1 Company overview

      • 9.10.2 Company snapshot

      • 9.10.3 Operating business segments

      • 9.10.4 Product portfolio

      • 9.10.5 Business performance

      • 9.10.6 Key strategic moves and developments

  • LIST OF TABLES

  • TABLE 1. GLOBAL INDUSTRIAL BRAKES MARKET, BY TYPE, 2020-2030,($MILLION)
    TABLE 2. INDUSTRIAL BRAKES MARKET REVENUE, FOR MECHANICAL, BY REGION , 2020-2030,($MILLION)
    TABLE 3. INDUSTRIAL BRAKES MARKET MECHANICAL BY COUNTRY, 2020-2030,($MILLION)
    TABLE 4. INDUSTRIAL BRAKES MARKET REVENUE, FOR HYDRAULIC, BY REGION , 2020-2030,($MILLION)
    TABLE 5. INDUSTRIAL BRAKES MARKET HYDRAULIC BY COUNTRY, 2020-2030,($MILLION)
    TABLE 6. INDUSTRIAL BRAKES MARKET REVENUE, FOR PNEUMATIC, BY REGION , 2020-2030,($MILLION)
    TABLE 7. INDUSTRIAL BRAKES MARKET PNEUMATIC BY COUNTRY, 2020-2030,($MILLION)
    TABLE 8. INDUSTRIAL BRAKES MARKET REVENUE, FOR ELECTRICAL, BY REGION , 2020-2030,($MILLION)
    TABLE 9. INDUSTRIAL BRAKES MARKET ELECTRICAL BY COUNTRY, 2020-2030,($MILLION)
    TABLE 10. INDUSTRIAL BRAKES MARKET REVENUE, FOR OTHERS, BY REGION , 2020-2030,($MILLION)
    TABLE 11. INDUSTRIAL BRAKES MARKET OTHERS BY COUNTRY, 2020-2030,($MILLION)
    TABLE 12. GLOBAL INDUSTRIAL BRAKES MARKET, BY APPLICATION, 2020-2030,($MILLION)
    TABLE 13. INDUSTRIAL BRAKES MARKET REVENUE, FOR HOLDING BRAKES, BY REGION , 2020-2030,($MILLION)
    TABLE 14. INDUSTRIAL BRAKES MARKET HOLDING BRAKES BY COUNTRY, 2020-2030,($MILLION)
    TABLE 15. INDUSTRIAL BRAKES MARKET REVENUE, FOR DYNAMIC & EMERGENCY BRAKES, BY REGION , 2020-2030,($MILLION)
    TABLE 16. INDUSTRIAL BRAKES MARKET DYNAMIC & EMERGENCY BRAKES BY COUNTRY, 2020-2030,($MILLION)
    TABLE 17. INDUSTRIAL BRAKES MARKET REVENUE, FOR TENSION BRAKES, BY REGION , 2020-2030,($MILLION)
    TABLE 18. INDUSTRIAL BRAKES MARKET TENSION BRAKES BY COUNTRY, 2020-2030,($MILLION)
    TABLE 19. GLOBAL INDUSTRIAL BRAKES MARKET, BY END USER INDUSTRY, 2020-2030,($MILLION)
    TABLE 20. INDUSTRIAL BRAKES MARKET REVENUE, FOR MANUFACTURING, BY REGION , 2020-2030,($MILLION)
    TABLE 21. INDUSTRIAL BRAKES MARKET MANUFACTURING BY COUNTRY, 2020-2030,($MILLION)
    TABLE 22. INDUSTRIAL BRAKES MARKET REVENUE, FOR METAL & MINING, BY REGION , 2020-2030,($MILLION)
    TABLE 23. INDUSTRIAL BRAKES MARKET METAL & MINING BY COUNTRY, 2020-2030,($MILLION)
    TABLE 24. INDUSTRIAL BRAKES MARKET REVENUE, FOR CONSTRUCTION, BY REGION , 2020-2030,($MILLION)
    TABLE 25. INDUSTRIAL BRAKES MARKET CONSTRUCTION BY COUNTRY, 2020-2030,($MILLION)
    TABLE 26. INDUSTRIAL BRAKES MARKET REVENUE, FOR MARINE & SHIPPING, BY REGION , 2020-2030,($MILLION)
    TABLE 27. INDUSTRIAL BRAKES MARKET MARINE & SHIPPING BY COUNTRY, 2020-2030,($MILLION)
    TABLE 28. INDUSTRIAL BRAKES MARKET REVENUE, FOR OTHERS, BY REGION , 2020-2030,($MILLION)
    TABLE 29. INDUSTRIAL BRAKES MARKET OTHERS BY COUNTRY, 2020-2030,($MILLION)
    TABLE 30. INDUSTRIAL BRAKES MARKET, BY REGION, 2020-2030,($MILLION)
    TABLE 31. NORTH AMERICA INDUSTRIAL BRAKES MARKET, BY TYPE, 2020-2030,($MILLION)
    TABLE 32. NORTH AMERICA INDUSTRIAL BRAKES MARKET, BY APPLICATION, 2020-2030,($MILLION)
    TABLE 33. NORTH AMERICA INDUSTRIAL BRAKES MARKET, BY END USER INDUSTRY, 2020-2030,($MILLION)
    TABLE 34. NORTH AMERICA INDUSTRIAL BRAKES MARKET, BY COUNTRY, 2020-2030,($MILLION)
    TABLE 35. U.S. INDUSTRIAL BRAKES MARKET BY TYPE 2020-2030,($MILLION)
    TABLE 36. U.S. INDUSTRIAL BRAKES MARKET BY APPLICATION 2020-2030,($MILLION)
    TABLE 37. U.S. INDUSTRIAL BRAKES MARKET BY END USER INDUSTRY 2020-2030,($MILLION)
    TABLE 38. CANADA INDUSTRIAL BRAKES MARKET BY TYPE 2020-2030,($MILLION)
    TABLE 39. CANADA INDUSTRIAL BRAKES MARKET BY APPLICATION 2020-2030,($MILLION)
    TABLE 40. CANADA INDUSTRIAL BRAKES MARKET BY END USER INDUSTRY 2020-2030,($MILLION)
    TABLE 41. MEXICO INDUSTRIAL BRAKES MARKET BY TYPE 2020-2030,($MILLION)
    TABLE 42. MEXICO INDUSTRIAL BRAKES MARKET BY APPLICATION 2020-2030,($MILLION)
    TABLE 43. MEXICO INDUSTRIAL BRAKES MARKET BY END USER INDUSTRY 2020-2030,($MILLION)
    TABLE 44. EUROPE INDUSTRIAL BRAKES MARKET, BY TYPE, 2020-2030,($MILLION)
    TABLE 45. EUROPE INDUSTRIAL BRAKES MARKET, BY APPLICATION, 2020-2030,($MILLION)
    TABLE 46. EUROPE INDUSTRIAL BRAKES MARKET, BY END USER INDUSTRY, 2020-2030,($MILLION)
    TABLE 47. EUROPE INDUSTRIAL BRAKES MARKET, BY COUNTRY, 2020-2030,($MILLION)
    TABLE 48. GERMANY INDUSTRIAL BRAKES MARKET BY TYPE 2020-2030,($MILLION)
    TABLE 49. GERMANY INDUSTRIAL BRAKES MARKET BY APPLICATION 2020-2030,($MILLION)
    TABLE 50. GERMANY INDUSTRIAL BRAKES MARKET BY END USER INDUSTRY 2020-2030,($MILLION)
    TABLE 51. UNITED KINGDOM INDUSTRIAL BRAKES MARKET BY TYPE 2020-2030,($MILLION)
    TABLE 52. UNITED KINGDOM INDUSTRIAL BRAKES MARKET BY APPLICATION 2020-2030,($MILLION)
    TABLE 53. UNITED KINGDOM INDUSTRIAL BRAKES MARKET BY END USER INDUSTRY 2020-2030,($MILLION)
    TABLE 54. FRANCE INDUSTRIAL BRAKES MARKET BY TYPE 2020-2030,($MILLION)
    TABLE 55. FRANCE INDUSTRIAL BRAKES MARKET BY APPLICATION 2020-2030,($MILLION)
    TABLE 56. FRANCE INDUSTRIAL BRAKES MARKET BY END USER INDUSTRY 2020-2030,($MILLION)
    TABLE 57. ITALY INDUSTRIAL BRAKES MARKET BY TYPE 2020-2030,($MILLION)
    TABLE 58. ITALY INDUSTRIAL BRAKES MARKET BY APPLICATION 2020-2030,($MILLION)
    TABLE 59. ITALY INDUSTRIAL BRAKES MARKET BY END USER INDUSTRY 2020-2030,($MILLION)
    TABLE 60. REST OF EUROPE INDUSTRIAL BRAKES MARKET BY TYPE 2020-2030,($MILLION)
    TABLE 61. REST OF EUROPE INDUSTRIAL BRAKES MARKET BY APPLICATION 2020-2030,($MILLION)
    TABLE 62. REST OF EUROPE INDUSTRIAL BRAKES MARKET BY END USER INDUSTRY 2020-2030,($MILLION)
    TABLE 63. ASIA-PACIFIC INDUSTRIAL BRAKES MARKET, BY TYPE, 2020-2030,($MILLION)
    TABLE 64. ASIA-PACIFIC INDUSTRIAL BRAKES MARKET, BY APPLICATION, 2020-2030,($MILLION)
    TABLE 65. ASIA-PACIFIC INDUSTRIAL BRAKES MARKET, BY END USER INDUSTRY, 2020-2030,($MILLION)
    TABLE 66. ASIA-PACIFIC INDUSTRIAL BRAKES MARKET, BY COUNTRY, 2020-2030,($MILLION)
    TABLE 67. CHINA INDUSTRIAL BRAKES MARKET BY TYPE 2020-2030,($MILLION)
    TABLE 68. CHINA INDUSTRIAL BRAKES MARKET BY APPLICATION 2020-2030,($MILLION)
    TABLE 69. CHINA INDUSTRIAL BRAKES MARKET BY END USER INDUSTRY 2020-2030,($MILLION)
    TABLE 70. JAPAN INDUSTRIAL BRAKES MARKET BY TYPE 2020-2030,($MILLION)
    TABLE 71. JAPAN INDUSTRIAL BRAKES MARKET BY APPLICATION 2020-2030,($MILLION)
    TABLE 72. JAPAN INDUSTRIAL BRAKES MARKET BY END USER INDUSTRY 2020-2030,($MILLION)
    TABLE 73. SOUTH KOREA INDUSTRIAL BRAKES MARKET BY TYPE 2020-2030,($MILLION)
    TABLE 74. SOUTH KOREA INDUSTRIAL BRAKES MARKET BY APPLICATION 2020-2030,($MILLION)
    TABLE 75. SOUTH KOREA INDUSTRIAL BRAKES MARKET BY END USER INDUSTRY 2020-2030,($MILLION)
    TABLE 76. INDIA INDUSTRIAL BRAKES MARKET BY TYPE 2020-2030,($MILLION)
    TABLE 77. INDIA INDUSTRIAL BRAKES MARKET BY APPLICATION 2020-2030,($MILLION)
    TABLE 78. INDIA INDUSTRIAL BRAKES MARKET BY END USER INDUSTRY 2020-2030,($MILLION)
    TABLE 79. REST OF ASIA-PACIFIC INDUSTRIAL BRAKES MARKET BY TYPE 2020-2030,($MILLION)
    TABLE 80. REST OF ASIA-PACIFIC INDUSTRIAL BRAKES MARKET BY APPLICATION 2020-2030,($MILLION)
    TABLE 81. REST OF ASIA-PACIFIC INDUSTRIAL BRAKES MARKET BY END USER INDUSTRY 2020-2030,($MILLION)
    TABLE 82. LAMEA INDUSTRIAL BRAKES MARKET, BY TYPE, 2020-2030,($MILLION)
    TABLE 83. LAMEA INDUSTRIAL BRAKES MARKET, BY APPLICATION, 2020-2030,($MILLION)
    TABLE 84. LAMEA INDUSTRIAL BRAKES MARKET, BY END USER INDUSTRY, 2020-2030,($MILLION)
    TABLE 85. LAMEA INDUSTRIAL BRAKES MARKET, BY COUNTRY, 2020-2030,($MILLION)
    TABLE 86. LATIN AMERICA INDUSTRIAL BRAKES MARKET BY TYPE 2020-2030,($MILLION)
    TABLE 87. LATIN AMERICA INDUSTRIAL BRAKES MARKET BY APPLICATION 2020-2030,($MILLION)
    TABLE 88. LATIN AMERICA INDUSTRIAL BRAKES MARKET BY END USER INDUSTRY 2020-2030,($MILLION)
    TABLE 89. MIDDLE EAST INDUSTRIAL BRAKES MARKET BY TYPE 2020-2030,($MILLION)
    TABLE 90. MIDDLE EAST INDUSTRIAL BRAKES MARKET BY APPLICATION 2020-2030,($MILLION)
    TABLE 91. MIDDLE EAST INDUSTRIAL BRAKES MARKET BY END USER INDUSTRY 2020-2030,($MILLION)
    TABLE 92. AFRICA INDUSTRIAL BRAKES MARKET BY TYPE 2020-2030,($MILLION)
    TABLE 93. AFRICA INDUSTRIAL BRAKES MARKET BY APPLICATION 2020-2030,($MILLION)
    TABLE 94. AFRICA INDUSTRIAL BRAKES MARKET BY END USER INDUSTRY 2020-2030,($MILLION)
    TABLE 95.AKEBONO BRAKE INDUSTRY CO., LTD.: COMPANY SNAPSHOT
    TABLE 96.AKEBONO BRAKE INDUSTRY CO., LTD.: OPERATING SEGMENTS
    TABLE 97.AKEBONO BRAKE INDUSTRY CO., LTD.: PRODUCT PORTFOLIO
    TABLE 98.AKEBONO BRAKE INDUSTRY CO., LTD.: NET SALES,
    TABLE 99.AKEBONO BRAKE INDUSTRY CO., LTD.: KEY STRATERGIES
    TABLE 100.ALTRA MOTION: COMPANY SNAPSHOT
    TABLE 101.ALTRA MOTION: OPERATING SEGMENTS
    TABLE 102.ALTRA MOTION: PRODUCT PORTFOLIO
    TABLE 103.ALTRA MOTION: NET SALES,
    TABLE 104.ALTRA MOTION: KEY STRATERGIES
    TABLE 105.ANTEC GROUP: COMPANY SNAPSHOT
    TABLE 106.ANTEC GROUP: OPERATING SEGMENTS
    TABLE 107.ANTEC GROUP: PRODUCT PORTFOLIO
    TABLE 108.ANTEC GROUP: NET SALES,
    TABLE 109.ANTEC GROUP: KEY STRATERGIES
    TABLE 110.CARLISLE BRAKE & FRICTION: COMPANY SNAPSHOT
    TABLE 111.CARLISLE BRAKE & FRICTION: OPERATING SEGMENTS
    TABLE 112.CARLISLE BRAKE & FRICTION: PRODUCT PORTFOLIO
    TABLE 113.CARLISLE BRAKE & FRICTION: NET SALES,
    TABLE 114.CARLISLE BRAKE & FRICTION: KEY STRATERGIES
    TABLE 115.COMER INDUSTRIES SPA (WALTERSCHEID POWERTRAIN GROUP): COMPANY SNAPSHOT
    TABLE 116.COMER INDUSTRIES SPA (WALTERSCHEID POWERTRAIN GROUP): OPERATING SEGMENTS
    TABLE 117.COMER INDUSTRIES SPA (WALTERSCHEID POWERTRAIN GROUP): PRODUCT PORTFOLIO
    TABLE 118.COMER INDUSTRIES SPA (WALTERSCHEID POWERTRAIN GROUP): NET SALES,
    TABLE 119.COMER INDUSTRIES SPA (WALTERSCHEID POWERTRAIN GROUP): KEY STRATERGIES
    TABLE 120.COREMO OCMEA S.P.A.: COMPANY SNAPSHOT
    TABLE 121.COREMO OCMEA S.P.A.: OPERATING SEGMENTS
    TABLE 122.COREMO OCMEA S.P.A.: PRODUCT PORTFOLIO
    TABLE 123.COREMO OCMEA S.P.A.: NET SALES,
    TABLE 124.COREMO OCMEA S.P.A.: KEY STRATERGIES
    TABLE 125.DELLNER BUBENZER: COMPANY SNAPSHOT
    TABLE 126.DELLNER BUBENZER: OPERATING SEGMENTS
    TABLE 127.DELLNER BUBENZER: PRODUCT PORTFOLIO
    TABLE 128.DELLNER BUBENZER: NET SALES,
    TABLE 129.DELLNER BUBENZER: KEY STRATERGIES
    TABLE 130.EATON: COMPANY SNAPSHOT
    TABLE 131.EATON: OPERATING SEGMENTS
    TABLE 132.EATON: PRODUCT PORTFOLIO
    TABLE 133.EATON: NET SALES,
    TABLE 134.EATON: KEY STRATERGIES
    TABLE 135.RINGSPANN GMBH: COMPANY SNAPSHOT
    TABLE 136.RINGSPANN GMBH: OPERATING SEGMENTS
    TABLE 137.RINGSPANN GMBH: PRODUCT PORTFOLIO
    TABLE 138.RINGSPANN GMBH: NET SALES,
    TABLE 139.RINGSPANN GMBH: KEY STRATERGIES
    TABLE 140.SIBRE: COMPANY SNAPSHOT
    TABLE 141.SIBRE: OPERATING SEGMENTS
    TABLE 142.SIBRE: PRODUCT PORTFOLIO
    TABLE 143.SIBRE: NET SALES,
    TABLE 144.SIBRE: KEY STRATERGIES
  • LIST OF FIGURES

  • FIGURE 1.INDUSTRIAL BRAKES MARKET SEGMENTATION
    FIGURE 2.INDUSTRIAL BRAKES MARKET,2020-2030
    FIGURE 3.INDUSTRIAL BRAKES MARKET,2020-2030
    FIGURE 4. TOP INVESTMENT POCKETS, BY REGION
    FIGURE 5.PORTER FIVE-1
    FIGURE 6.PORTER FIVE-2
    FIGURE 7.PORTER FIVE-3
    FIGURE 8.PORTER FIVE-4
    FIGURE 9.PORTER FIVE-5
    FIGURE 10.TOP PLAYER POSITIONING
    FIGURE 11.INDUSTRIAL BRAKES MARKET:DRIVERS, RESTRAINTS AND OPPORTUNITIES
    FIGURE 11.INDUSTRIAL BRAKES MARKET,BY TYPE,2020(%)
    FIGURE 12.COMPARATIVE SHARE ANALYSIS OF MECHANICAL INDUSTRIAL BRAKES MARKET,2020-2030(%)
    FIGURE 13.COMPARATIVE SHARE ANALYSIS OF HYDRAULIC INDUSTRIAL BRAKES MARKET,2020-2030(%)
    FIGURE 14.COMPARATIVE SHARE ANALYSIS OF PNEUMATIC INDUSTRIAL BRAKES MARKET,2020-2030(%)
    FIGURE 15.COMPARATIVE SHARE ANALYSIS OF ELECTRICAL INDUSTRIAL BRAKES MARKET,2020-2030(%)
    FIGURE 16.COMPARATIVE SHARE ANALYSIS OF OTHERS INDUSTRIAL BRAKES MARKET,2020-2030(%)
    FIGURE 17.INDUSTRIAL BRAKES MARKET,BY APPLICATION,2020(%)
    FIGURE 18.COMPARATIVE SHARE ANALYSIS OF HOLDING BRAKES INDUSTRIAL BRAKES MARKET,2020-2030(%)
    FIGURE 19.COMPARATIVE SHARE ANALYSIS OF DYNAMIC & EMERGENCY BRAKES INDUSTRIAL BRAKES MARKET,2020-2030(%)
    FIGURE 20.COMPARATIVE SHARE ANALYSIS OF TENSION BRAKES INDUSTRIAL BRAKES MARKET,2020-2030(%)
    FIGURE 21.INDUSTRIAL BRAKES MARKET,BY END USER INDUSTRY,2020(%)
    FIGURE 22.COMPARATIVE SHARE ANALYSIS OF MANUFACTURING INDUSTRIAL BRAKES MARKET,2020-2030(%)
    FIGURE 23.COMPARATIVE SHARE ANALYSIS OF METAL & MINING INDUSTRIAL BRAKES MARKET,2020-2030(%)
    FIGURE 24.COMPARATIVE SHARE ANALYSIS OF CONSTRUCTION INDUSTRIAL BRAKES MARKET,2020-2030(%)
    FIGURE 25.COMPARATIVE SHARE ANALYSIS OF MARINE & SHIPPING INDUSTRIAL BRAKES MARKET,2020-2030(%)
    FIGURE 26.COMPARATIVE SHARE ANALYSIS OF OTHERS INDUSTRIAL BRAKES MARKET,2020-2030(%)
    FIGURE 27.INDUSTRIAL BRAKES MARKET BY REGION,2020
    FIGURE 28.U.S. INDUSTRIAL BRAKES MARKET,2020-2030($MILLION)
    FIGURE 29.CANADA INDUSTRIAL BRAKES MARKET,2020-2030($MILLION)
    FIGURE 30.MEXICO INDUSTRIAL BRAKES MARKET,2020-2030($MILLION)
    FIGURE 31.GERMANY INDUSTRIAL BRAKES MARKET,2020-2030($MILLION)
    FIGURE 32.UNITED KINGDOM INDUSTRIAL BRAKES MARKET,2020-2030($MILLION)
    FIGURE 33.FRANCE INDUSTRIAL BRAKES MARKET,2020-2030($MILLION)
    FIGURE 34.ITALY INDUSTRIAL BRAKES MARKET,2020-2030($MILLION)
    FIGURE 35.REST OF EUROPE INDUSTRIAL BRAKES MARKET,2020-2030($MILLION)
    FIGURE 36.CHINA INDUSTRIAL BRAKES MARKET,2020-2030($MILLION)
    FIGURE 37.JAPAN INDUSTRIAL BRAKES MARKET,2020-2030($MILLION)
    FIGURE 38.SOUTH KOREA INDUSTRIAL BRAKES MARKET,2020-2030($MILLION)
    FIGURE 39.INDIA INDUSTRIAL BRAKES MARKET,2020-2030($MILLION)
    FIGURE 40.REST OF ASIA-PACIFIC INDUSTRIAL BRAKES MARKET,2020-2030($MILLION)
    FIGURE 41.LATIN AMERICA INDUSTRIAL BRAKES MARKET,2020-2030($MILLION)
    FIGURE 42.MIDDLE EAST INDUSTRIAL BRAKES MARKET,2020-2030($MILLION)
    FIGURE 43.AFRICA INDUSTRIAL BRAKES MARKET,2020-2030($MILLION)
    FIGURE 44. TOP WINNING STRATEGIES, BY YEAR
    FIGURE 45. TOP WINNING STRATEGIES, BY DEVELOPMENT
    FIGURE 46. TOP WINNING STRATEGIES, BY COMPANY
    FIGURE 47.PRODUCT MAPPING OF TOP 10 PLAYERS
    FIGURE 48.COMPETITIVE DASHBOARD
    FIGURE 49.COMPETITIVE HEATMAP OF TOP 10 KEY PLAYERS
    FIGURE 50.AKEBONO BRAKE INDUSTRY CO., LTD..: NET SALES ,($MILLION)
    FIGURE 51.ALTRA MOTION.: NET SALES ,($MILLION)
    FIGURE 52.ANTEC GROUP.: NET SALES ,($MILLION)
    FIGURE 53.CARLISLE BRAKE & FRICTION.: NET SALES ,($MILLION)
    FIGURE 54.COMER INDUSTRIES SPA (WALTERSCHEID POWERTRAIN GROUP).: NET SALES ,($MILLION)
    FIGURE 55.COREMO OCMEA S.P.A..: NET SALES ,($MILLION)
    FIGURE 56.DELLNER BUBENZER.: NET SALES ,($MILLION)
    FIGURE 57.EATON.: NET SALES ,($MILLION)
    FIGURE 58.RINGSPANN GMBH.: NET SALES ,($MILLION)
    FIGURE 59.SIBRE.: NET SALES ,($MILLION)


The global industrial brakes market witnessed a huge demand in Asia-Pacific followed by Europe & North America. Growth of the industrial brakes market is majorly driven by increasing activities in construction & manufacturing industries and rise in adoption of industrial robotics and automation processes.

Proliferation of industrial brakes is expected to enable consumers to gain next-generation visibility on purchased products. Increase in demand for effective anti-theft devices, owing to security concerns of enterprises regarding their products, highly contributes toward significant rise in demand for industrial brakes. Asia-Pacific is expected to have the fastest growth in the industrial brakes market, owing to rise in potential startups, surge in disposable income of consumers, increase in urbanization & industrialization, and growth in retail and health & pharmaceutical industries.

However, fluctuating prices of materials used for manufacturing industrial brakes and stringent regulations associated with industrial machineries acts as a major restraint for the industrial brakes market. On the contrary, providing technology driven brake systems enabled with sensors is expected to create opportunities for growth of the industrial brakes market during the forecast period.

Major companies in the market have adopted strategies such as product launch, business expansion, agreement, and acquisition to offer better services to customers in the industrial brakes market.

PURCHASE OPTIONS

Call or Email us

U.S.-Canada Toll-free: +1-800-792-5285
Int'l : +1-503-894-6022
Europe : +44-845-528-1300
Email : help@alliedmarketresearch.com
 
FREQUENTLY ASKED QUESTIONS?

A. The industrial brakes market was valued at $1,295.2 million in 2020, and is expected to reach $1,957.3 million by 2030, registering a CAGR of 4.1% from 2021 to 2030.

A. The forecast period considered for the global industrial brakes market is 2021 to 2030, wherein, 2020 is the base year, 2021 is the estimated year, and 2030 is the forecast year.

A. To get latest version of global industrial brakes market report can be obtained on demand from the website.

A. The base year considered in the global industrial brakes market report is 2020.

A. The top companies holding the market share in the global industrial brakes market report include AKEBONO BRAKE INDUSTRY CO., LTD., Altra Motion, Antec Group, Carlisle Brake & Friction, Comer Industries Spa (Walterscheid Powertrain Group), Coremo Ocmea S.p.A., Dellner Bubenzer , Eaton, Ringspann GmbH , SIBRE.

A. The top ten market players are selected based on two key attributes - competitive strength and market positioning.

Looking for Customization?

 Customization Request

Have a Question?

 Speak with Analyst

Any Confusion?

 Inquire Before Buying

Have a glance of the Report

  Request Sample
RELATED TAGS

Purchase Full Report of
Industrial Brakes Market

Start reading instantly.
This Report and over 67,068+ more Reports, Available with Avenue Library. T&C*.

  • Online Only
  • $3,456
  • Online cloud access only
  • Restricted print, copy, paste & download
  • Read only
  • Free industry update
    (Within 180 days)
  • Free report update in next update cycle
    (Mar 2023 - Mar 2024)
  • Data Pack
  • $3,840
  • Restricted to one authorized user
  • One print only
  • Available in
    Excel
  • Free industry update
    (Within 180 days)
  •   Free report update in next update cycle
    (Mar 2023 - Mar 2024)
  • Single User
  • $5,769
  • Restricted to one authorized user
  • One print only
  • Available in
    PDF
  • Free industry update
    (Within 180 days)
  •   Free report update in next update cycle
    (Mar 2023 - Mar 2024)
  • Five Users
  • $6,450
  • Limited to five authorized users
  • Print upto five copies
  • Available in
    PDF
  • Free industry update
    (Within 180 days)
  •   Free report update in next update cycle
    (Mar 2023 - Mar 2024)
  • Enterprise
    License/PDF

  • $10,995
  • Unlimited
    within
    company/enterprise
  • Available in Excel & PDF
  • Free industry update
    (Within 180 days)
  •   Free report update in next update cycle
    (Mar 2023 - Mar 2024)
  • Library
    Membership

  • $999 $ 1,175
    Per User/ Per month/ Billed annually
  • Published Content
    E-access
  • Company Profiles
    E-access
  • Newly Added Content Access
  • 10 PDF
    Downloads
  • 5 Excel Data
    Pack Downloads
  • 250 Company Profiles PDF Downloads
  • Buy Now

*Taxes/Fees, if applicable will be added during checkout. All prices in USD

RELATED REPORTS
 

Why Allied Market Research?


Infallible Methodology

To ensure high-level data integrity, accurate analysis, and impeccable forecasts

Analyst Support

For complete satisfaction

Customization

On-demand customization of scope of the report to exactly meet your needs

TARGETED MARKET VIEW

Targeted market view to provide pertinent information and save time of readers

Get fresh content delivered

Get insights on topics that are crucial for your business. Stay abreast of your interest areas.

Get Industry Data Alerts

Why Allied Market Research?

Infallible Methodology

To ensure high-level data integrity, accurate analysis, and impeccable forecasts

Analyst Support

For complete satisfaction

Customization

On-demand customization of scope of the report to exactly meet your needs

TARGETED MARKET VIEW

Targeted market view to provide pertinent information and save time of readers