Industrial Flooring Market by Thickness (Light Duty, Medium Duty, and Heavy Duty), Material (Epoxy, Polyaspartic, Polyurethane, Anhydrite, and Others), and End User Industry (Chemical, Food & Beverages, Healthcare, Transportation & Aviation, and Others): Global Opportunity Analysis and Industry Forecast, 2020–2027
A07925 | Pages: 238 | Nov 2020 | 818 Views | | |
Author(s) : Amar Chinchane & Satya Prakash Singh , Onkar Sumant | Tables: 114 | Charts: 59 | Formats*: | |
COVID-19
Pandemic disrupted the entire world and affected many industries.
Get detailed COVID-19 impact analysis on the Industrial Flooring Market
Request Now !Industrial Flooring Market Outlook - 2027
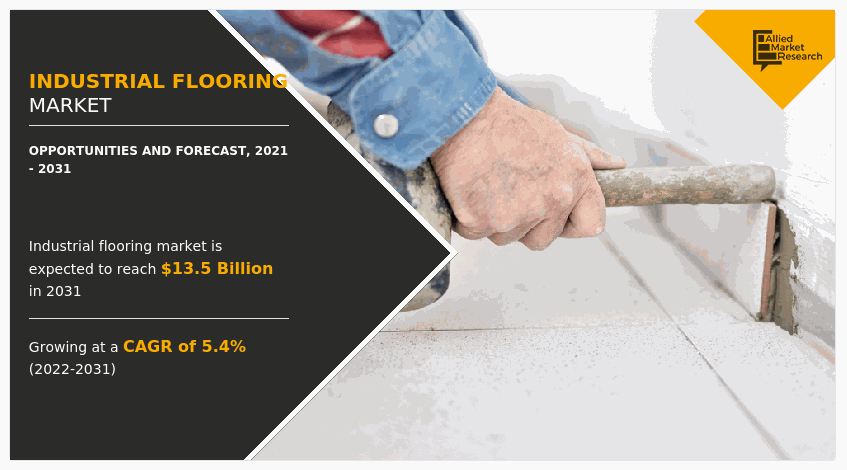
The global industrial flooring market size was valued at $6,299.4 million in 2019, and is projected to reach $8,303.1 million by 2027, registering a CAGR of 5.3% from 2020 to 2027. Industrial flooring is chemical substance that are applied on floor. When dry, these chemical substance turn into hard substance; thereby, providing walking surface. Industrial floor offers resistance to abrasion, water, chemicals, and so on. They are waterproof, anti-vibration, and anti-static. In addition, it offers attractive finish to floor and bare concrete. The industrial flooring is available in various options related to colors, material, and styles; thus, increasing their adoption in warehouses, offices, hotels, and houses. They are used across aviation & transportation, manufacturing industries, healthcare facilities, and others.
The COVID 19 outbreak has affected the growth of the industrial flooring industry owing to the lockdown measure in different countries and delay in manufacturing and production of industrial flooring materials such as epoxy, anhydrite, and others.
Increase in necessity for industrial flooring in industrial facilities drives the industrial flooring market growth. Rise in adoption of industrial flooring in industrial facilities can be attributed to the need of workplace safety and extended life of concrete flooring beneath the industrial flooring. For instance, according to the Bureau of Labor Statistics (BLS), in January 2019, out of all injuries which has happened due to falls, slips, and trips, 14.71 % happened alone due to slips and trips which can be attributed to poor flooring conditions. This indicates the necessity of proper industrial flooring which is further expected to accelerate the growth of the market.
Get more information on this report : Request Sample Pages
Growth in food & beverage, chemicals, and manufacturing industries fuels the demand for industrial flooring. Further, rise in demand for industrial flooring can be attributed to rise in establishment of food and chemicals manufacturing industries in countries such as China, India, Brazil, Egypt, the U.S., the UK, Canada, and Russia. For instance, in May 2020, the Government of India has announced to set up Special Economic Zones (SEZs) for food processing across the Telangana state. This decision is expected to give an ecosystem for food processing companies in Telangana. This kind of scenario is expected to drive the growth of the industrial flooring market as industrial flooring is one of the critical requirements for workplace safety in food processing and chemical industries.
Industrial Flooring Market
By Thickness
Medium duty segment is projected to grow at a significant CAGR
Get more information on this report : Request Sample Pages
Increase in population in the developing economies such as India, China, Mexico, Brazil, and others has resulted in rapid urbanization, which is expected to boost the development of the industrial sector, which will in turn increase the demand for industrial flooring. In May 2018, according to the United Nations (UN), around 68% of the global population is expected to live in urban areas by 2050. This is expected to result in increase of industrial construction activities around the globe, which will create the need for industrial flooring. Similarly, the governments across the globe are helping the industrial infrastructure development. For instance, in October 2019, the Government of India has planned to spend around $1.4 trillion in next five years for infrastructural development. Similarly, in August 2019, Tokyo International Conference on African Development (TICAD) planned to invest $20 billion in Africa over three years. This is expected to boost the growth of the industrial flooring market during the forecast period.
However, the fluctuations in price of raw material and lack of skilled manpower and awareness for selection of material may hamper the market growth. The COVID-19 pandemic has enforced many companies in the global industrial flooring market to halt their business operations to comply with new government regulations to curb the spread of COVID-19. This halt in operations directly impacts revenue flow of the market supply chain. In addition, implementation of lockdown and need to maintain social distancing during this pandemic has resulted in dearth of manpower, which, in turn, has negatively impacted the industrial flooring market revenue.
Industrial Flooring Market
By End-User Industry
Others segment holds dominant position in 2019
Get more information on this report : Request Sample Pages
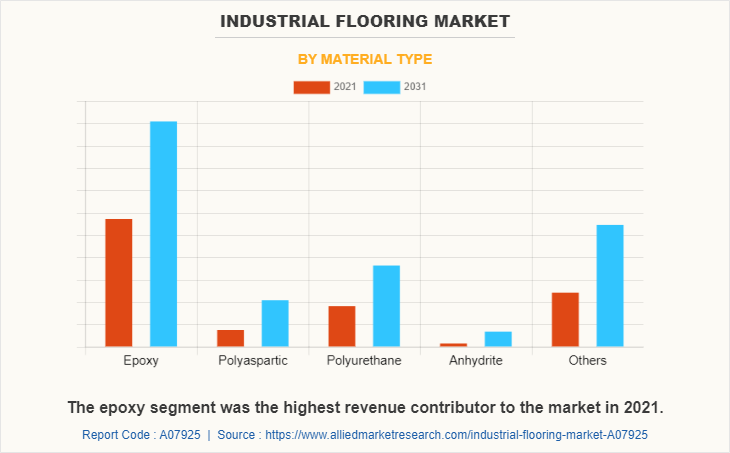
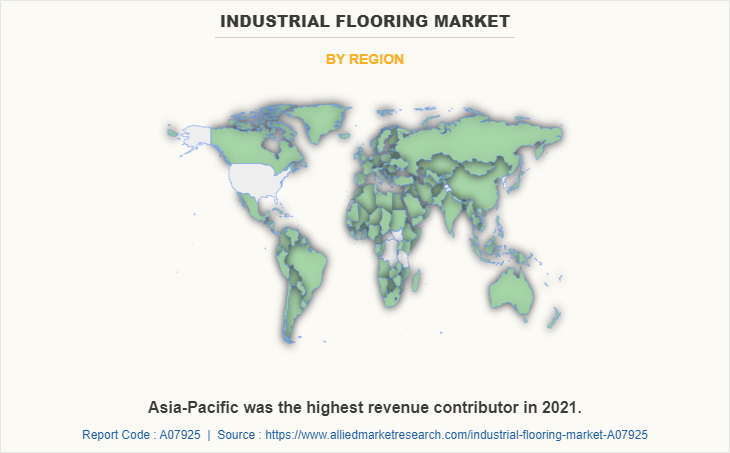
The industrial flooring market is segmented on the basis of thickness, material, end-user industry, and region. Based on thickness, the market is segmented into light duty, medium duty, and heavy duty. The material type segment is classified into epoxy, polyaspartic, polyurethane, anhydrite, and others. By end-user industry, it is segmented into chemical, food & beverages, healthcare, transportation & aviation, and others. Region wise, the market is analyzed across North America, Europe Asia-Pacific, and LAMEA. Asia-Pacific dominated the industrial flooring market in 2019, accounting for the highest share, and is anticipated to maintain this trend throughout the forecast period. This is attributed to improved economic conditions and initiatives taken by governments to provide affordable housing.
Competition Analysis
Key companies profiled in the industrial flooring market report include BASF SE, Cipy Polyurethanes Pvt. Ltd., Cornerstone Flooring, Don Construction Products Ltd., Fosroc, Inc., MAPEI S.p.A., RPM International Inc., Sika AG, Twintec Group Limited, and VIACOR Polymer GmbH. The product launch is the key strategy being adopted by the key players to remain competitive in the market. For instance, in December 2019, BASF, a German multinational chemical company launched MasterTop XTC solution, a high-performance flooring system with unique material characteristics and high durability.
Industrial Flooring Market
By Region
Asia-Pacific holds a dominant position in 2019 and is expected to grow at a significant rate during the forecast period.
Get more information on this report : Request Sample Pages
Key Benefits For Stakeholders
- The report provides an extensive analysis of the current and emerging industrial flooring market trends and dynamics.
- In-depth market analysis is conducted by constructing market estimations for the key market segments between 2019 and 2027.
- Extensive analysis of the market is conducted by following key product positioning and monitoring of the top competitors within the market framework.
- A comprehensive analysis of all the regions is provided to determine the prevailing opportunities.
- The global industrial flooring market forecast analysis from 2020 to 2027 is included in the report.
- The key players within market are profiled in this report and their strategies are analyzed thoroughly, which help understand the competitive outlook of the industrial flooring industry.
Global Market Segments
By Thickness
- Light Duty
- Medium Duty
- Heavy Duty
By Material
- Epoxy
- Polyaspartic
- Polyurethane
- Anhydrite
- Others
By End-user Industry
- Chemical
- Food & Beverages
- Healthcare
- Transportation & Aviation
- Others
By Region
- North America
- U.S.
- Canada
- Mexico
- Europe
- Germany
- UK
- France
- Russia
- Rest of Europe
- Asia-Pacific
- China
- India
- Japan
- South Korea
- Rest of Asia-Pacific
- LAMEA
- Latin America
- Middle East
- Africa
CHAPTER 1:INTRODUCTION
1.1.Report description
1.2.Key benefits for stakeholders
1.3.Key market segments
1.4.Research methodology
1.4.1.Primary research
1.4.2.Secondary research
1.4.3.Analyst tools and models
CHAPTER 2:EXECUTIVE SUMMARY
2.1.Key findings of the study
2.2.CXO perspective
CHAPTER 3:MARKET OVERVIEW
3.1.Market definition and scope
3.2.Key findings
3.2.1.Top impacting factors
3.2.2.Top investment pockets
3.2.3.Top winning strategies
3.3.Market player positioning, 2019
3.4.Porter's five forces analysis
3.5.Value chain analysis
3.6.Market dynamics
3.6.1.Drivers
3.6.1.1.Increasing industrialization around the globe
3.6.1.2.Increasing necessity for industrial flooring in industrial facilities
3.6.1.3.Growth in food & beverage, chemicals, and manufacturing industries
3.6.2.Restraints
3.6.2.1.Fluctuations in price of raw material
3.6.2.2.Lack of skilled manpower and awareness for selection of material
3.6.3.Opportunities
3.6.3.1.Increase in FDI inflows and favorable government policies
3.7.COVID-19 impact analysis
CHAPTER 4:INDUSTRIAL FLOORING MARKET, BY THICKNESS
4.1.Overview
4.1.1.Market size and forecast, by thickness
4.2.Light duty
4.2.1.Key market trends, growth factors, and opportunities
4.2.2.Market size and forecast, by region
4.2.3.Market analysis, by country
4.3.Medium Duty
4.3.1.Key market trends, growth factors, and opportunities
4.3.2.Market size and forecast, by region
4.3.3.Market analysis, by country
4.4.Heavy Duty
4.4.1.Key market trends, growth factors, and opportunities
4.4.2.Market size and forecast, by region
4.4.3.Market analysis, by country
CHAPTER 5:INDUSTRIAL FLOORING MARKET, BY MATERIAL
5.1.Overview
5.1.1.Market size and forecast, by material
5.2.Epoxy
5.2.1.Key market trends, growth factors, and opportunities
5.2.2.Market size and forecast, by region
5.2.3.Market analysis, by country
5.3.Polyaspartic
5.3.1.Key market trends, growth factors, and opportunities
5.3.2.Market size and forecast, by region
5.3.3.Market analysis, by country
5.4.Polyurethane
5.4.1.Key market trends, growth factors, and opportunities
5.4.2.Market size and forecast, by region
5.4.3.Market analysis, by country
5.5.Anhydrite
5.5.1.Key market trends, growth factors, and opportunities
5.5.2.Market size and forecast, by region
5.5.3.Market analysis, by country
5.6.Others
5.6.1.Key market trends, growth factors, and opportunities
5.6.2.Market size and forecast, by region
5.6.3.Market analysis, by country
CHAPTER 6:INDUSTRIAL FLOORING MARKET, BY END USER INDUSTRY
6.1.Overview
6.1.1.Market size and forecast, by material
6.2.Chemical
6.2.1.Key market trends, growth factors, and opportunities
6.2.2.Market size and forecast, by region
6.2.3.Market analysis, by country
6.3.Food and Beverages
6.3.1.Key market trends, growth factors, and opportunities
6.3.2.Market size and forecast, by region
6.3.3.Market analysis, by country
6.4.Healthcare
6.4.1.Key market trends, growth factors, and opportunities
6.4.2.Market size and forecast, by region
6.4.3.Market analysis, by country
6.5.Transportation and Aviation
6.5.1.Key market trends, growth factors, and opportunities
6.5.2.Market size and forecast, by region
6.5.3.Market analysis, by country
6.6.Others
6.6.1.Key market trends, growth factors, and opportunities
6.6.2.Market size and forecast, by region
6.6.3.Market analysis, by country
CHAPTER 7:INDUSTRIAL FLOORING MARKET, BY REGION
7.1.Overview
7.1.1.Market size and forecast, by region
7.2.North America
7.2.1.Key market trends and opportunities
7.2.2.Market size and forecast, by thickness
7.2.3.Market size and forecast, by material
7.2.4.Market size and forecast, by end user industry
7.2.5.Market analysis, by country
7.2.5.1.U.S.
7.2.5.1.1.Market size and forecast, by thickness
7.2.5.1.2.Market size and forecast, by material
7.2.5.1.3.Market size and forecast, by end user industry
7.2.5.2.Canada
7.2.5.2.1.Market size and forecast, by thickness
7.2.5.2.2.Market size and forecast, by material
7.2.5.2.3.Market size and forecast, by end user industry
7.2.5.3.Mexico
7.2.5.3.1.Market size and forecast, by thickness
7.2.5.3.2.Market size and forecast, by material
7.2.5.3.3.Market size and forecast, by end user industry
7.3.Europe
7.3.1.Key market trends, growth factors, and opportunities
7.3.2.Market size and forecast, by thickness
7.3.3.Market size and forecast, by material
7.3.4.Market size and forecast, by end user industry
7.3.5.Europe market size and forecast, by country
7.3.5.1.Germany
7.3.5.1.1.Market size and forecast, by thickness
7.3.5.1.2.Market size and forecast, by material
7.3.5.1.3.Market size and forecast, by end user industry
7.3.5.2.France
7.3.5.2.1.Market size and forecast, by thickness
7.3.5.2.2.Market size and forecast, by material
7.3.5.2.3.Market size and forecast, by end user industry
7.3.5.3.UK
7.3.5.3.1.Market size and forecast, by thickness
7.3.5.3.2.Market size and forecast, by material
7.3.5.3.3.Market size and forecast, by end user industry
7.3.5.4.Russia
7.3.5.4.1.Market size and forecast, by thickness
7.3.5.4.2.Market size and forecast, by material
7.3.5.4.3.Market size and forecast, by end user industry
7.3.5.5.Rest of Europe
7.3.5.5.1.Market size and forecast, by thickness
7.3.5.5.2.Market size and forecast, by material
7.3.5.5.3.Market size and forecast, by end user industry
7.4.Asia-Pacific
7.4.1.Key market trends, growth factors, and opportunities
7.4.2.Market size and forecast, by thickness
7.4.3.Market size and forecast, by material
7.4.4.Market size and forecast, by end user industry
7.4.5.Market size and forecast, by country
7.4.5.1.China
7.4.5.1.1.Market size and forecast, by thickness
7.4.5.1.2.Market size and forecast, by material
7.4.5.1.3.Market size and forecast, by end user industry
7.4.5.2.India
7.4.5.2.1.Market size and forecast, by thickness
7.4.5.2.2.Market size and forecast, by material
7.4.5.2.3.Market size and forecast, by end user industry
7.4.5.3.Japan
7.4.5.3.1.Market size and forecast, by thickness
7.4.5.3.2.Market size and forecast, by material
7.4.5.3.3.Market size and forecast, by end user industry
7.4.5.4.South Korea
7.4.5.4.1.Market size and forecast, by thickness
7.4.5.4.2.Market size and forecast, by material
7.4.5.4.3.Market size and forecast, by end user industry
7.4.5.5.Rest of Asia-Pacific
7.4.5.5.1.Market size and forecast, by thickness
7.4.5.5.2.Market size and forecast, by material
7.4.5.5.3.Market size and forecast, by end user industry
7.5.LAMEA
7.5.1.Key market trends, growth factors, and opportunities
7.5.2.Market size and forecast, by thickness
7.5.3.Market size and forecast, by material
7.5.4.Market size and forecast, by end user industry
7.5.5.Market size and forecast, by country
7.5.5.1.Latin America
7.5.5.1.1.Market size and forecast, by thickness
7.5.5.1.2.Market size and forecast, by material
7.5.5.1.3.Market size and forecast, by end user industry
7.5.5.2.Middle East
7.5.5.2.1.Market size and forecast, by thickness
7.5.5.2.2.Market size and forecast, by material
7.5.5.2.3.Market size and forecast, by end user industry
7.5.5.3.Africa
7.5.5.3.1.Market size and forecast, by thickness
7.5.5.3.2.Market size and forecast, by material
7.5.5.3.3.Market size and forecast, by end user industry
CHAPTER 8:COMPANY PROFILES
8.1.BASF SE
8.1.1.Company overview
8.1.2.Key executive
8.1.3.Company snapshot
8.1.4.Operating Business Segments
8.1.5.Product portfolio
8.1.6.Research and development expenses
8.1.7.Business performance
8.1.8.Key strategic moves and developments
8.2.Cipy Polyurethanes Pvt. Ltd.
8.2.1.Company overview
8.2.2.Key executive
8.2.3.Company snapshot
8.2.4.Product portfolio
8.3.Cornerstone Flooring
8.3.1.Company overview
8.3.2.Key executive
8.3.3.Company snapshot
8.3.4.Product portfolio
8.4.Don Construction Products Ltd.
8.4.1.Company overview
8.4.2.Key executive
8.4.3.Company snapshot
8.4.4.Product portfolio
8.4.5.Key strategic moves and developments
8.5.Fosroc, Inc.
8.5.1.Company overview
8.5.2.Key executive
8.5.3.Company snapshot
8.5.4.Product portfolio
8.5.5.Key strategic moves and developments
8.6.MAPEI S.p.A.
8.6.1.Company overview
8.6.2.Key executive
8.6.1.Company snapshot
8.6.3.Product portfolio
8.6.2.Business performance
8.6.1.Key strategic moves and developments
8.7.RPM International Inc.
8.7.1.Company overview
8.7.2.Key executive
8.7.3.Company snapshot
8.7.4.Operating business segments
8.7.5.Product portfolio
8.7.6.Research and development expenses
8.7.7.Business performance
8.7.8.Key strategic moves and developments
8.8.Sika AG
8.8.1.Company overview
8.8.2.Key executive
8.8.3.Company snapshot
8.8.4.Operating business segments
8.8.5.Product portfolio
8.8.6.Business performance
8.8.7.Key strategic moves and developments
8.9.Twintec Group Limited
8.9.1.Company overview
8.9.2.Key executive
8.9.3.Company snapshot
8.9.4.Product portfolio
8.10.VIACOR Polymer GmbH
8.10.1.Company overview
8.10.2.Key executive
8.10.3.Company snapshot
8.10.4.Product portfolio
8.10.5.Key strategic moves and developments
LIST OF TABLES
TABLE 01.GLOBAL INDUSTRIAL FLOORING MARKET REVENUE, BY THICKNESS, 2019-2027 ($MILLION)
TABLE 02.INDUSTRIAL FLOORING MARKET REVENUE FOR LIGHT DUTY, BY REGION, 2019–2027 ($MILLION)
TABLE 03.INDUSTRIAL FLOORING MARKET REVENUE FOR MEDIUM DUTY, BY REGION, 2019–2027($MILLION)
TABLE 04.INDUSTRIAL FLOORING MARKET REVENUE FOR HEAVY DUTY, BY REGION, 2019–2027($MILLION)
TABLE 05.GLOBAL INDUSTRIAL FLOORING MARKET REVENUE, BY MATERIAL, 2019-2027 ($MILLION)
TABLE 06.INDUSTRIAL FLOORING MARKET REVENUE FOR EPOXY, BY REGION, 2019–2027($MILLION)
TABLE 07.INDUSTRIAL FLOORING MARKET REVENUE FOR POLYASPARTIC, BY REGION, 2019–2027($MILLION)
TABLE 08.INDUSTRIAL FLOORING MARKET REVENUE FOR POLYURETHANE, BY REGION, 2019–2027($MILLION)
TABLE 09.INDUSTRIAL FLOORING MARKET REVENUE FOR ANHYDRITE, BY REGION, 2019–2027($MILLION)
TABLE 10.INDUSTRIAL FLOORING MARKET REVENUE FOR OTHERS, BY REGION, 2019–2027($MILLION)
TABLE 11.GLOBAL INDUSTRIAL FLOORING MARKET REVENUE, BY END USER INDUSTRY, 2019-2027 ($MILLION)
TABLE 12.INDUSTRIAL FLOORING MARKET REVENUE FOR CHEMICAL, BY REGION, 2019–2027($MILLION)
TABLE 13.INDUSTRIAL FLOORING MARKET REVENUE FOR FOOD AND BEVERAGES, BY REGION, 2019–2027($MILLION)
TABLE 14.INDUSTRIAL FLOORING MARKET REVENUE FOR HEALTHCARE, BY REGION, 2019–2027($MILLION)
TABLE 15.INDUSTRIAL FLOORING MARKET REVENUE FOR TRANSPORTATION AND AVIATION, BY REGION, 2019–2027($MILLION)
TABLE 16.INDUSTRIAL FLOORING MARKET REVENUE FOR OTHERS, BY REGION, 2019–2027($MILLION)
TABLE 17.INDUSTRIAL FLOORING MARKET REVENUE, BY REGION, 2019–2027$MILLION)
TABLE 18.NORTH AMERICA INDUSTRIAL FLOORING MARKET REVENUE, BY THICKNESS, 2019–2027($MILLION)
TABLE 19.NORTH AMERICA INDUSTRIAL FLOORING MARKET REVENUE, BY MATERIAL, 2019–2027($MILLION)
TABLE 20.NORTH AMERICA INDUSTRIAL FLOORING MARKET REVENUE, BY END USER INDUSTRY, 2019–2027($MILLION)
TABLE 21.NORTH AMERICA INDUSTRIAL FLOORING MARKET REVENUE, BY COUNTRY, 2019–2027($MILLION)
TABLE 22.U.S. INDUSTRIAL FLOORING MARKET REVENUE, BY THICKNESS, 2019–2027($MILLION)
TABLE 23.U.S. INDUSTRIAL FLOORING MARKET REVENUE, BY MATERIAL, 2019–2027($MILLION)
TABLE 24.U.S. INDUSTRIAL FLOORING MARKET REVENUE, BY END USER INDUSTRY, 2019–2027($MILLION)
TABLE 25.CANADA INDUSTRIAL FLOORING MARKET REVENUE, BY THICKNESS, 2019–2027($MILLION)
TABLE 26.CANADA INDUSTRIAL FLOORING MARKET REVENUE, BY MATERIAL, 2019–2027($MILLION)
TABLE 27.CANADA INDUSTRIAL FLOORING MARKET REVENUE, BY END USER INDUSTRY, 2019–2027($MILLION)
TABLE 28.MEXICO INDUSTRIAL FLOORING MARKET REVENUE, BY THICKNESS, 2019–2027($MILLION)
TABLE 29.MEXICO INDUSTRIAL FLOORING MARKET REVENUE, BY MATERIAL, 2019–2027($MILLION)
TABLE 30.MEXICO INDUSTRIAL FLOORING MARKET REVENUE, BY END USER INDUSTRY, 2019–2027($MILLION)
TABLE 31.EUROPE INDUSTRIAL FLOORING MARKET REVENUE, BY THICKNESS, 2019–2027($MILLION)
TABLE 32.EUROPE INDUSTRIAL FLOORING MARKET REVENUE, BY MATERIAL, 2019–2027($MILLION)
TABLE 33.EUROPE INDUSTRIAL FLOORING MARKET REVENUE, BY END USER INDUSTRY, 2019–2027($MILLION)
TABLE 34.EUROPE INDUSTRIAL FLOORING MARKET REVENUE, BY COUNTRY, 2019–2027($MILLION)
TABLE 35.GERMANY INDUSTRIAL FLOORING MARKET REVENUE, BY THICKNESS, 2019–2027($MILLION)
TABLE 36.GERMANY INDUSTRIAL FLOORING MARKET REVENUE, BY MATERIAL, 2019–2027($MILLION)
TABLE 37.GERMANY INDUSTRIAL FLOORING MARKET REVENUE, BY END USER INDUSTRY, 2019–2027($MILLION)
TABLE 38.FRANCE INDUSTRIAL FLOORING MARKET REVENUE, BY THICKNESS, 2019–2027($MILLION)
TABLE 39.FRANCE INDUSTRIAL FLOORING MARKET REVENUE, BY MATERIAL, 2019–2027($MILLION)
TABLE 40.FRANCE INDUSTRIAL FLOORING MARKET REVENUE, BY END USER INDUSTRY, 2019–2027($MILLION)
TABLE 41.UK INDUSTRIAL FLOORING MARKET REVENUE, BY THICKNESS, 2019–2027($MILLION)
TABLE 42.UK INDUSTRIAL FLOORING MARKET REVENUE, BY MATERIAL, 2019–2027($MILLION)
TABLE 43.UK INDUSTRIAL FLOORING MARKET REVENUE, BY END USER INDUSTRY, 2019–2027($MILLION)
TABLE 44.RUSSIA INDUSTRIAL FLOORING MARKET REVENUE, BY THICKNESS, 2019–2027($MILLION)
TABLE 45.RUSSIA INDUSTRIAL FLOORING MARKET REVENUE, BY MATERIAL, 2019–2027($MILLION)
TABLE 46.RUSSIA INDUSTRIAL FLOORING MARKET REVENUE, BY END USER INDUSTRY, 2019–2027($MILLION)
TABLE 47.REST OF EUROPE INDUSTRIAL FLOORING MARKET REVENUE, BY THICKNESS, 2019–2027($MILLION)
TABLE 48.REST OF EUROPE INDUSTRIAL FLOORING MARKET REVENUE, BY MATERIAL, 2019–2027($MILLION)
TABLE 49.REST OF EUROPE INDUSTRIAL FLOORING MARKET REVENUE, BY END USER INDUSTRY, 2019–2027($MILLION)
TABLE 50.ASIA-PACIFIC INDUSTRIAL FLOORING MARKET REVENUE, BY THICKNESS, 2019–2027($MILLION)
TABLE 51.ASIA-PACIFIC INDUSTRIAL FLOORING MARKET REVENUE, BY MATERIAL, 2019–2027($MILLION)
TABLE 52.ASIA-PACIFIC INDUSTRIAL FLOORING MARKET REVENUE, BY END USER INDUSTRY, 2019–2027($MILLION)
TABLE 53.ASIA-PACIFIC INDUSTRIAL FLOORING MARKET REVENUE, BY COUNTRY, 2019–2027($MILLION)
TABLE 54.CHINA INDUSTRIAL FLOORING MARKET REVENUE, BY THICKNESS, 2019–2027($MILLION)
TABLE 55.CHINA INDUSTRIAL FLOORING MARKET REVENUE, BY MATERIAL, 2019–2027($MILLION)
TABLE 56.CHINA INDUSTRIAL FLOORING MARKET REVENUE, BY END USER INDUSTRY, 2019–2027($MILLION)
TABLE 57.INDIA INDUSTRIAL FLOORING MARKET REVENUE, BY THICKNESS, 2019–2027($MILLION)
TABLE 58.INDIA INDUSTRIAL FLOORING MARKET REVENUE, BY MATERIAL, 2019–2027($MILLION)
TABLE 59.INDIA INDUSTRIAL FLOORING MARKET REVENUE, BY END USER INDUSTRY, 2019–2027($MILLION)
TABLE 60.JAPAN INDUSTRIAL FLOORING MARKET REVENUE, BY THICKNESS, 2019–2027($MILLION)
TABLE 61.JAPAN INDUSTRIAL FLOORING MARKET REVENUE, BY MATERIAL, 2019–2027($MILLION)
TABLE 62.JAPAN INDUSTRIAL FLOORING MARKET REVENUE, BY END USER INDUSTRY, 2019–2027($MILLION)
TABLE 63.SOUTH KOREA INDUSTRIAL FLOORING MARKET REVENUE, BY THICKNESS, 2019–2027($MILLION)
TABLE 64.SOUTH KOREA INDUSTRIAL FLOORING MARKET REVENUE, BY MATERIAL, 2019–2027($MILLION)
TABLE 65.SOUTH KOREA INDUSTRIAL FLOORING MARKET REVENUE, BY END USER INDUSTRY, 2019–2027($MILLION)
TABLE 66.REST OF ASIA-PACIFIC INDUSTRIAL FLOORING MARKET REVENUE, BY THICKNESS, 2019–2027($MILLION)
TABLE 67.REST OF ASIA-PACIFIC INDUSTRIAL FLOORING MARKET REVENUE, BY MATERIAL, 2019–2027($MILLION)
TABLE 68.REST OF ASIA-PACIFIC INDUSTRIAL FLOORING MARKET REVENUE, BY END USER INDUSTRY, 2019–2027($MILLION)
TABLE 69.LAMEA INDUSTRIAL FLOORING MARKET REVENUE, BY THICKNESS, 2019–2027($MILLION)
TABLE 70.LAMEA INDUSTRIAL FLOORING MARKET REVENUE, BY MATERIAL, 2019–2027($MILLION)
TABLE 71.LAMEA INDUSTRIAL FLOORING MARKET REVENUE, BY END USER INDUSTRY, 2019–2027($MILLION)
TABLE 72.LAMEA INDUSTRIAL FLOORING MARKET REVENUE, BY COUNTRY, 2019–2027($MILLION)
TABLE 73.LATIN AMERICA INDUSTRIAL FLOORING MARKET REVENUE, BY THICKNESS, 2019–2027($MILLION)
TABLE 74.LATIN AMERICA INDUSTRIAL FLOORING MARKET REVENUE, BY MATERIAL, 2019–2027($MILLION)
TABLE 75.LATIN AMERICA INDUSTRIAL FLOORING MARKET REVENUE, BY END USER INDUSTRY, 2019–2027($MILLION)
TABLE 76.MIDDLE EAST INDUSTRIAL FLOORING MARKET REVENUE, BY THICKNESS, 2019–2027($MILLION)
TABLE 77.MIDDLE EAST INDUSTRIAL FLOORING MARKET REVENUE, BY MATERIAL, 2019–2027($MILLION)
TABLE 78.MIDDLE EAST INDUSTRIAL FLOORING MARKET REVENUE, BY END USER INDUSTRY, 2019–2027($MILLION)
TABLE 79.AFRICA INDUSTRIAL FLOORING MARKET REVENUE, BY THICKNESS, 2019–2027($MILLION)
TABLE 80.AFRICA INDUSTRIAL FLOORING MARKET REVENUE, BY MATERIAL, 2019–2027($MILLION)
TABLE 81.AFRICA INDUSTRIAL FLOORING MARKET REVENUE, BY END USER INDUSTRY, 2019–2027($MILLION)
TABLE 82.BASF SE: KEY EXECUTIVES
TABLE 83.BASF SE: COMPANY SNAPSHOT
TABLE 84.BASF SE: OPERATING BUSINESS SEGMENT
TABLE 85.BASF SE: PRODUCT PORTFOLIO
TABLE 86.CIPY POLYURETHANES PVT. LTD.: KEY EXECUTIVE
TABLE 87.CIPY POLYURETHANES PVT. LTD.: COMPANY SNAPSHOT
TABLE 88.CIPY POLYURETHANES PVT. LTD.: PRODUCT PORTFOLIO
TABLE 89.CORNERSTONE FLOORING: KEY EXECUTIVE
TABLE 90.CORNERSTONE FLOORING: COMPANY SNAPSHOT
TABLE 91.CORNERSTONE FLOORING: PRODUCT PORTFOLIO
TABLE 92.KURODA PRECISION INDUSTRIES LTD.: KEY EXECUTIVE
TABLE 93.KURODA PRECISION INDUSTRIES LTD.: COMPANY SNAPSHOT
TABLE 94.DON CONSTRUCTION PRODUCTS LTD.: PRODUCT PORTFOLIO
TABLE 95.FOSROC, INC.: KEY EXECUTIVE
TABLE 96.FOSROC,INC.: COMPANY SNAPSHOT
TABLE 97.FOSROC, INC.: PRODUCT PORTFOLIO
TABLE 98.MAPEI S.P.A.: KEY EXECUTIVE
TABLE 99.MAPEI S.P.A.: COMPANY SNAPSHOT
TABLE 100.MAPEI S.P.A.: PRODUCT PORTFOLIO
TABLE 101.RPM INTERNATIONAL INC. : KEY EXECUTIVE
TABLE 102.RPM INTERNATIONAL INC.: COMPANY SNAPSHOT
TABLE 103.RPM INTERNATIONAL INC.: OPERATING SEGMENTS
TABLE 104.RPM INTERNATIONAL INC.: PRODUCT PORTFOLIO
TABLE 105.SIKA AG: KEY EXECUTIVE
TABLE 106.SIKA AG: COMPANY SNAPSHOT
TABLE 107.SIKA AG: OPERATING SEGMENTS
TABLE 108.SIKA AG: PRODUCT PORTFOLIO
TABLE 109.TWINTEC GROUP LIMITED: KEY EXECUTIVE
TABLE 110.TWINTEC GROUP LIMITED: COMPANY SNAPSHOT
TABLE 111.SKF GROUP: PRODUCT PORTFOLIO
TABLE 112.VIACOR POLYMER GMBH: KEY EXECUTIVE
TABLE 113.VIACOR POLYMER GMBH: COMPANY SNAPSHOT
TABLE 114.VIACOR POLYMER GMBH: PRODUCT PORTFOLIO
LIST OF FIGURES
FIGURE 01.KEY MARKET SEGMENTS
FIGURE 02.GLOBAL INDUSTRIAL FLOORING MARKET SNAPSHOT, BY SEGMENTION
FIGURE 03.TOP IMPACTING FACTORS
FIGURE 04.TOP INVESTMENT POCKETS
FIGURE 05.TOP WINNING STRATEGIES, BY YEAR, 2017-2020
FIGURE 06.TOP WINNING STRATEGIES, BY DEVELOPMENT, 2017–2020 (%)
FIGURE 07.TOP WINNING STRATEGIES, BY COMPANY, 2017–2020
FIGURE 08.MARKET PLAYER POSITIONING, 2019
FIGURE 09.MODERATE-TO-HIGH BARGAINING POWER OF SUPPLIERS
FIGURE 10.LOW-TO-MODERATE BARGAINING POWER OF BUYERS
FIGURE 11.LOW-TO-MODERATE THREAT OF SUBSTITUTES
FIGURE 12.LOW-TO-MODERATE THREAT OF NEW ENTRANTS
FIGURE 13.HIGH INTENSITY OF RIVALRY
FIGURE 14.VALUE CHAIN ANALYSIS
FIGURE 15.GLOBAL INDUSTRIAL FLOORING MARKET, BY THICKNESS, 2019–2027
FIGURE 16.COMPARATIVE SHARE ANALYSIS OF INDUSTRIAL FLOORING MARKET FOR LIGHT DUTY, BY COUNTRY, 2019 & 2027 (%)
FIGURE 17.COMPARATIVE SHARE ANALYSIS OF TABLE 03. INDUSTRIAL FLOORING MARKET REVENUE FOR MEDIUM DUTY, BY COUNTRY, 2019 & 2027 (%)
FIGURE 18.COMPARATIVE SHARE ANALYSIS OF INDUSTRIAL FLOORING MARKET REVENUE FOR HEAVY DUTY, BY COUNTRY, 2019 & 2027 (%)
FIGURE 19.GLOBAL INDUSTRIAL FLOORING MARKET, BY MATERIAL, 2019–2027
FIGURE 20.COMPARATIVE SHARE ANALYSIS OF INDUSTRIAL FLOORING MARKET FOR EPOXY, BY COUNTRY, 2019 & 2027 (%)
FIGURE 21.COMPARATIVE SHARE ANALYSIS OF INDUSTRIAL FLOORING MARKET FOR POLYASPARTIC, BY COUNTRY, 2019 & 2027 (%)
FIGURE 22.COMPARATIVE SHARE ANALYSIS OF INDUSTRIAL FLOORING MARKET FOR POLYURETHANE, BY COUNTRY, 2019 & 2027 (%)
FIGURE 23.COMPARATIVE SHARE ANALYSIS OF INDUSTRIAL FLOORING MARKET FOR ANHYDRITE, BY COUNTRY, 2019 & 2027 (%)
FIGURE 24.COMPARATIVE SHARE ANALYSIS OF INDUSTRIAL FLOORING MARKET FOR OTHERS, BY COUNTRY, 2019 & 2027 (%)
FIGURE 25.GLOBAL INDUSTRIAL FLOORING MARKET, BY END USER INDUSTRY, 2019–2027
FIGURE 26.COMPARATIVE SHARE ANALYSIS OF INDUSTRIAL FLOORING MARKET FOR CHEMICAL, BY COUNTRY, 2019 & 2027 (%)
FIGURE 27.COMPARATIVE SHARE ANALYSIS OF INDUSTRIAL FLOORING MARKET FOR FOOD AND BEVERAGES, BY COUNTRY, 2019 & 2027 (%)
FIGURE 28.COMPARATIVE SHARE ANALYSIS OF INDUSTRIAL FLOORING MARKET FOR HEALTHCARE, BY COUNTRY, 2019 & 2027 (%)
FIGURE 29.COMPARATIVE SHARE ANALYSIS OF INDUSTRIAL FLOORING MARKET FOR TRANSPORTATION AND AVIATION, BY COUNTRY, 2019 & 2027 (%)
FIGURE 30.COMPARATIVE SHARE ANALYSIS OF INDUSTRIAL FLOORING MARKET FOR OTHERS, BY COUNTRY, 2019 & 2027 (%)
FIGURE 31.INDUSTRIAL FLOORING MARKET, BY REGION, 2019–2027
FIGURE 32.U.S. INDUSTRIAL FLOORING MARKET REVENUE, 2019–2027($MILLION)
FIGURE 33.CANADA INDUSTRIAL FLOORING MARKET REVENUE, 2019–2027($MILLION)
FIGURE 34.MEXICO INDUSTRIAL FLOORING MARKET REVENUE, 2019–2027($MILLION)
FIGURE 35.GERMANY INDUSTRIAL FLOORING MARKET REVENUE, 2019–2027($MILLION)
FIGURE 36.FRANCE INDUSTRIAL FLOORING MARKET REVENUE, 2019–2027($MILLION)
FIGURE 37.UK INDUSTRIAL FLOORING MARKET REVENUE, 2019–2027($MILLION)
FIGURE 38.RUSSIA INDUSTRIAL FLOORING MARKET REVENUE, 2019–2027($MILLION)
FIGURE 39.REST OF EUROPE INDUSTRIAL FLOORING MARKET REVENUE, 2019–2027($MILLION)
FIGURE 40.CHINA INDUSTRIAL FLOORING MARKET REVENUE, 2019–2027($MILLION)
FIGURE 41.INDIA INDUSTRIAL FLOORING MARKET REVENUE, 2019–2027($MILLION)
FIGURE 42.JAPAN INDUSTRIAL FLOORING MARKET REVENUE, 2019–2027($MILLION)
FIGURE 43.SOUTH KOREA INDUSTRIAL FLOORING MARKET REVENUE, 2019–2027($MILLION)
FIGURE 44.REST OF ASIA-PACIFIC INDUSTRIAL FLOORING MARKET REVENUE, 2019–2027($MILLION)
FIGURE 45.LATIN AMERICA INDUSTRIAL FLOORING MARKET REVENUE, 2019–2027($MILLION)
FIGURE 46.MIDDLE EAST INDUSTRIAL FLOORING MARKET REVENUE, 2019–2027($MILLION)
FIGURE 47.AFRICA INDUSTRIAL FLOORING MARKET REVENUE, 2019–2027($MILLION)
FIGURE 48.BASF SE: RESEARCH AND DEVELOPMENT EXPENSES, 2017–2019($MILLION)
FIGURE 49.BASF SE: REVENUE, 2017–2019 ($MILLION)
FIGURE 50.BASF SE: REVENUE SHARE, BY SEGMENT, 2019 (%)
FIGURE 51.MAPEI S.P.A. : REVENUE, 2018–2019($MILLION)
FIGURE 52.MAPEI S.P.A. : REVENUE SHARE, BY REGION, 2019(%)
FIGURE 53.RPM INTERNATIONAL INC. : RESEARCH AND DEVELOPMENT EXPENSES, 2017–2019 ($MILLION)
FIGURE 54.RPM INTERNATIONAL INC. : REVENUE, 2017–2019($MILLION)
FIGURE 55.RPM INTERNATIONAL INC. : REVENUE SHARE, BY SEGMENT, 2019(%)
FIGURE 56.RPM INTERNATIONAL INC. : REVENUE SHARE, BY REGION, 2019(%)
FIGURE 57.SIKA AG: NET SALES, 2017–2019 ($MILLION)
FIGURE 58.SIKA AG: REVENUE SHARE, BY SEGMENT, 2019 (%)
FIGURE 59.SIKA AG: REVENUE SHARE, BY REGION, 2019 (%)
The rise in industrial infrastructure development projects, especially in developing countries in Southeast Asian regions is anticipated to provide numerous business opportunities for market players. For example, India has received FDI of USD 49 billion in manufacturing sector during 2019, which is a 16% increase as compared to 2018. These kinds of scenarios are expected to drive the growth of industrial flooring market during the forecast period. Moreover, rise in adoption of industrial flooring in industries such as manufacturing industry, energy & power industry, oil & gas industry can be attributed to its advantages such as slip resistance, oil stain resistance, and resistance to impact heavy fork lift trucks. In addition, growth in oil & gas industry and energy & power industry is expected to drive the demand for industrial flooring during the forecast period.
In addition, growth in transportation and aviation industry around the globe is expected to push the demand for industrial flooring during the forecast period. For instance, in June 2020, France government has announced to invest EUR 15 Billion (USD 16.9 Billion) in aviation sector to overcome the effect of COVID-19 on country’s aviation sector. Further, players in industrial flooring market are adopting acquisition strategy to expand their business. For instance, in July 2019, Serafin Group based in Germany has signed an agreement to acquire RCR Industrial Flooring based in Spain. This acquisition will help Serafin Group to venture into the business of industrial flooring. These factors are anticipated to propel the growth of industrial flooring market during the forecast period.
Q1. What are the key trends in the Industrial flooring market?
A. Rise in industrialization and growth in manufacturing industry in developing countries are the key trends in the industrial flooring market.
Q2. What are the key growth strategies of Industrial flooring industry players?
A. The product launch is key growth strategy of industrial flooring industry players.
Q3. How can I get report sample of Industrial flooring market?
A. To get latest version of Industrial flooring market report can be obtained on demand from the website.
Q4. Which market holds the maximum market share of the Industrial flooring market?
A. Based on material, the epoxy segment holds the maximum market share of the Industrial flooring market in 2019.
Q5. What will be Industrial flooring market growth in 2027?
A. The Industrial flooring market is projected to reach $8,303.1 million by 2027.
Q6. How can I get statistical data of top market players of Industrial flooring market?
A. The top ten market players are selected based on two key attributes - competitive strength and market positioning
Q7. What is the total market value of industrial flooring market?
A. The Industrial flooring market size was valued at $6,299.4 million in 2019.
Q8. How the company profile has been selected?
A. The company profile has been selected on factors such as geographical presence, market dominance (in terms of revenue and volume sales), various strategies and recent developments.
Q9. What is the Industrial flooring market effecting factors?
A. Fluctuating raw material prices are the effecting factor for industrial flooring market.
Q10. What are the applications of industrial flooring market?
A. The applications of industrial flooring include floor coating in end user industries such as chemical, healthcare, manufacturing, and other industries.
Download Sample
Purchase Full Report of
Industrial Flooring Market
- Online Only
- $3,456
- Online cloud access only
- Restricted print, copy, paste & download
- Read only
- Free quarterly industry update
- Free report update (Within 180 days)
- Subscription model sign in
- Data Pack
- $3,840
- Restricted to one authorized user
- One print only
- Available in
Excel - Free quarterly industry update
- Free report update (Within 180 days)
- Subscription model sign in
- Single User
- $5,769
- Restricted to one authorized user
- One print only
- Available in Excel & PDF
- Free quarterly industry update
- Free report update (Within 180 days)
- Subscription model sign in
- Five Users
- $6,450
- Limited to five authorized users
- Print upto five copies
- Available in Excel & PDF
- Free quarterly industry update
- Free report update (Within 180 days)
- Subscription model sign in
-
Enterprise
License/PDF - $8,995
- Unlimited
within
company/enterprise - Available in Excel & PDF
- Free quarterly industry update
- Free report update (Within 180 days)
- Subscription model sign in
- Library Membership
- $ 699/mo
- Published Content
E-access - Company Profiles
E-access - Newly Added Content Access
- 10 PDF
Downloads - 5 Excel Data
Pack Downloads - 250 Company Profiles PDF Downloads
-
Start reading instantly.
Buy Now
This title and over 12,000+ are available on the Avenue Library. T&C*.
*Taxes/Fees, if applicable will be added during checkout. All prices in USD
Why Allied Market Research?
Infallible Methodology
To ensure high-level data integrity, accurate analysis, and impeccable forecasts
Analyst Support
For complete satisfaction
Customization
On-demand customization of scope of the report to exactly meet your needs
TARGETED MARKET VIEW
Targeted market view to provide pertinent information and save time of readers
Featured Reports
Get fresh content delivered
Get insights on topics that are crucial for your business. Stay abreast of your interest areas.
Why Allied Market Research?
Infallible Methodology
To ensure high-level data integrity, accurate analysis, and impeccable forecasts
Analyst Support
For complete satisfaction
Customization
On-demand customization of scope of the report to exactly meet your needs
TARGETED MARKET VIEW
Targeted market view to provide pertinent information and save time of readers