
Industrial Heating Equipment Market Research, 2032
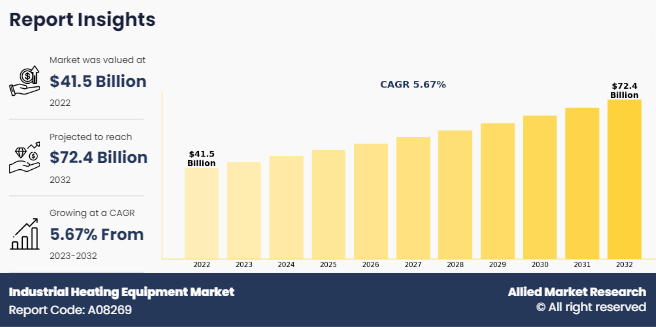
The Global Industrial Heating Equipment Market was valued at $41.5 billion in 2022, and is projected to reach $72.4 billion by 2032, growing at a CAGR of 5.67% from 2023 to 2032.
Industrial heating equipment refers to the machinery and devices used to generate heat for various industrial processes, including manufacturing, refining, chemical processing, food processing, pharmaceutical production, and energy generation. These equipment are designed to provide controlled and consistent heat levels to facilitate specific industrial operations.
Industrial heating equipment is a vast assortment of machines and tools employed in varied high-temperature heating uses found within the businesses like power development, chemical processing, manufacturing industry or pharmaceuticals. They are made up of various types such as furnaces, boilers, ovens, heat exchangers, heaters, incinerators, heat tracing systems and heat pumps. Furnaces are closed units used for high temperature heating purposes while boilers generate steam or hot water by heating water. Ovens are used for baking cures drying among other heat treatment processes whereas heat exchangers transfer heat between two fluids without mixing them. In this case heaters produce the direct heat meant for specific industrial applications but incinerators burn waste materials in a controlled manner. Heat tracing systems keep pipes tanks and other industrial equipment at desired temperatures while heat pumps are devices that transfer refrigeration cycle from one location to another.
In addition to the above, industrial heating equipment is critical for various activities within food processing. It is used for cooking, drying, pasteurization and sterilization. These processes are essential in ensuring the safety of food, preservation of food products in the market and quality improvement. Moreover, heating is essential for various processes in chemicals which include distillation, reaction vessel heating and synthesis among others. These processes have allowed the production of a wide variety of chemicals and other materials as well.
In addition, this equipment is used in power plants to make steam for driving turbines so that electricity can be generated by means of processes like coal combustion, nuclear fission or renewable energy. Furthermore, this is important in activities such as dyeing, drying and finishing textiles thereby leading to the manufacture of clothes and fabrics altogether. In addition, it plays a vital part in environmental control systems for air pollution control, waste treatment and remediation processes.
The growth of the global industrial heating equipment market share is majorly driven by rise in demand for industrial heating equipment from various end-use industries. Besides, key players in the market are heavily investing on improving the power generation capacity of industrial heating equipment which significantly contribute towards the global market development. But, stringent government regulations against ecological pollution remain the greatest barrier to its expansion. However, there could be increased popularity on geothermal heat pump technologies which may provide further growth opportunities across markets worldwide.
Key Takeaways of Industrial Heating Equipment Market Report:
Based on product type, the boilers segment held the largest share of the industrial heating equipment market in 2022. However, the heat pumps segment is anticipated to grow at the fastest CAGR during the forecast period.
Based on fuel type, the fossil fuel segment dominated the industrial heating equipment market size in terms of revenue in 2022. However, the electric segment is anticipated to grow at the fastest CAGR during the forecast period.
Based on end-user industry, the others segment held the largest share in the industrial heating equipment industry in 2022 and is anticipated to grow at the fastest CAGR during the forecast period.
Region-wise, Asia-Paicific held the largest market share in 2022. However, LAMEA is expected to witness the highest CAGR during the forecast period.
Market Dynamics
The need for efficient heating solutions that can save costs and reduce environmental impacts is one major driving factor. Firms are now focusing on heating systems with heightened efficiency and reduced emissions since they have to meet strict regulations and sustainability targets. Moreover, market expansion has been stimulated through the rise of smart heating systems which results from technological advancements like development of sophisticated control techniques as well as inclusion of internet capabilities in the Internet of Things.
However, there are barriers such as high initial costs of purchasing industrial heating equipment in the market. This has become a challenge to many enterprises particularly those that are small and medium sized due to financial constraints. The slow growth of these markets could also come about because some industries may not be aware of the advantages associated with adopting new kinds of heating technologies. These challenges include unpredictable economic conditions as well as fluctuating prices of raw materials used in making heating equipment therefore affecting profitability levels for firms operating within this sector hence deterring them from investing in research and development activities.
The industrial warming appliances marketplace may have vast growth prospects even with these barriers. The pace of industrialization observed in developing countries is anticipated to result in a massive demand for heating equipment from manufacturing, chemicals, and food processing industries. This development has also created opportunities for automating the systems and integrating them with advanced control systems as well as predictive maintenance technologies. Moreover, the increasing adoption of solar and biomass energy sources by industries for heating purposes creates new opportunities for innovation and market diversification on a global scale.
Segment Overview
The industrial heating equipment market is segmented into Product Type,Fuel Type, and End-User Industry,.
By Product Type

On the basis of product type, the industrial heating equipment market is broken down into heat pumps, furnaces, and boilers. In 2022, the boilers segment held the largest share of the industrial heating equipment market due to widespread use and efficiency in generating heat for various industrial processes.
By Fuel Type

On the basis of fuel type, the market is classified into fossil fuel, and electric. In 2022, the fossil fuel segment dominated the industrial heating equipment market size in terms of revenue owing to increase in initiatives toward industrialization and rapid urbanization in the developing economies, such as China, India, and South Africa, have increased power plant installation activities.
By End-User Industry

On the basis of end-user industry, the market is fragmented into oil and gas, metal and mining, chemical, and others. In 2022, the others segment held the largest share in the industrial heating equipment industry owing to installation of heating equipment in these various industries for operations such as power generation, drying, humidification, and other heating purposes in industries such as electronics, semiconductor, paper & pulp, pharmaceutical, and food processing.
By Region

On the basis of region, the global industrial heating equipment market is analyzed across North America (the U.S., Canada, and Mexico), Europe (Germany, UK, France, Spain, and Rest of Europe), Asia-Pacific (China, Japan, India, South Korea, and rest of Asia-Pacific), and LAMEA (Latin America, Middle East, and Africa). In 2022, Asia-Pacific held the largest market share in the industrial heating equipment industry owing to strong manufacturing activities, economic development, increase in production activities, and rise in foreign investment act as the major drivers of the LAMEA industrial heating equipment market.
Country Analysis
In North America, the U.S. stands out as the highest revenue generator in the industrial heating equipment market. Heat pumps, boilers, furnaces, and unitary heaters are some of the industrial heating equipment that are expected to witness high demand in the U.S. One of the primary factors driving the growth of this market is the combination of rapid industrialization and increased demand for more modern equipment. Furthermore, the growing need for energy-efficient home heating solutions is expected to drive market growth in the during the forecast period.
In Europe, Rest of Europe holds the maximum share in the industrial heating equipment market. There has been increase in demand for industrial heating equipment with development in food & beverage, pharmaceutical, chemical & petrochemical, mining, and other industries in rest of Europe. Furthermore, Europe's commitment to reduce greenhouse gas emissions and transitioning to cleaner energy sources impacts the heating industry. In addition, district heating networks, prevalent in many European cities such as Italy and Poland, rely on centralized heating plants, which heat to residential, commercial, and industrial buildings in the region. According to the European Heat Pump Association (EHPA) market statistics report, 3 million heat pumps were installed in Europe during 2022. This represents an impressive doubling since 2019. Notably, sales doubled within a single year in the countries such as Poland, Czech Republic, and Belgium.
In the Asia-Pacific region, China emerges as the highest revenue generator for industrial heating equipment. Chinas relentless industrial expansion fuels the demand for cutting-edge heating solutions. Amid growing environmental consciousness, Chinese industries seek eco-friendly alternatives. Clean-burning technologies, such as heat pumps and solar thermal systems, are gaining high traction, which is expected to notably contribute toward the growth of the market.
In LAMEA, there has been a rise in mining of metals in the Middle East countries. Major players such as Carrier Middle East, Johnson Controls, and Daikin MEA that offer heating equipment are expanding their base in the Middle Eastern countries to strengthen their customer base owing to increase in mining of ferrous and non-ferrous metals. Furthermore, 54 new mineral mining sites are identified in Saudi Arabia.
Top Impacting Factors
The industrial heating equipment market is expected to witness notable growth owing to rise in demand for steam boilers from various end-use industries and increase in investment toward adding power generation capacity. Moreover, increase in popularity of geothermal heat pump technology is expected to provide lucrative opportunity for the growth of the market during the forecast period. On the contrary, implementation of stringent government regulations toward environmental pollution limits the growth of the industrial heating equipment market.
Competitive Analysis
The industrial heating equipment market is expected to witness notable growth owing to rise in demand for steam boilers from various end-use industries and increase in investment toward adding power generation capacity. Moreover, increase in popularity of geothermal heat pump technology is expected to provide lucrative opportunity for the growth of the market during the forecast period. On the contrary, implementation of stringent government regulations toward environmental pollution limits the growth of the industrial heating equipment market.
Key Developments/ Strategies
According to the latest industrial heating equipment market overview, Carrier, Easco Boiler Corp., Emerson Electric Co., Ingersoll Rand Inc., Johnson Controls, Inc., Lennox International Inc., McKenna Boiler Works Inc., The Danfoss Group, Thermcraft, Inc., and Uponor Corporation are the top players in the industrial heating equipment market. Top market players have adopted a product launches, and collaboration strategies to expand their foothold in the industrial heating equipment market forecast.
- February 2024 - Ingersoll Rand Inc. acquired Friulair S.r.l. in an all-cash upfront purchase price of approximately $146M. Through this strategy, it increases scale of air dryer business and adds new chiller and heat pump technologies and production capabilities. This results in increasing its access to the original equipment manufacturer channel & new chiller production capabilities.
- November 2023 - Johnson Controls received a $33 million grant from the U.S. Department of Energy's (DOE) Office of Manufacturing and Energy Supply Chains to help increase domestic production of electric heat pumps by expanding three U.S.-based manufacturing sites. The new plants produce an estimated 200,000 residential, commercial, and industrial heat pumps combined a production increase of 200%.
- September 2023 - Carrier launched high-temperature heat pumps for applications in industrial sites, commercial settings, public buildings, and district heating systems. It developed four new products with capacities ranging from 30 kW to 375 kW, all of which use hydrofluoroolefins as a refrigerant. The AquaForce 61CW-Z water-source heat pump offers power ranging from 410 kW to 735 kW
- February 2022 - Johnson Controls launched YORK heat pump portfolio at HR Expo, Georgia. It includes a two-module unit of the YORK YMAE Air-Cooled Inverter Scroll Modular Heat Pump and 1:12 scale models of the YORKR. YVWH Water-to-Water Dual Variable-Speed Screw Heat Pump and YORK CYK Water-to-Water Compound Centrifugal Heat Pump. This pump help to keep buildings comfortable using clean energy while reducing carbon emissions & operational costs.
Key Benefits For Stakeholders
- This report provides a quantitative analysis of the market segments, current trends, estimations, and dynamics of the industrial heating equipment market analysis from 2022 to 2032 to identify the prevailing industrial heating equipment market growth.
- The market research is offered along with information related to key drivers, restraints, and opportunities.
- Porter's five forces analysis highlights the potency of buyers and suppliers to enable stakeholders make profit-oriented business decisions and strengthen their supplier-buyer network.
- In-depth analysis of the industrial heating equipment market segmentation assists to determine the prevailing industrial heating equipment market outlook.
- Major countries in each region are mapped according to their revenue contribution to the global market.
- Market player positioning facilitates benchmarking and provides a clear understanding of the present position of the market players.
- The report includes the analysis of the regional as well as global industrial heating equipment market trends, key players, market segments, application areas, and market growth strategies.
Industrial Heating Equipment Market Report Highlights
| Aspects | Details |
| Market Size By 2032 | USD 72.4 billion |
| Growth Rate | CAGR of 5.7% |
| Forecast period | 2022 - 2032 |
| Report Pages | 260 |
| By End-User Industry |
|
| By Product Type |
|
| By Fuel Type |
|
| By Region |
|
| Key Market Players | Danfoss A/S, EASCO BOILER CORP, Lennox International Inc., THERMCRAFT, INC. (AECO Corp.), Carrier, Emerson Electric Co., Uponor Corporation, Ingersoll Rand Inc., Johnson Controls, McKenna Boiler Works Inc. |
Analyst Review
According to the insights of CXOs of leading companies, the industrial heating equipment market is mainly driven by factors such as increasing demand for energy-efficient solutions, advancements in technology leading to enhanced product offerings, stringent regulations promoting sustainability, and growing industrialization across emerging economies.
However, implementation of stringent government regulations toward environmental pollution acts as restraint to the industrial heating equipment market growth. On the contrary, increase in popularity of geothermal heat pump technology has led to adoption of these heat pumps in manufacturing processes and will be a major opportunity for the industrial heating equipment market during the forecast period.
Major companies in the market have adopted strategies such as product launch and acquisition to offer better products and services to customers in the industrial heating equipment market. For instance, in November 2023, Johnson Controls received a $33 million grant from the U.S. Department of Energy's (DOE) Office of Manufacturing and Energy Supply Chains to help increase domestic production of electric heat pumps by expanding three U.S.-based manufacturing sites. The new plants produce an estimated 200,000 residential, commercial, and industrial heat pumps combined—a production increase of 200%.
The increasing adoption of renewable energy sources such as solar and biomass for sustainable heating solutions is the upcoming trends of Industrial Heating Equipment Market in the world.
The leading application of the Industrial Heating Equipment Market is in the manufacturing sector, encompassing processes such as metal heating, plastic molding, and heat treatment.
Asia-Pacific is the largest regional market for Industrial Heating Equipment.
The global industrial heating equipment market was valued at $41,544.7 million in 2022.
Carrier, Easco Boiler Corp., Emerson Electric Co., Ingersoll Rand Inc., Johnson Controls, Inc., Lennox International Inc., McKenna Boiler Works Inc., The Danfoss Group, Thermcraft, Inc., and Uponor Corporation.
Loading Table Of Content...
Loading Research Methodology...

