
Industrial Insulators Market Research, 2033
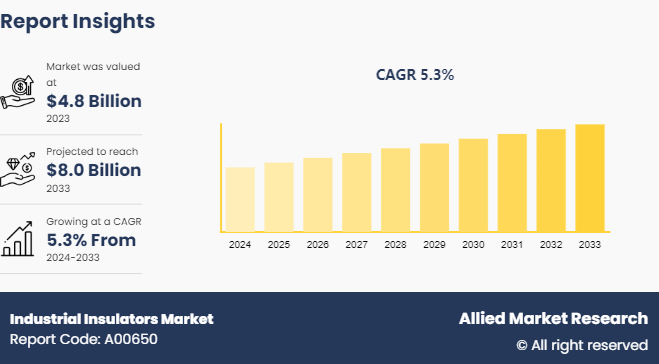
The global industrial insulators market size was valued at $4.8 billion in 2023, and is projected to reach $8.0 billion by 2033, growing at a CAGR of 5.3% from 2024 to 2033.
Market Introduction and Definition
Industrial insulators are materials or devices used in industrial applications to prevent the transfer of electricity, heat, or sound between conducting bodies or from one area to another. They are essential for ensuring safety, efficiency, and performance in various industrial processes. Electrical insulators are commonly used to support and separate electrical conductors without allowing current through themselves, while thermal insulators reduce the rate of heat transfer, maintaining temperature control. These insulators are made from a range of materials, such as ceramics, glass, rubber, plastics, and specialized composites, depending on the specific requirements of the application.
Key Takeaways
The industrial insulators market forecast covers 20 countries. The research includes a segment analysis of each country in terms of value ($billion) for the projected period 2023-2033.
More than 1, 500 product literatures, industry releases, annual reports, and other such documents of major industrial insulators industry participants along with authentic industry journals, trade associations' releases, and government websites have been reviewed for generating high-value industry insights.
The study integrated high-quality data, professional opinions and analysis, and critical independent perspectives. The research approach is intended to provide a balanced view of global markets and to assist stakeholders in making educated decisions to achieve their most ambitious growth objectives.
Key Market Dynamics
High-voltage power systems require specialized insulators capable of withstanding extreme electrical stresses and environmental conditions. Industrial insulators play a crucial role in these systems by providing reliable insulation and supporting the conductors while preventing electrical leakage or flashovers. They ensure the safe and uninterrupted flow of electricity from generation sources to end-users. Insulators used in high-voltage applications are designed and manufactured to meet stringent performance requirements. They must possess exceptional dielectric strength, mechanical robustness, and resistance to environmental factors such as pollution, moisture, and extreme temperatures. These insulators are typically made from high-quality materials such as porcelain, glass, or composite polymers, which offer superior insulating properties and durability. All these factors are expected to drive the demand for the industrial insulators market during the forecast period.
However, industrial insulators are subjected to a wide range of operating conditions, such as high voltages, extreme temperatures, pollution, and harsh environmental factors. Selecting the appropriate material and designing insulators that can withstand these challenging conditions is a complex process that requires extensive research, testing, and expertise. In addition, insulators must be resistant to environmental factors such as pollution, moisture, and ultraviolet radiation, which degrade their performance over time. Failure to account for these factors can lead to premature insulator failure, posing safety risks and causing costly power outages. All these factors are expected to hamper the industrial insulators market growth.
The power industry is constantly striving to enhance the efficiency, reliability, and safety of electrical systems, and insulators play a critical role in achieving these goals. Advances in manufacturing techniques, such as 3D printing and additive manufacturing, have opened new possibilities for customized insulator designs. These techniques allow for the creation of complex geometries and intricate patterns that improve electric field distribution, heat dissipation, and mechanical properties, leading to enhanced insulator performance. All these factors are anticipated to offer new growth opportunities for the industrial insulators market during the forecast period.
Patent Analysis for Industrial Insulators Market
The U.S. collectively hold more than half of the total industrial insulator patents that indicate strong innovation and investment in this technology in U.S. countries. This suggests fierce competition and a significant focus on industrial insulator R&D in these leading economies. U.S. has the highest patent filed those accounts for 53.35% of the total global patents related to the industrial insulator market. Europe and PCT, although holding smaller percentages of industrial insulator patents individually, collectively contribute to the overall Asian dominance in industrial insulator innovation.This reflects the region's strong presence in materials science and engineering R&D. Recent patent filings in the industrial insulator market span a spectrum of innovations, such as advanced compositions of materials, novel production methods for industrial insulator components, sintered compositions for enhanced performance, and innovative compositions for industrial insulators.

Technological Trend Analysis:
Composite Materials: Traditional insulators made from porcelain or glass have limitations in terms of weight, size, and mechanical strength. The advent of composite materials, such as silicone rubber, has revolutionized insulator design. These materials offer superior electrical and mechanical properties such as high resistance to tracking and erosion, lightweight construction, and resistance to harsh environmental conditions.
Nanotechnology: The integration of nanotechnology has further enhanced the performance of insulators. Nano-coatings applied to insulator surfaces provide improved hydrophobicity, reducing the accumulation of contaminants and enhancing performance under polluted conditions. In addition, nanocomposite materials offer increased strength and durability, extending the service life of insulators in demanding applications.
IoT Integration: The rise of the Internet of Things (IoT) has brought about a new era of smart infrastructure. Insulators equipped with sensors and monitoring systems enable real-time condition monitoring, allowing for predictive maintenance and enhanced reliability. By continuously monitoring parameters such as temperature, humidity, and leakage current, potential issues can be detected and addressed proactively, minimizing downtime and reducing maintenance costs.
Modular Design: The shift towards modular design concepts has simplified installation and maintenance processes for GIS insulators. Modular insulator assemblies allow for easier handling and replacement of individual components, reducing downtime during maintenance activities. In addition, modular designs facilitate scalability, enabling systems to be easily expanded or upgraded to meet changing requirements.
Market Segmentation
The industrial insulators market is segmented by type, material type, application, and region. Based on type, the market is classified into pin insulators, spool/shackle insulators, suspension insulators, and others. By material type, the market is classified into porcelain or ceramic, glass, composite and others. By application, the market is divided into transformers, cables, switchgear, busbar, surge protection devices and others. Region-wise, the market is analyzed across North America, Europe, Asia-Pacific, and LAMEA.
Regional Market Outlook
China is the largest industrial and manufacturing hub globally, has a massive and growing demand for energy. The China government's focus on upgrading its aging power infrastructure, and renewable energy sources is creating a substantial market for advanced industrial insulators. These insulators are crucial for ensuring the reliability and efficiency of high-voltage transmission lines and substations. India expanding economy and its ambitious plans to electrify rural areas and enhance its urban power infrastructure are boosting the demand for high-quality insulators.
In the Union Budget 2023-24, the government allocated $0.885 billion for the solar power sector such as grid, off-grid, and PM-KUSUM projects. The government also announced the issuance of sovereign green bonds, as well as conferring infrastructure status to energy storage systems.
Competitive Landscape
The major players operating in the industrial insulators market include Hitachi Energy Ltd., Hubbell Power Systems, Reliserv Solution, TOSHIBA ELECTRONIC DEVICES & STORAGE CORPORATION, LAPP Insulators GmbH, Huntsman International LLC, Adpro Pvt. Ltd., Modern Insulators Ltd., Siemens Energy, Prime Plus, Incap, and Others.
Industry Trends:
According to the Ministry of Power, India significantly expanded its power sector during 2020-2021 by adding approximately 137, 000 circuit kilometers of transmission lines and 220, 000 megavolt-amperes (MVA) of substation capacity. This substantial growth underscores the increasing demand for electric insulators to support the country's expanding power infrastructure.
As per the National Infrastructure Pipeline 2019-25, energy sector projects accounted for the highest share (24%) out of the total expected capital expenditure of $1400 billion. Total FDI inflow in the power sector reached $16.58 billion between April 2000-March 2023.
Key Sources Referred
National Insulation Association
Invest India
International Renewable Energy Agency (IREA)
India brand Equity foundation (IBEF)
Indian Electrical and Electronic Manufacturer Association
International Association of Heat and Frost Insulators and Allied Workers
Key Benefits For Stakeholders
Industrial insulators market report provides a quantitative analysis of the market segments, current trends, estimations, and dynamics of the industrial insulators market analysis from 2024 to 2033 to identify the prevailing industrial insulators market opportunities.
The market research is offered along with information related to industrial insulators market overview, key drivers, restraints, and opportunities.
Porter's five forces analysis highlights the potency of buyers and suppliers to enable stakeholders make profit-oriented business decisions and strengthen their supplier-buyer network.
In-depth analysis of the industrial insulators market share and segmentation assists to determine the prevailing market opportunities.
Major countries in each region are mapped according to their revenue contribution to the global market.
Market player positioning facilitates benchmarking and provides a clear understanding of the present position of the market players.
The report includes the analysis of the regional as well as global industrial insulators market trends, key players, market segments, application areas, and market growth strategies.
Industrial Insulators Market Report Highlights
| Aspects | Details |
| Market Size By 2033 | USD 8.0 Billion |
| Growth Rate | CAGR of 5.3% |
| Forecast period | 2024 - 2033 |
| Report Pages | 340 |
| By Type |
|
| By Material Type |
|
| By Application |
|
| By Region |
|
| Key Market Players | LAPP Insulators GmbH, prime plus, Adpro Pvt. Ltd, Hubbell Power Systems, Siemens Energy, Incap, TOSHIBA ELECTRONIC DEVICES & STORAGE CORPORATION., Modern Insulators Ltd., Reliserv Solution, Huntsman International LLC, Hitachi Energy Ltd. |
Loading Table Of Content...

