
Inland Vessel Market Statistics 2021-2030:
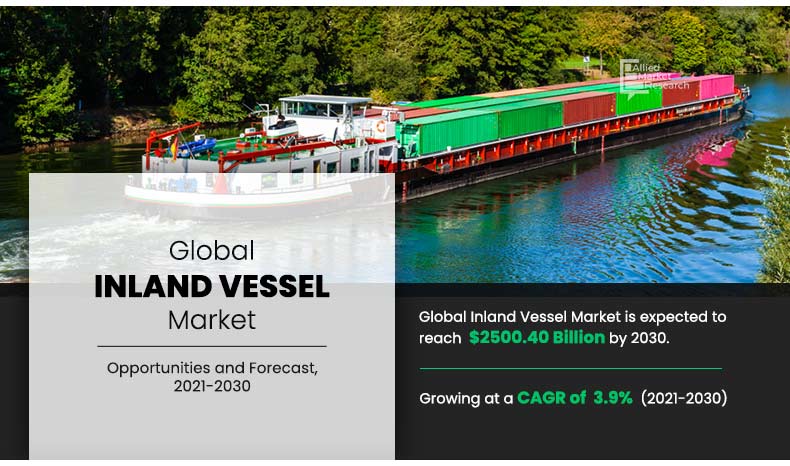
The global inland vessel market was valued at $1,698.24 billion in 2020, and is projected to reach $2,500.40 billion by 2030, registering a CAGR of 3.9% from 2021 to 2030.
Inland vessels are mechanically propelled vessels that float over water and are propelled through mechanical drives installed within the vessel. Inland vessels are designed in such a way that they can transport passengers as well as cargo from one place to another. Inland vessels are designed in such a way that they can operate in waters of a particular country unlike seas and ocean that is classified as international waters. Inland waterway vessels offer an excellent mode of transporting goods since they have higher loading capacity than road vehicles. Besides, inland waterways vessels also serve to bring down traffic on roads. Industry players are continuously investing in R&D to increase efficiency of inland waterways vessels and improve the safety significantly.
Factors such as increase in demand for cargo transportation through ships, rise in trade-related agreements, and technological advancements in boats & boat engines supplements growth of the global inland vessel market. However, factors such as fluctuations in transportation & inventory costs and environmental concerns associated with recreational boating hampers growth of the market during the forecast period. Moreover, factors such as anticipated trend of automation in marine transportation and increase in marine safety norms are the factors that are expected to create positive impact on growth of global inland vessel market during the forecast period.
The global inland vessel market is segmented on the basis of vessel type, fuel type, application, and region. By vessel type, the global market has been segmented into passenger vessel and non-passenger vessel. By fuel type, it is segmented into LNG, diesel oil, heavy fuel oil, and others. By application, it is segmented into oil tankers, bulk carriers, general cargo ships, container ships, and others. Region wise, the global market is segmented into North America, Europe, Asia-Pacific, and LAMEA.
The key players profiled in the global inland vessel market includes companies such as Alnmaritec Ltd., Groupe Beneteau, CMA CGM Group, Damen Shipyards Group, EURO-RIJN B.V., Hodder Tugboat Co. Ltd., DSME, Viking Shipping, SANMAR, and Windcat Workboats BV.
Increase in demand for cargo transportation through ships
Rise has been witnessed in demand for transportation of cargo through waterways. This is attributed to the fact that a number of cargos are efficiently transferred to other end through ships along with ensuring security of the cargo. Moreover, cargo ships are less expensive for shipping goods as compared to roads and air transits, as through ships large volume of cargo can be transported from one place to another as compared to other transportation means. As per the records of the United Nations Conference on Trade and Development (UNCTAD), which deals with trade, development, and investment issues across the globe, approximately 1,687 million tons of cargo are transported every year in around 177.6 million containers covering 998 billion ton-miles. Recent developments in commercial vessels and innovations by giant players for better and efficient cargo ships equipped with latest technology such as advanced sensors and navigation systems are anticipated to boost demand for cargo transportation through ships. This eventually is leading to growth of the inland vessels market across the globe.
By Vessel Type
Non-Passenger Vessel is projected as the most lucrative segments
Rise in trade-related agreements
Numerous trade-related agreements have been carried out between developed and developing nations to transport goods. Thus, suppliers have shifted their preference toward waterways as a better and efficient means of transportation. This increased inclination has led cargo vessel manufacturers to develop better and efficient container carriers of different sizes and capacities, which has fueled the growth of the global market. In addition, free trade agreements has enabled a reduction in duties and taxes.
Furthermore, increase has been witnessed in trade activities as exporters and importers need not pay taxes to the government. Countries in trade blocs are lifting bans and making trade more flexible. Hence, rise in trade-related agreements leads to increase in demand for stronger containers, thereby supplementing growth of the global inland vessel market.
By Fuel Type
LNG is projected as the most lucrative segments
Fluctuations in transportation and inventory costs
Carrying goods from one place to another requires a suitable mode of transportation, which means there should be an efficient usage of the medium. The cost incurred in transportation and holding inventory is another important factor that has a deepening impact on logistics. Price is the most significant factor that affects overall logistics services from the first function till the goods are delivered. This continuous fluctuation in transportation and inventory cost of materials has affected the shipping industry by enabling customers to opt different methods to transport goods, which eventually restrains growth of the global shipping containers market.
By Application
Business Class is projected as the most lucrative segments
Trend of automation in marine transportation
Rise in trend of automation and demonstration of autonomous ships by giants have enabled numerous companies to contribute toward the development of advanced and autonomous ships to be used in passenger and cargo transportation, which eventually leads to growth of the shipping industry. For instance, Rolls Royce and Finland-based ferry operator, Finferries demonstrated world’s first fully autonomous ferry.
In addition, Norwegian built Yara Birkeland is a fully autonomous container ship, which is intended to carry containers, and is expected to start operating by 2020. In addition, Norway-based Kongsberg partnered with Yara to develop all electric vessels by 2020. Similar developments carried across the globe by different companies increase the safety and security of the goods as well as the passengers on-board by reducing the human errors. Hence, the anticipated trend of automation in marine transportation is expected to provide potential opportunities to the shipping container industry.
By Region
LAMEA would exhibit the highest CAGR of 6.5% during 2021-2030.
Covid-19 Impact Analysis
- The COVID-19 pandemic outbreak has caused widespread economic downturn as several countries imposed strict lockdowns to contain the infection.
- This has affected diverse industries; manufacturing is one of the severely impacted sectors. For instance, a major player, Princess Yachts, reported that sales were 50% lower in April 2020 than in April 2019.
- There has been significant impact on supply chains globally. Boats and engine manufacturing companies have faced huge losses during the first & second quarter of 2020, owing to disrupted supply chains and production schedules.
- Rapid spread of COVID-19 in the U.S., Europe, and Asia resulted in nationwide lockdowns and temporary halt of production facilities to prevent further spread.
- The North America boating market suffered a slight dip in the first quarter of 2020, owing to sudden outbreak of the pandemic. However, the market started gaining traction soon during the second quarter of 2020, and outboard-powered boats started witnessing a spike in demand for recreational purposes.
Key Benefits For Stakeholders
- This study presents analytical depiction of the global Inland Vessel market analysis along with current trends and future estimations to depict imminent investment pockets.
- The overall inland vessel market opportunity is determined by understanding profitable trends to gain a stronger foothold.
- The report presents information related to the key drivers, restraints, and opportunities of the global Inland Vessel market with a detailed impact analysis.
- The current Inland Vessel market is quantitatively analyzed from 2020 to 2030 to benchmark the financial competency.
- Porter’s five forces analysis illustrates the potency of the buyers and suppliers in the industry.
Key Market Segments
By Vessel Type
- Passenger Vessel
- Non-Passenger Vessel
By Fuel Type
- LNG
- Diesel Oil
- Heavy Fuel Oil
- Others
By Application
- Oil Tankers
- Bulk Carriers
- General Cargo Ships
- Container Ships
- Others
By Region
- North America
- U.S.
- Canada
- Mexico
- Europe
- UK
- Germany
- Greece
- Russia
- Norway
- Rest of Europe
- Asia-Pacific
- China
- Japan
- Singapore
- South Korea
- Rest of Asia-Pacific
- LAMEA
- Latin America
- Middle East
- Africa
Key Players
- Alnmaritec Ltd.
- Groupe Beneteau
- CMA CGM Group
- Damen Shipyards Group
- EURO-RIJN B.V.
- Hodder Tugboat Co. Ltd.
- DSME
- Viking Shipping
- SANMAR
- Windcat Workboats BV
Inland Vessel Market Report Highlights
| Aspects | Details |
| By Vessel Type |
|
| By Fuel Type |
|
| By Application |
|
| By Region |
|
| Key Market Players | Windcat Workboats BV, SANMAR, EURO-RIJN B.V., DSME, Alnmaritec Ltd., Groupe Beneteau, Damen Shipyards Group, CMA CGM Group, Viking Shipping, Hodder Tugboat Co. Ltd. |
Analyst Review
Inland vessel market is supplemented by numerous developments carried out by top inland vessel manufacturers, which has led to growth of the market. Moreover, continuous product development followed by increased trade agreements carried out between countries, which supplements growth of the global inland vessel market.
For instance, in November 2019, Alnmaritec Ltd, developed & delivered first in class Wave Handler 1100 vessel, which is designed to support the FPSO Egina in Nigeria. Similarly, in April 2021, Damen Shipyards Group has launched Star Tug 1004 to ‘Corps van Vletterlieden’ for operations on port of Ijmuiden situated in the north of the Netherlands. Such developments and product launch supplements growth of the market.
Factors such as increase in demand for cargo transportation through ships, rise in trade-related agreements, and technological advancements in boats & boat engines supplements growth of the global inland vessel market. However, factors such as fluctuations in transportation & inventory costs and environmental concerns associated with recreational boating hampers growth of the market. Moreover, factors such as trend of automation in marine transportation and increase in marine safety norms are the factors that are expected to create positive impact on growth of the global inland vessel market during the forecast period.
Among the analyzed regions, Asia-Pacific is the highest revenue contributor, followed by Europe, North America and LAMEA. On the basis of forecast analysis, LAMEA is expected to maintain its lead during the forecast period, owing to increased demand for advanced transportation vessels across the region.
The global inland vessel market was valued at $1,698.24 billion in 2020, and is projected to reach $2,500.40 billion by 2030, registering a CAGR of 3.9% from 2021 to 2030
Introduction of electric & autonomous ships is the upcoming trends in inland vessels industry
The sample for global inland vessels market report can be obtained on demand from the AMR website. Also, the 24*7 chat support and direct call services are provided to procure the sample report.
The global inland vessel market was valued at $1,698.24 billion in 2020, and is projected to reach $2,500.40 billion by 2030, registering a CAGR of 3.9% from 2021 to 2030
The global inland vessels market is expected tom grow at a CAGR of 3.9% from 2021-2030
The company profiles of the top market players of inland vessel market can be obtained from the company profile section mentioned in the report. This section includes analysis of top ten player’s operating in the inland vessel market.
The company profiles of the top market players of inland vessel market can be obtained from the company profile section mentioned in the report. This section includes analysis of top ten player’s operating in the inland vessel market.
Increased trading activities between the countries followed by the introduction of waterways transportation is the outlook in inland vessels
Numerous companies are operating in the inland vessels market. The same can be obtained on demand from the AMR website.
Asia-Pacific & Europe are the key matured markets in the global inland vessels market.
Continuous product development followed by the introduction of advanced inland vessels are the known and unknown adjacencies impacting the inland vessels market.
Loading Table Of Content...

