Report Code: A10491 | Sep 2021 | Pages: 336 | ||
Tables: 156 | Charts: 79 |
|
Pandemic disrupted the entire world and affected many industries.
Get detailed COVID-19 impact analysis on the Instrument Transformers Market
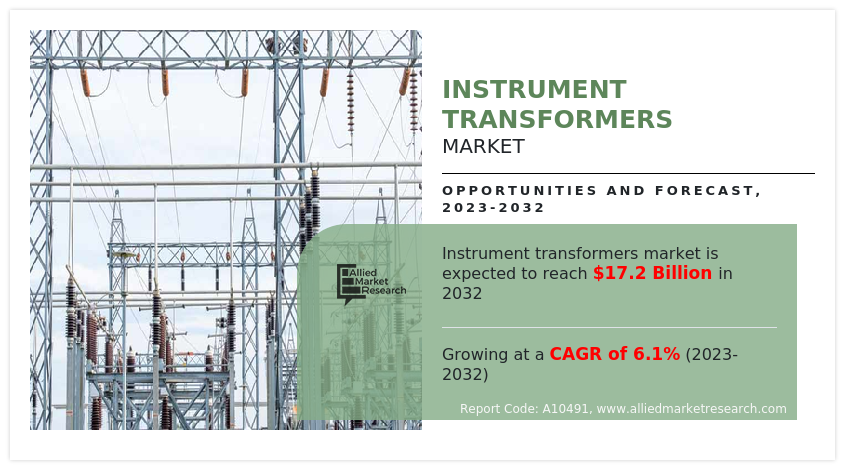
Request Now !The global instrument transformers market was valued at $7.0 billion in 2020, and is projected to reach $13.0 billion by 2030, growing at a CAGR of 6.5% from 2021 to 2030. Instrument transformers are electrical appliances that are used to alter or isolate current or voltage levels with very high accuracy. They are used in AC (alternate current) systems for measurement of electrical parameters such as current, voltage, energy, power factor, and frequency. Primary function of instrument transformer is to lower than current and voltage of AC systems. Measuring instruments generally have low measuring quantities, about 5A to 110A; however, with use of instrument transformers, measurement of large electrical quantities becomes possible by coupling instrument transformers with general electrical measuring devices. An instrument transformer is capable of withstanding high levels of stress in all climatic conditions.
COVID-19 pandemic outbreak across the globe has halted the industrial manufacturing activities amid government imposed lock down measures owing to which the demand for electricity has been declined significantly thereby restraining the demand of instrument transformers. This is expected to hamper the growth of instrument transformers market in coming years.
The global demand for instrument transformers market is primarily driven by rise in alternative energy programs, refurbishment of aging power infrastructure, and huge investments in smart grids and energy systems. Rise in need for electricity, coupled with increasing concerns pertaining to grid stability boosts the global market. Growth in interest toward rural electrification in line with renovation of existing grid network, owing a favor toward authorities to incorporate an efficient protection and monitoring mechanism. Thus, increase in grid complexities across electric infrastructure in conjunction with emerging peak electricity demand from end-users propel the global instrument transformers market growth.
However, increase in competition from unorganized sectors of the instrument transformer market is expected to hamper growth of the market during the forecast period. Furthermore, rise in investments in transmission & distribution infrastructure is expected to provide growth opportunities for the instrument transformers market during the forecast period.
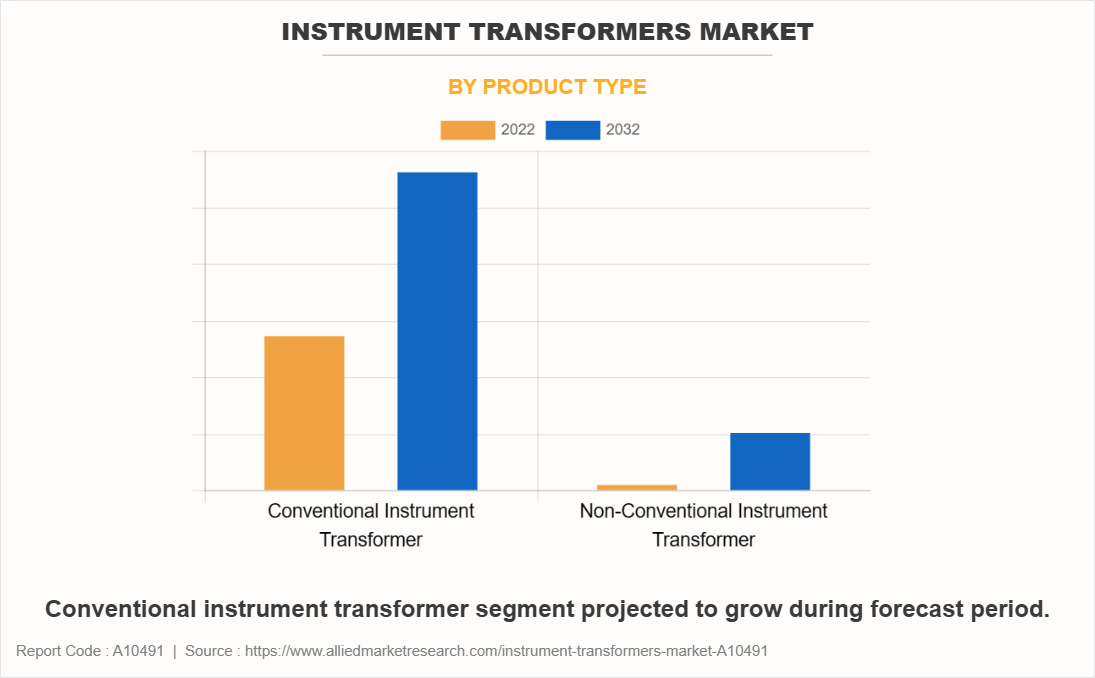
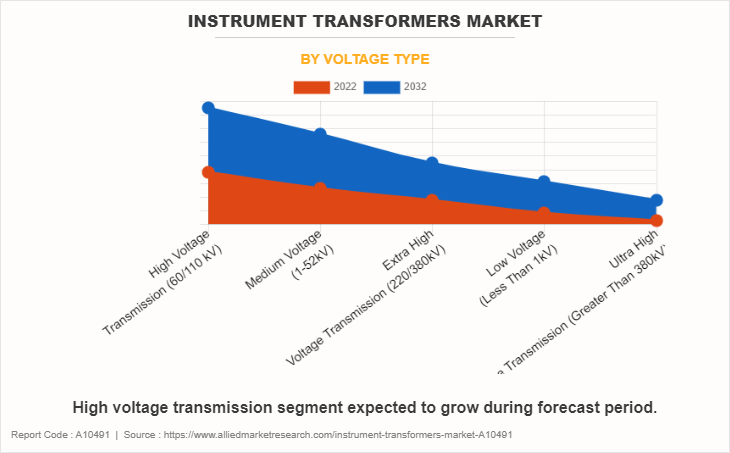
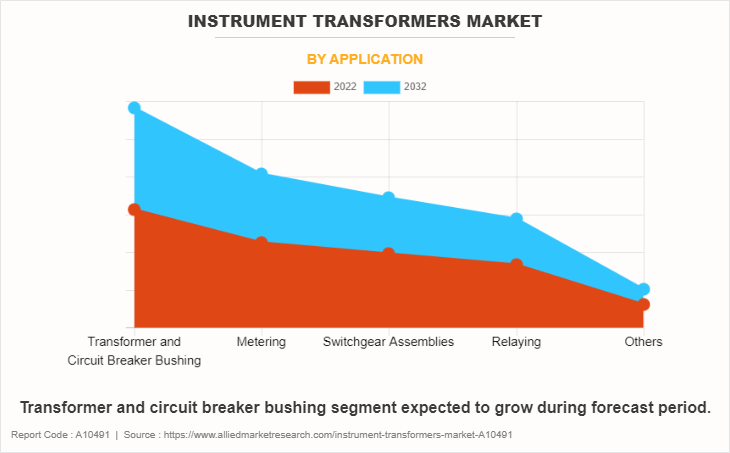
The global instrument transformers market size is segmented on the basis of type, voltage, application, end-user, and region. By type, it is analyzed across current transformers, potential transformers, and combined instrument transformers. By voltage, it is segmented into distribution voltage, sub-transmission voltage, high voltage transmission, extra high voltage transmission, and ultra-high voltage transmission. By application, it is divided into transformer and circuit breaker bushing, switchgear assemblies, relaying, and metering and protection. By end-user, it is segmented into power utilities, power generation, railways and metros, industries and OEMs. Region-wise, it is studied across North America, Europe, Asia-Pacific, and LAMEA.
The major key players operating in the global instrument transformers industry include ABB, General Electric, Schneider Electric, Siemens, CG Power and Industrial Solutions Ltd, Mitsubishi Electric Corporation, Instrument Transformer Equipment Corporation, Arteche, Nissin Electric, and Bharat Heavy Electrical Limited. Other players operating in this market include Raychem RPG Private Limited, Mehru, and Celme S.r.l.
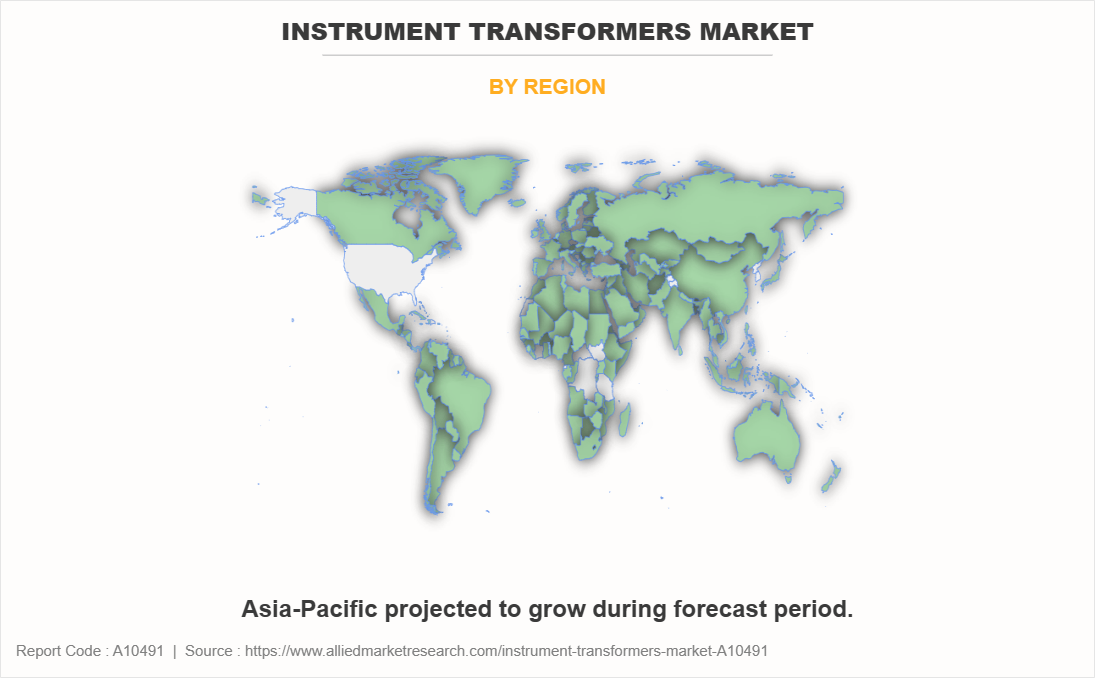
Asia-Pacific accounted for a major market share in 2020, owing to increased power consumption, government initiatives to increase power generation capacity using renewable energy sources, and replacement of aging power plants are expected to drive the market in the region.
The current transformers segment accounted for a major share in the instrument transformers market in 2020. Current transformers are used to measure current in the electrical circuit with a magnitude of more than 5A. These are regarded as transformers that operate under short circuit condition and carries full rated current of electrical network on primary side. The devices connected to the secondary side of current transformers are series-connected. Secondary side of current transformers has several secondary windings with mechanical cores of identical or different characteristics. A current transformer can have two measuring cores of different accuracy classes on its secondary side or can be designed with an identical accuracy class measuring and protection cores. Design of this equipment is purely based on type of application required in the electrical circuit. Most current transformers connected to medium voltage electrical networks are three-phase, while single-phase current transformers are used for high voltage applications.
The high voltage transmission segment accounted for a major share in the instrument transformers market in 2020 as instrument transformers offers electrical protection against overload currents, insulation failure, and emergency switching for residential and commercial infrastructure.
The metering & protection segment accounted for a major share in the instrument transformers market in 2020, owing to growth in investments in renewable power generation, electrification of transport systems, and expansion of electrical transmission and distribution systems boost demand for metering & protection applications.
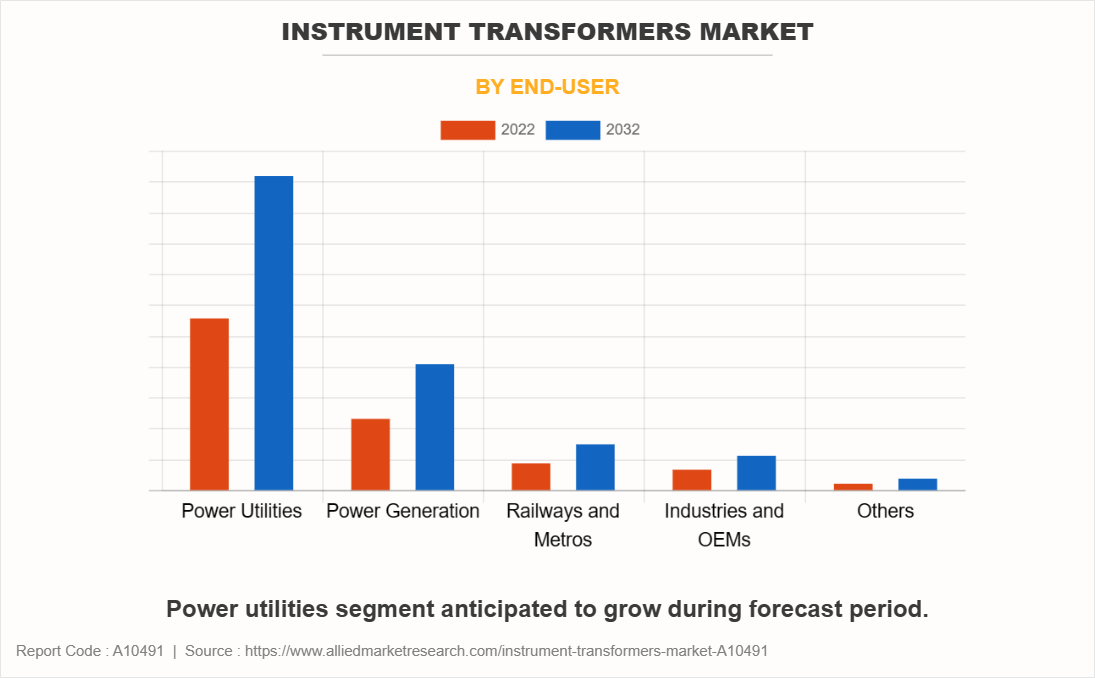
The power utilities segment accounted for a major instrument transformers market share in 2020. Power utilities take care of maintenance, operation, and installation of grid infrastructure, coupled with realization of consumed electricity and energy efficiency projects. This fuels demand for the power utilities segment.
Governments of various countries have restricted movement of goods & individuals and halted operations of production facilities as part of measures to limit the spread of the COVID-19 pandemic. This has hampered consumption of electricity across the world. For instance, according to the short-term outlook of the U.S. Energy Information Administration (EIA), electricity consumption in the U.S. is expected to decrease by a record 4.6% by the end of 2020, as businesses have shut down temporarily, owing to government lockdowns to reduce spread of the coronavirus. Hence, this demand and production of instrument transformers across the globe is expected to decline.
Key benefits for stakeholders
Key market segments
By Type
By Voltage
By Application
By End-User
By Region
Instrument Transformers Market Report Highlights
Aspects | Details |
---|---|
By Type |
|
By Voltage |
|
By Application |
|
By End-User |
|
By Region |
|
Key Market Players | ABB LTD, INSTRUMENT TRANSFORMER EQUIPMENT CORPORATION, SCHNEIDER ELECTRIC, GENERAL ELECTRIC, CG POWER AND INDUSTRIAL SOLUTIONS LTD., MITSUBISHI ELECTRIC CORPORATION, BHARAT HEAVY ELECTRICAL LIMITED, ARTECHE GROUP, SIEMENS AG, NISSIN ELECTRIC CO., LTD. |
CHAPTER 1:INTRODUCTION
1.1.Report description
1.2.Key benefits for stakeholders
1.3.Key market segments
1.4.Research methodology
1.4.1.Secondary research
1.4.2.Primary research
1.5.Analyst tools and models
CHAPTER 2:EXECUTIVE SUMMARY
2.1.Key findings of the study
2.2.CXO perspective
CHAPTER 3:MARKET OVERVIEW
3.1.Market definition and scope
3.2.Key findings
3.2.1.Top investment pockets
3.3.Porter’s five forces analysis
3.4.Patent analysis
3.5.Market dynamics
3.5.1.Drivers
3.5.1.1.Refurbishment of aging power infrastructure
3.5.1.2.Huge investments in smart grids and energy systems
3.5.2.Restraint
3.5.2.1.Increase in competition from the unorganized sector
3.5.3.Opportunities
3.5.3.1.Increase in investments in transmission & distribution infrastructure
3.5.3.2.Adoption of HVDC technology for long distance transmission
3.6.Parent market overview
3.7.Impact of COVID-19 on the global instrument transformers market
CHAPTER 4:INSTRUMENT TRANSFORMERS MARKET, BY TYPE
4.1.Overview
4.1.1.Market size and forecast
4.2.Current transformer
4.2.1.Key market trends, growth factors, and opportunities
4.2.2.Market size and forecast, by region
4.2.3.Market share analysis, by country
4.3.Potential transformer
4.3.1.Key market trends, growth factors, and opportunities
4.3.2.Market size and forecast, by region
4.3.3.Market share analysis, by country
4.4.Combined instrument transformer
4.4.1.Key market trends, growth factors, and opportunities
4.4.2.Market size and forecast, by region
4.4.3.Market share analysis, by country
CHAPTER 5:INSTRUMENT TRANSFORMERS MARKET, BY VOLTAGE
5.1.Overview
5.1.1.Market size and forecast
5.2.Distribution voltage
5.2.1.Key market trends, growth factors, and opportunities
5.2.2.Market size and forecast, by region
5.2.3.Market share analysis, by country
5.3.Sub-transmission voltage
5.3.1.Key market trends, growth factors, and opportunities
5.3.2.Market size and forecast, by region
5.3.3.Market share analysis, by country
5.4.High voltage transmission
5.4.1.Key market trends, growth factors, and opportunities
5.4.2.Market size and forecast, by region
5.4.3.Market share analysis, by country
5.5.Extra-high voltage transmission
5.5.1.Key market trends, growth factors, and opportunities
5.5.2.Market size and forecast, by region
5.5.3.Market share analysis, by country
5.6.Ultra-high voltage transmission
5.6.1.Key market trends, growth factors, and opportunities
5.6.2.Market size and forecast, by region
5.6.3.Market share analysis, by country
CHAPTER 6:INSTRUMENT TRANSFORMERS MARKET, BY APPLICATION
6.1.Overview
6.1.1.Market size and forecast
6.2.Transformer & circuit breaker bushing
6.2.1.Key market trends, growth factors, and opportunities
6.2.2.Market size and forecast, by region
6.2.3.Market share analysis, by country
6.3.Switchgear assemblies
6.3.1.Key market trends, growth factors, and opportunities
6.3.2.Market size and forecast, by region
6.3.3.Market share analysis, by country
6.4.Relaying
6.4.1.Key market trends, growth factors, and opportunities
6.4.2.Market size and forecast, by region
6.4.3.Market share analysis, by country
6.5.Metering & protection
6.5.1.Key market trends, growth factors, and opportunities
6.5.2.Market size and forecast, by region
6.5.3.Market share analysis, by country
CHAPTER 7:INSTRUMENT TRANSFORMERS MARKET, BY END USER
7.1.Overview
7.1.1.Market size and forecast
7.2.Power utilities
7.2.1.Key market trends, growth factors, and opportunities
7.2.2.Market size and forecast, by region
7.2.3.Market share analysis, by country
7.3.Power generation
7.3.1.Key market trends, growth factors, and opportunities
7.3.2.Market size and forecast, by region
7.3.3.Market share analysis, by country
7.4.Railways & metros
7.4.1.Key market trends, growth factors, and opportunities
7.4.2.Market size and forecast, by region
7.4.3.Market share analysis, by country
7.5.Industries & OEMs
7.5.1.Key market trends, growth factors, and opportunities
7.5.2.Market size and forecast, by region
7.5.3.Market share analysis, by country
CHAPTER 8:INSTRUMENT TRANSFORMERS MARKET, BY REGION
8.1.Overview
8.1.1.Market size and forecast
8.2.North America
8.2.1.Key market trends, growth factors, and opportunities
8.2.2.Market size and forecast, by type
8.2.3.Market size and forecast, by voltage
8.2.4.Market size and forecast, by application
8.2.5.Market size and forecast, by end user
8.2.6.Market size and forecast, by country
8.2.6.1.U.S.
8.2.6.1.1.Market size and forecast, by type
8.2.6.1.2.Market size and forecast, by voltage
8.2.6.1.3.Market size and forecast, by application
8.2.6.1.4.Market size and forecast, by end user
8.2.6.2.Canada
8.2.6.2.1.Market size and forecast, by type
8.2.6.2.2.Market size and forecast, by voltage
8.2.6.2.3.Market size and forecast, by application
8.2.6.2.4.Market size and forecast, by end user
8.2.6.3.Mexico
8.2.6.3.1.Market size and forecast, by type
8.2.6.3.2.Market size and forecast, by voltage
8.2.6.3.3.Market size and forecast, by application
8.2.6.3.4.Market size and forecast, by end user
8.3.Europe
8.3.1.Key market trends, growth factors, and opportunities
8.3.2.Market size and forecast, by type
8.3.3.Market size and forecast, by voltage
8.3.4.Market size and forecast, by application
8.3.5.Market size and forecast, by end user
8.3.6.Market size and forecast, by country
8.3.6.1.Germany
8.3.6.1.1.Market size and forecast, by type
8.3.6.1.2.Market size and forecast, by voltage
8.3.6.1.3.Market size and forecast, by application
8.3.6.1.4.Market size and forecast, by end user
8.3.6.2.France
8.3.6.2.1.Market size and forecast, by type
8.3.6.2.2.Market size and forecast, by voltage
8.3.6.2.3.Market size and forecast, by application
8.3.6.2.4.Market size and forecast, by end user
8.3.6.3.Italy
8.3.6.3.1.Market size and forecast, by type
8.3.6.3.2.Market size and forecast, by voltage
8.3.6.3.3.Market size and forecast, by application
8.3.6.3.4.Market size and forecast, by end user
8.3.6.4.Russia
8.3.6.4.1.Market size and forecast, by type
8.3.6.4.2.Market size and forecast, by voltage
8.3.6.4.3.Market size and forecast, by application
8.3.6.4.4.Market size and forecast, by end user
8.3.6.5.UK
8.3.6.5.1.Market size and forecast, by type
8.3.6.5.2.Market size and forecast, by voltage
8.3.6.5.3.Market size and forecast, by application
8.3.6.5.4.Market size and forecast, by end user
8.3.6.6.Rest of Europe
8.3.6.6.1.Market size and forecast, by type
8.3.6.6.2.Market size and forecast, by voltage
8.3.6.6.3.Market size and forecast, by application
8.3.6.6.4.Market size and forecast, by end user
8.4.Asia-Pacific
8.4.1.Key market trends, growth factors, and opportunities
8.4.2.Market size and forecast, by type
8.4.3.Market size and forecast, by voltage
8.4.4.Market size and forecast, by application
8.4.5.Market size and forecast, by end user
8.4.6.Market size and forecast, by country
8.4.6.1.China
8.4.6.1.1.Market size and forecast, by type
8.4.6.1.2.Market size and forecast, by voltage
8.4.6.1.3.Market size and forecast, by application
8.4.6.1.4.Market size and forecast, by end user
8.4.6.2.Japan
8.4.6.2.1.Market size and forecast, by type
8.4.6.2.2.Market size and forecast, by voltage
8.4.6.2.3.Market size and forecast, by application
8.4.6.2.4.Market size and forecast, by end user
8.4.6.3.South Korea
8.4.6.3.1.Market size and forecast, by type
8.4.6.3.2.Market size and forecast, by voltage
8.4.6.3.3.Market size and forecast, by application
8.4.6.3.4.Market size and forecast, by end user
8.4.6.4.India
8.4.6.4.1.Market size and forecast, by type
8.4.6.4.2.Market size and forecast, by voltage
8.4.6.4.3.Market size and forecast, by application
8.4.6.4.4.Market size and forecast, by end user
8.4.6.5.Australia
8.4.6.5.1.Market size and forecast, by type
8.4.6.5.2.Market size and forecast, by voltage
8.4.6.5.3.Market size and forecast, by application
8.4.6.5.4.Market size and forecast, by end user
8.4.6.6.Rest of Asia-Pacific
8.4.6.6.1.Market size and forecast, by type
8.4.6.6.2.Market size and forecast, by voltage
8.4.6.6.3.Market size and forecast, by application
8.4.6.6.4.Market size and forecast, by end user
8.5.LAMEA
8.5.1.Key market trends, growth factors, and opportunities
8.5.2.Market size and forecast, by type
8.5.3.Market size and forecast, by voltage
8.5.4.Market size and forecast, by application
8.5.5.Market size and forecast, by end user
8.5.6.Market size and forecast, by country
8.5.6.1.Brazil
8.5.6.1.1.Market size and forecast, by type
8.5.6.1.2.Market size and forecast, by voltage
8.5.6.1.3.Market size and forecast, by application
8.5.6.1.4.Market size and forecast, by end user
8.5.6.2.Saudi Arabia
8.5.6.2.1.Market size and forecast, by type
8.5.6.2.2.Market size and forecast, by voltage
8.5.6.2.3.Market size and forecast, by application
8.5.6.2.4.Market size and forecast, by end user
8.5.6.3.South Africa
8.5.6.3.1.Market size and forecast, by type
8.5.6.3.2.Market size and forecast, by voltage
8.5.6.3.3.Market size and forecast, by application
8.5.6.3.4.Market size and forecast, by end user
8.5.6.4.Rest of LAMEA
8.5.6.4.1.Market size and forecast, by type
8.5.6.4.2.Market size and forecast, by voltage
8.5.6.4.3.Market size and forecast, by application
8.5.6.4.4.Market size and forecast, by end user
CHAPTER 9:COMPETITIVE LANDSCAPE
9.1.Introduction
9.1.1.Top player positioning, 2020
9.2.Product mapping of top 10 players
9.3.Competitive heatmap
9.4.Key developments
9.4.1.Contract
9.4.2.Agreement
CHAPTER 10:COMPANY PROFILES
10.1.ABB LTD.
10.1.1.Company overview
10.1.2.Company snapshot
10.1.3.Operating business segments
10.1.4.Product portfolio
10.1.5.Business performance
10.2.ARTECHE GROUP
10.2.1.Company overview
10.2.2.Company snapshot
10.2.3.Product portfolio
10.2.4.Business performance
10.3.BHARAT HEAVY ELECTRICAL LIMITED
10.3.1.Company overview
10.3.2.Company snapshot
10.3.3.Operating business segments
10.3.4.Product portfolio
10.3.5.Business performance
10.4.CG POWER AND INDUSTRIAL SOLUTIONS LTD.
10.4.1.Company overview
10.4.2.Company snapshot
10.4.3.Operating business segments
10.4.4.Product portfolio
10.4.5.Business performance
10.5.GENERAL ELECTRIC
10.5.1.Company overview
10.5.2.Company snapshot
10.5.3.Operating business segments
10.5.4.Product portfolio
10.5.5.Business performance
10.5.6.Key strategic moves and developments
10.6.INSTRUMENT TRANSFORMER EQUIPMENT CORPORATION
10.6.1.Company overview
10.6.2.Company snapshot
10.6.3.Product portfolio
10.7.MITSUBISHI ELECTRIC CORPORATION
10.7.1.Company overview
10.7.2.Company snapshot
10.7.3.Operating business segments
10.7.4.Product portfolio
10.7.5.Business performance
10.8.SCHNEIDER ELECTRIC
10.8.1.Company overview
10.8.2.Company snapshot
10.8.3.Operating business segments
10.8.4.Product portfolio
10.8.5.Business performance
10.9.SIEMENS AG
10.9.1.Company overview
10.9.2.Company snapshot
10.9.3.Operating business segments
10.9.4.Product portfolio
10.9.5.Business performance
10.9.6.Key strategic moves and developments
10.10.NISSIN ELECTRIC CO., LTD.
10.10.1.Company overview
10.10.2.Company snapshot
10.10.3.Operating business segments
10.10.4.Product portfolio
10.10.5.Business performance
LIST OF TABLES
TABLE 01.INSTRUMENT TRANSFORMERS MARKET, BY TYPE, 2020–2030 ($MILLION)
TABLE 02.INSTRUMENT TRANSFORMERS MARKET FOR CURRENT TRANSFORMER, BY REGION, 2020–2030 ($MILLION)
TABLE 03.INSTRUMENT TRANSFORMERS MARKET FOR POTENTIAL TRANSFORMER, BY REGION, 2020–2030 ($MILLION)
TABLE 04.INSTRUMENT TRANSFORMERS MARKET FOR COMBINED INSTRUMENT TRANSFORMER, BY REGION, 2020–2030 ($MILLION)
TABLE 05.INSTRUMENT TRANSFORMERS MARKET, BY VOLTAGE, 2020–2030 ($MILLION)
TABLE 06.INSTRUMENT TRANSFORMERS MARKET FOR DISTRIBUTION VOLTAGE, BY REGION, 2020–2030 ($MILLION)
TABLE 07.INSTRUMENT TRANSFORMERS MARKET FOR SUB-TRANSMISSION VOLTAGE, BY REGION, 2020–2030 ($MILLION)
TABLE 08.INSTRUMENT TRANSFORMERS MARKET FOR HIGH VOLTAGE TRANSMISSION, BY REGION, 2020–2030 ($MILLION)
TABLE 09.INSTRUMENT TRANSFORMERS MARKET FOR EXTRA-HIGH VOLTAGE TRANSMISSION, BY REGION, 2020–2030 ($MILLION)
TABLE 10.INSTRUMENT TRANSFORMERS MARKET FOR ULTRA-HIGH VOLTAGE TRANSMISSION, BY REGION, 2020–2030 ($MILLION)
TABLE 11.INSTRUMENT TRANSFORMERS MARKET, BY APPLICATION, 2020–2030 ($MILLION)
TABLE 12.INSTRUMENT TRANSFORMERS MARKET FOR TRANSFORMER & CIRCUIT BREAKER BUSHING, BY REGION, 2020–2030 ($MILLION)
TABLE 13.INSTRUMENT TRANSFORMERS MARKET FOR SWITCHGEAR ASSEMBLIES, BY REGION, 2020–2030 ($MILLION)
TABLE 14.INSTRUMENT TRANSFORMERS MARKET FOR RELAYING, BY REGION, 2020–2030 ($MILLION)
TABLE 15.INSTRUMENT TRANSFORMERS MARKET FOR METERING & PROTECTION, BY REGION, 2020–2030 ($MILLION)
TABLE 16.GLOBAL INSTRUMENT TRANSFORMERS MARKET, BY END USER, 2020-2030 ($MILLION)
TABLE 17.INSTRUMENT TRANSFORMERS MARKET FOR POWER UTILITIES, BY REGION, 2020–2030 ($MILLION)
TABLE 18.INSTRUMENT TRANSFORMERS MARKET FOR POWER GENERATION, BY REGION, 2020–2030 ($MILLION)
TABLE 19.INSTRUMENT TRANSFORMERS MARKET FOR RAILWAYS AND METROS, BY REGION, 2020–2030 ($MILLION)
TABLE 20.INSTRUMENT TRANSFORMERS MARKET FOR INDUSTRIES AND OEMS, BY REGION, 2020–2030 ($MILLION)
TABLE 21.INSTRUMENT TRANSFORMERS MARKET, BY REGION, 2020–2030 ($MILLION)
TABLE 22.NORTH AMERICA INSTRUMENT TRANSFORMERS MARKET, BY TYPE, 2020–2030 ($MILLION)
TABLE 23.NORTH AMERICA INSTRUMENT TRANSFORMERS MARKET, BY VOLTAGE, 2020–2030 ($MILLION)
TABLE 24.NORTH AMERICA INSTRUMENT TRANSFORMERS MARKET, BY APPLICATION, 2020–2030 ($MILLION)
TABLE 25.NORTH AMERICA INSTRUMENT TRANSFORMERS MARKET, BY END USER, 2020–2030 ($MILLION)
TABLE 26.NORTH AMERICA INSTRUMENT TRANSFORMERS MARKET, BY COUNTRY, 2020–2030 ($MILLION)
TABLE 27.U.S. INSTRUMENT TRANSFORMERS MARKET, BY TYPE, 2020–2030 ($MILLION)
TABLE 28.U.S. INSTRUMENT TRANSFORMERS MARKET, BY VOLTAGE, 2020–2030 ($MILLION)
TABLE 29.U.S. INSTRUMENT TRANSFORMERS MARKET, BY APPLICATION, 2020–2030 ($MILLION)
TABLE 30.U.S. INSTRUMENT TRANSFORMERS MARKET, BY END USER, 2020–2030 ($MILLION)
TABLE 31.CANADA INSTRUMENT TRANSFORMERS MARKET, BY TYPE, 2020–2030 ($MILLION)
TABLE 32.CANADA INSTRUMENT TRANSFORMERS MARKET, BY VOLTAGE, 2020–2030 ($MILLION)
TABLE 33.CANADA INSTRUMENT TRANSFORMERS MARKET, BY APPLICATION, 2020–2030 ($MILLION)
TABLE 34.CANADA INSTRUMENT TRANSFORMERS MARKET, BY END USER, 2020–2030 ($MILLION)
TABLE 35.MEXICO INSTRUMENT TRANSFORMERS MARKET, BY TYPE, 2020–2030 ($MILLION)
TABLE 36.MEXICO INSTRUMENT TRANSFORMERS MARKET, BY VOLTAGE, 2020–2030 ($MILLION)
TABLE 37.MEXICO INSTRUMENT TRANSFORMERS MARKET, BY APPLICATION, 2020–2030 ($MILLION)
TABLE 38.MEXICO INSTRUMENT TRANSFORMERS MARKET, BY END USER, 2020–2030 ($MILLION)
TABLE 39.EUROPE INSTRUMENT TRANSFORMERS MARKET, BY TYPE, 2020–2030 ($MILLION)
TABLE 40.EUROPE INSTRUMENT TRANSFORMERS MARKET, BY VOLTAGE, 2020–2030 ($MILLION)
TABLE 41.EUROPE INSTRUMENT TRANSFORMERS MARKET, BY APPLICATION, 2020–2030 ($MILLION)
TABLE 42.EUROPE INSTRUMENT TRANSFORMERS MARKET, BY END USER, 2020–2030 ($MILLION)
TABLE 43.EUROPE INSTRUMENT TRANSFORMERS MARKET, BY COUNTRY, 2020–2030 ($MILLION)
TABLE 44.GERMANY INSTRUMENT TRANSFORMERS MARKET, BY TYPE, 2020–2030 ($MILLION)
TABLE 45.GERMANY INSTRUMENT TRANSFORMERS MARKET, BY VOLTAGE, 2020–2030 ($MILLION)
TABLE 46.GERMANY INSTRUMENT TRANSFORMERS MARKET, BY APPLICATION, 2020–2030 ($MILLION)
TABLE 47.GERMANY INSTRUMENT TRANSFORMERS MARKET, BY END USER, 2020–2030 ($MILLION)
TABLE 48.FRANCE INSTRUMENT TRANSFORMERS MARKET, BY TYPE, 2020–2030 ($MILLION)
TABLE 49.FRANCE INSTRUMENT TRANSFORMERS MARKET, BY VOLTAGE, 2020–2030 ($MILLION)
TABLE 50.FRANCE INSTRUMENT TRANSFORMERS MARKET, BY APPLICATION, 2020–2030 ($MILLION)
TABLE 51.FRANCE INSTRUMENT TRANSFORMERS MARKET, BY END USER, 2020–2030 ($MILLION)
TABLE 52.ITALY INSTRUMENT TRANSFORMERS MARKET, BY TYPE, 2020–2030 ($MILLION)
TABLE 53.ITALY INSTRUMENT TRANSFORMERS MARKET, BY VOLTAGE, 2020–2030 ($MILLION)
TABLE 54.ITALY INSTRUMENT TRANSFORMERS MARKET, BY APPLICATION, 2020–2030 ($MILLION)
TABLE 55.ITALY INSTRUMENT TRANSFORMERS MARKET, BY END USER, 2020–2030 ($MILLION)
TABLE 56.RUSSIA INSTRUMENT TRANSFORMERS MARKET, BY TYPE, 2020–2030 ($MILLION)
TABLE 57.RUSSIA INSTRUMENT TRANSFORMERS MARKET, BY VOLTAGE, 2020–2030 ($MILLION)
TABLE 58.RUSSIA INSTRUMENT TRANSFORMERS MARKET, BY APPLICATION, 2020–2030 ($MILLION)
TABLE 59.RUSSIA INSTRUMENT TRANSFORMERS MARKET, BY END USER, 2020–2030 ($MILLION)
TABLE 60.UK INSTRUMENT TRANSFORMERS MARKET, BY TYPE, 2020–2030 ($MILLION)
TABLE 61.UK INSTRUMENT TRANSFORMERS MARKET, BY VOLTAGE, 2020–2030 ($MILLION)
TABLE 62.UK INSTRUMENT TRANSFORMERS MARKET, BY APPLICATION, 2020–2030 ($MILLION)
TABLE 63.UK INSTRUMENT TRANSFORMERS MARKET, BY END USER, 2020–2030 ($MILLION)
TABLE 64.REST OF EUROPE INSTRUMENT TRANSFORMERS MARKET, BY TYPE, 2020–2030 ($MILLION)
TABLE 65.REST OF EUROPE INSTRUMENT TRANSFORMERS MARKET, BY VOLTAGE, 2020–2030 ($MILLION)
TABLE 66.REST OF EUROPE INSTRUMENT TRANSFORMERS MARKET, BY APPLICATION, 2020–2030 ($MILLION)
TABLE 67.REST OF EUROPE INSTRUMENT TRANSFORMERS MARKET, BY END USER, 2020–2030 ($MILLION)
TABLE 68.ASIA-PACIFIC INSTRUMENT TRANSFORMERS MARKET, BY TYPE, 2020–2030 ($MILLION)
TABLE 69.ASIA-PACIFIC INSTRUMENT TRANSFORMERS MARKET, BY VOLTAGE, 2020–2030 ($MILLION)
TABLE 70.ASIA-PACIFIC INSTRUMENT TRANSFORMERS MARKET, BY APPLICATION, 2020–2030 ($MILLION)
TABLE 71.ASIA-PACIFIC INSTRUMENT TRANSFORMERS MARKET, BY END USER, 2020–2030 ($MILLION)
TABLE 72.ASIA-PACIFIC INSTRUMENT TRANSFORMERS MARKET, BY COUNTRY, 2020–2030 ($MILLION)
TABLE 73.CHINA INSTRUMENT TRANSFORMERS MARKET, BY TYPE, 2020–2030 ($MILLION)
TABLE 74.CHINA INSTRUMENT TRANSFORMERS MARKET, BY VOLTAGE, 2020–2030 ($MILLION)
TABLE 75.CHINA INSTRUMENT TRANSFORMERS MARKET, BY APPLICATION, 2020–2030 ($MILLION)
TABLE 76.CHINA INSTRUMENT TRANSFORMERS MARKET, BY END USER, 2020–2030 ($MILLION)
TABLE 77.JAPAN INSTRUMENT TRANSFORMERS MARKET, BY TYPE, 2020–2030 ($MILLION)
TABLE 78.JAPAN INSTRUMENT TRANSFORMERS MARKET, BY VOLTAGE, 2020–2030 ($MILLION)
TABLE 79.JAPAN INSTRUMENT TRANSFORMERS MARKET, BY APPLICATION, 2020–2030 ($MILLION)
TABLE 80.JAPAN INSTRUMENT TRANSFORMERS MARKET, BY END USER, 2020–2030 ($MILLION)
TABLE 81.SOUTH KOREA INSTRUMENT TRANSFORMERS MARKET, BY TYPE, 2020–2030 ($MILLION)
TABLE 82.SOUTH KOREA INSTRUMENT TRANSFORMERS MARKET, BY VOLTAGE, 2020–2030 ($MILLION)
TABLE 83.SOUTH KOREA INSTRUMENT TRANSFORMERS MARKET, BY APPLICATION, 2020–2030 ($MILLION)
TABLE 84.SOUTH KOREA INSTRUMENT TRANSFORMERS MARKET, BY END USER, 2020–2030 ($MILLION)
TABLE 85.INDIA INSTRUMENT TRANSFORMERS MARKET, BY TYPE, 2020–2030 ($MILLION)
TABLE 86.INDIA INSTRUMENT TRANSFORMERS MARKET, BY VOLTAGE, 2020–2030 ($MILLION)
TABLE 87.INDIA INSTRUMENT TRANSFORMERS MARKET, BY APPLICATION, 2020–2030 ($MILLION)
TABLE 88.INDIA INSTRUMENT TRANSFORMERS MARKET, BY END USER, 2020–2030 ($MILLION)
TABLE 89.AUSTRALIA INSTRUMENT TRANSFORMERS MARKET, BY TYPE, 2020–2030 ($MILLION)
TABLE 90.AUSTRALIA INSTRUMENT TRANSFORMERS MARKET, BY VOLTAGE, 2020–2030 ($MILLION)
TABLE 91.AUSTRALIA INSTRUMENT TRANSFORMERS MARKET, BY APPLICATION, 2020–2030 ($MILLION)
TABLE 92.AUSTRALIA INSTRUMENT TRANSFORMERS MARKET, BY END USER, 2020–2030 ($MILLION)
TABLE 93.REST OF ASIA-PACIFIC INSTRUMENT TRANSFORMERS MARKET, BY TYPE, 2020–2030 ($MILLION)
TABLE 94.REST OF ASIA-PACIFIC INSTRUMENT TRANSFORMERS MARKET, BY VOLTAGE, 2020–2030 ($MILLION)
TABLE 95.REST OF ASIA-PACIFIC INSTRUMENT TRANSFORMERS MARKET, BY APPLICATION, 2020–2030 ($MILLION)
TABLE 96.REST OF ASIA-PACIFIC INSTRUMENT TRANSFORMERS MARKET, BY END USER, 2020–2030 ($MILLION)
TABLE 97.LAMEA INSTRUMENT TRANSFORMERS MARKET, BY TYPE, 2020–2030 ($MILLION)
TABLE 98.LAMEA INSTRUMENT TRANSFORMERS MARKET, BY VOLTAGE, 2020–2030 ($MILLION)
TABLE 99.LAMEA INSTRUMENT TRANSFORMERS MARKET, BY APPLICATION, 2020–2030 ($MILLION)
TABLE 100.LAMEA INSTRUMENT TRANSFORMERS MARKET, BY END USER, 2020–2030 ($MILLION)
TABLE 101.LAMEA INSTRUMENT TRANSFORMERS MARKET, BY COUNTRY, 2020–2030 ($MILLION)
TABLE 102.BRAZIL INSTRUMENT TRANSFORMERS MARKET, BY TYPE, 2020–2030 ($MILLION)
TABLE 103.BRAZIL INSTRUMENT TRANSFORMERS MARKET, BY VOLTAGE, 2020–2030 ($MILLION)
TABLE 104.BRAZIL INSTRUMENT TRANSFORMERS MARKET, BY APPLICATION, 2020–2030 ($MILLION)
TABLE 105.BRAZIL INSTRUMENT TRANSFORMERS MARKET, BY END USER, 2020–2030 ($MILLION)
TABLE 106.SAUDI ARABIA INSTRUMENT TRANSFORMERS MARKET, BY TYPE, 2020–2030 ($MILLION)
TABLE 107.SAUDI ARABIA INSTRUMENT TRANSFORMERS MARKET, BY VOLTAGE, 2020–2030 ($MILLION)
TABLE 108.SAUDI ARABIA INSTRUMENT TRANSFORMERS MARKET, BY APPLICATION, 2020–2030 ($MILLION)
TABLE 109.SAUDI ARABIA INSTRUMENT TRANSFORMERS MARKET, BY END USER, 2020–2030 ($MILLION)
TABLE 110.SOUTH AFRICA INSTRUMENT TRANSFORMERS MARKET, BY TYPE, 2020–2030 ($MILLION)
TABLE 111.SOUTH AFRICA INSTRUMENT TRANSFORMERS MARKET, BY VOLTAGE, 2020–2030 ($MILLION)
TABLE 112.SOUTH AFRICA INSTRUMENT TRANSFORMERS MARKET, BY APPLICATION, 2020–2030 ($MILLION)
TABLE 113.SOUTH AFRICA INSTRUMENT TRANSFORMERS MARKET, BY END USER, 2020–2030 ($MILLION)
TABLE 114.REST OF LAMEA INSTRUMENT TRANSFORMERS MARKET, BY TYPE, 2020–2030 ($MILLION)
TABLE 115.REST OF LAMEA INSTRUMENT TRANSFORMERS MARKET, BY VOLTAGE, 2020–2030 ($MILLION)
TABLE 116.REST OF LAMEA INSTRUMENT TRANSFORMERS MARKET, BY APPLICATION, 2020–2030 ($MILLION)
TABLE 117.REST OF LAMEA INSTRUMENT TRANSFORMERS MARKET, BY END USER, 2020–2030 ($MILLION)
TABLE 118.CONTRACT (2021)
TABLE 119.AGREEMENT (2018)
TABLE 120.ABB LTD.: COMPANY SNAPSHOT
TABLE 121.ABB LTD.: OPERATING SEGMENTS
TABLE 122.ABB LTD.: PRODUCT PORTFOLIO
TABLE 123.OVERALL FINANCIAL STATUS ($MILLION)
TABLE 124.ARTECHE GROUP: COMPANY SNAPSHOT
TABLE 125.ARTECHE GROUP: PRODUCT PORTFOLIO
TABLE 126.ARTECHE GROUP: OVERALL FINANCIAL STATUS ($MILLION)
TABLE 127.BHARAT HEAVY ELECTRICAL LIMITED: COMPANY SNAPSHOT
TABLE 128.BHARAT HEAVY ELECTRICAL LIMITED: OPERATING SEGMENTS
TABLE 129.BHARAT HEAVY ELECTRICAL LIMITED.: PRODUCT PORTFOLIO
TABLE 130.BHARAT HEAVY ELECTRICAL LIMITED: OVERALL FINANCIAL STATUS ($MILLION)
TABLE 131.CG POWER AND INDUSTRIAL SOLUTIONS LTD.: COMPANY SNAPSHOT
TABLE 132.CG POWER AND INDUSTRIAL SOLUTIONS LTD.: OPERATING SEGMENTS
TABLE 133.CG POWER AND INDUSTRIAL SOLUTIONS LTD.: PRODUCT PORTFOLIO
TABLE 134.CG POWER AND INDUSTRIAL SOLUTIONS LTD.: OVERALL FINANCIAL STATUS ($MILLION)
TABLE 135.GENERAL ELECTRIC: COMPANY SNAPSHOT
TABLE 136.GENERAL ELECTRIC: OPERATING SEGMENTS
TABLE 137.GENERAL ELECTRIC: PRODUCT PORTFOLIO
TABLE 138.OVERALL FINANCIAL STATUS ($MILLION)
TABLE 139.GENERAL ELECTRIC: KEY STRATEGIC MOVES AND DEVELOPMENTS
TABLE 140.INSTRUMENT TRANSFORMER EQUIPMENT CORPORATION: COMPANY SNAPSHOT
TABLE 141.INSTRUMENT TRANSFORMER EQUIPMENT CORPORATION: PRODUCT PORTFOLIO
TABLE 142.MITSUBISHI ELECTRIC CORPORATION: COMPANY SNAPSHOT
TABLE 143.MITSUBISHI ELECTRIC CORPORATION: OPERATING SEGMENTS
TABLE 144.MITSUBISHI ELECTRIC CORPORATION: PRODUCT PORTFOLIO
TABLE 145.MITSUBISHI ELECTRIC CORPORATION: OVERALL FINANCIAL STATUS ($MILLION)
TABLE 146.SCHNEIDER ELECTRIC: COMPANY SNAPSHOT
TABLE 147.SCHNEIDER ELECTRIC: OPERATING SEGMENTS
TABLE 148.SCHNEIDER ELECTRIC: PRODUCT PORTFOLIO
TABLE 149.OVERALL FINANCIAL STATUS ($MILLION)
TABLE 150.SIEMENS AG: COMPANY SNAPSHOT
TABLE 151.SIEMENS AG: OPERATING SEGMENTS
TABLE 152.SIEMENS AG: PRODUCT PORTFOLIO
TABLE 153.SIEMENS AG: OVERALL FINANCIAL STATUS ($MILLION)
TABLE 154.SIEMENS AG: KEY STRATEGIC MOVES AND DEVELOPMENTS
TABLE 155.NISSIN ELECTRIC CO., LTD.: COMPANY SNAPSHOT
TABLE 156.NISSIN ELECTRIC CO., LTD.: OPERATING SEGMENTS
TABLE 157.NISSIN ELECTRIC CO., LTD..: PRODUCT PORTFOLIO
TABLE 158.NISSIN ELECTRIC CO., LTD.: OVERALL FINANCIAL STATUS ($MILLION)
LIST OF FIGURES
FIGURE 01.EXECUTIVE SUMMARY
FIGURE 02.INSTRUMENT TRANSFORMERS MARKET SEGMENTATION
FIGURE 03.TOP INVESTMENT POCKETS, BY COUNTRY
FIGURE 04.HIGH BARGAINING POWER OF SUPPLIERS
FIGURE 05.HIGH BARGAINING POWER OF BUYERS
FIGURE 06.MODERATE THREAT OF NEW ENTRANTS
FIGURE 07.LOW THREAT OF SUBSTITUTES
FIGURE 08.MODERATE INTENSITY OF COMPETITIVE RIVALRY
FIGURE 09.PATENT ANALYSIS: BY REGION (2016-2020)
FIGURE 10.INSTRUMENT TRANSFORMERS MARKET DYNAMICS
FIGURE 11.PARENT MARKET OVERVIEW
FIGURE 12.INSTRUMENT TRANSFORMERS MARKET, BY TYPE, 2020 VS 2030 ($MILLION)
FIGURE 13.COMPARATIVE ANALYSIS OF INSTRUMENT TRANSFORMERS MARKET FOR CURRENT TRANSFORMER, BY COUNTRY, 2020 VS 2030 ($MILLION)
FIGURE 14.COMPARATIVE ANALYSIS OF INSTRUMENT TRANSFORMERS MARKET FOR POTENTIAL TRANSFORMER, BY COUNTRY, 2020 VS 2030 ($MILLION)
FIGURE 15.COMPARATIVE ANALYSIS OF INSTRUMENT TRANSFORMERS MARKET FOR COMBINED INSTRUMENT TRANSFORMER, BY COUNTRY, 2020 VS 2030 ($MILLION)
FIGURE 16.INSTRUMENT TRANSFORMERS MARKET, BY VOLTAGE, 2020 VS 2030 ($MILLION)
FIGURE 17.COMPARATIVE ANALYSIS OF INSTRUMENT TRANSFORMERS MARKET FOR DISTRIBUTION VOLTAGE, BY COUNTRY, 2020 VS 2030 ($MILLION)
FIGURE 18.COMPARATIVE ANALYSIS OF INSTRUMENT TRANSFORMERS MARKET FOR SUB-TRANSMISSION VOLTAGE, BY COUNTRY, 2020 VS 2030 ($MILLION)
FIGURE 19.COMPARATIVE ANALYSIS OF INSTRUMENT TRANSFORMERS MARKET FOR HIGH VOLTAGE TRANSMISSION, BY COUNTRY, 2020 VS 2030 ($MILLION)
FIGURE 20.COMPARATIVE ANALYSIS OF INSTRUMENT TRANSFORMERS MARKET FOR EXTRA-HIGH VOLTAGE TRANSMISSION, BY COUNTRY, 2020 VS 2030 ($MILLION)
FIGURE 21.COMPARATIVE ANALYSIS OF INSTRUMENT TRANSFORMERS MARKET FOR ULTRA-HIGH VOLTAGE TRANSMISSION, BY COUNTRY, 2020 VS 2030 ($MILLION)
FIGURE 22.INSTRUMENT TRANSFORMERS MARKET, BY APPLICATION, 2020 VS 2030 ($MILLION)
FIGURE 23.COMPARATIVE ANALYSIS OF INSTRUMENT TRANSFORMERS MARKET FOR TRANSFORMER & CIRCUIT BREAKER BUSHING, BY COUNTRY, 2020 VS 2030 ($MILLION)
FIGURE 24.COMPARATIVE ANALYSIS OF INSTRUMENT TRANSFORMERS MARKET FOR SWITCHGEAR ASSEMBLIES, BY COUNTRY, 2020 VS 2030 ($MILLION)
FIGURE 25.COMPARATIVE ANALYSIS OF INSTRUMENT TRANSFORMERS MARKET FOR RELAYING, BY COUNTRY, 2020 VS 2030 ($MILLION)
FIGURE 26.COMPARATIVE ANALYSIS OF INSTRUMENT TRANSFORMERS MARKET FOR METERING & PROTECTION, BY COUNTRY, 2020 VS 2030 ($MILLION)
FIGURE 27.INSTRUMENT TRANSFORMERS MARKET, BY END USER, 2020 VS 2030 ($MILLION)
FIGURE 28.COMPARATIVE ANALYSIS OF INSTRUMENT TRANSFORMERS MARKET FOR POWER UTILITIES, BY COUNTRY, 2020 VS 2030 ($MILLION)
FIGURE 29.COMPARATIVE ANALYSIS OF INSTRUMENT TRANSFORMERS MARKET FOR POWER GENERATION, BY COUNTRY, 2020 VS 2030 ($MILLION)
FIGURE 30.COMPARATIVE ANALYSIS OF INSTRUMENT TRANSFORMERS MARKET FOR RAILWAYS AND METROS, BY COUNTRY, 2020 VS 2030 ($MILLION)
FIGURE 31.COMPARATIVE ANALYSIS OF INSTRUMENT TRANSFORMERS MARKET FOR INDUSTRIES AND OEMS, BY COUNTRY, 2020 VS 2030 ($MILLION)
FIGURE 32.INSTRUMENT TRANSFORMERS MARKET, BY REGION, 2020 VS 2030 ($MILLION)
FIGURE 33.U.S. INSTRUMENT TRANSFORMERS MARKET REVENUE, 2020–2030 ($MILLION)
FIGURE 34.CANADA INSTRUMENT TRANSFORMERS MARKET REVENUE, 2020–2030 ($MILLION)
FIGURE 35.MEXICO INSTRUMENT TRANSFORMERS MARKET REVENUE, 2020–2030 ($MILLION)
FIGURE 36.GERMANY INSTRUMENT TRANSFORMERS MARKET REVENUE, 2020–2030 ($MILLION)
FIGURE 37.FRANCE INSTRUMENT TRANSFORMERS MARKET REVENUE, 2020–2030 ($MILLION)
FIGURE 38.ITALY INSTRUMENT TRANSFORMERS MARKET REVENUE, 2020–2030 ($MILLION)
FIGURE 39.RUSSIA INSTRUMENT TRANSFORMERS MARKET REVENUE, 2020–2030 ($MILLION)
FIGURE 40.UK INSTRUMENT TRANSFORMERS MARKET REVENUE, 2020–2030 ($MILLION)
FIGURE 41.REST OF EUROPE INSTRUMENT TRANSFORMERS MARKET REVENUE, 2020–2030 ($MILLION)
FIGURE 42.CHINA INSTRUMENT TRANSFORMERS MARKET REVENUE, 2020–2030 ($MILLION)
FIGURE 43.JAPAN INSTRUMENT TRANSFORMERS MARKET REVENUE, 2020–2030 ($MILLION)
FIGURE 44.SOUTH KOREA INSTRUMENT TRANSFORMERS MARKET REVENUE, 2020–2030 ($MILLION)
FIGURE 45.INDIA INSTRUMENT TRANSFORMERS MARKET REVENUE, 2020–2030 ($MILLION)
FIGURE 46.AUSTRALIA INSTRUMENT TRANSFORMERS MARKET REVENUE, 2020–2030 ($MILLION)
FIGURE 47.REST OF ASIA-PACIFIC INSTRUMENT TRANSFORMERS MARKET REVENUE, 2020–2030 ($MILLION)
FIGURE 48.BRAZIL INSTRUMENT TRANSFORMERS MARKET REVENUE, 2020–2030 ($MILLION)
FIGURE 49.SAUDI ARABIA INSTRUMENT TRANSFORMERS MARKET REVENUE, 2020–2030 ($MILLION)
FIGURE 50.SOUTH AFRICA INSTRUMENT TRANSFORMERS MARKET REVENUE, 2020–2030 ($MILLION)
FIGURE 51.REST OF LAMEA INSTRUMENT TRANSFORMERS MARKET REVENUE, 2020–2030 ($MILLION)
FIGURE 52.TOP PLAYER POSITIONING, 2020
FIGURE 53.PRODUCT MAPPING OF TOP 10 PLAYERS
FIGURE 54.COMPETITIVE HEATMAP OF KEY PLAYERS
FIGURE 55.ABB LTD.: REVENUE, 2018–2020 ($MILLION)
FIGURE 56.ABB LTD.: REVENUE SHARE BY SEGMENT, 2020 (%)
FIGURE 57.ABB LTD.: REVENUE SHARE BY REGION, 2020 (%)
FIGURE 58.ARTECHE GROUP: REVENUE, 2018–2020 ($MILLION)
FIGURE 59.ARTECHE GROUP: REVENUE SHARE BY REGION, 2020 (%)
FIGURE 60.BHARAT HEAVY ELECTRICAL LIMITED: REVENUE, 2018–2020 ($MILLION)
FIGURE 61.BHARAT HEAVY ELECTRICAL LIMITED: REVENUE SHARE BY SEGMENT, 2020 (%)
FIGURE 62.CG POWER AND INDUSTRIAL SOLUTIONS LTD.: REVENUE, 2018–2020 ($MILLION)
FIGURE 63.CG POWER AND INDUSTRIAL SOLUTIONS LTD.: REVENUE SHARE BY SEGMENT, 2020 (%)
FIGURE 64.CG POWER AND INDUSTRIAL SOLUTIONS LTD.: REVENUE SHARE BY REGION, 2020 (%)
FIGURE 65.GENERAL ELECTRIC: REVENUE, 2018–2020 ($MILLION)
FIGURE 66.GENERAL ELECTRIC: REVENUE SHARE BY SEGMENT, 2020 (%)
FIGURE 67.GENERAL ELECTRIC: REVENUE SHARE BY REGION, 2020 (%)
FIGURE 68.MITSUBISHI ELECTRIC CORPORATION: REVENUE, 2018–2020 ($MILLION)
FIGURE 69.MITSUBISHI ELECTRIC CORPORATION: REVENUE SHARE BY SEGMENT, 2020 (%)
FIGURE 70.MITSUBISHI ELECTRIC CORPORATION. REVENUE SHARE BY REGION, 2020 (%)
FIGURE 71.SCHNEIDER ELECTRIC: REVENUE, 2018–2020 ($MILLION)
FIGURE 72.SCHNEIDER ELECTRIC: REVENUE SHARE BY SEGMENT, 2020 (%)
FIGURE 73.SCHNEIDER ELECTRIC: REVENUE SHARE BY REGION, 2020 (%)
FIGURE 74.SIEMENS AG: REVENUE, 2018–2020 ($MILLION)
FIGURE 75.SIEMENS AG: REVENUE SHARE BY SEGMENT, 2020 (%)
FIGURE 76.SIEMENS AG: REVENUE SHARE BY REGION, 2020 (%)
FIGURE 77.NISSIN ELECTRIC CO., LTD.: REVENUE, 2018–2020 ($MILLION)
FIGURE 78.NISSIN ELECTRIC CO., LTD.: REVENUE SHARE BY SEGMENT, 2020 (%)
FIGURE 79.NISSIN ELECTRIC CO., LTD.: REVENUE SHARE BY REGION, 2020 (%)
According to the analyst, the global instrument transformers market is anticipated to witness growth during the forecast period, driven by rapid expansion in power grid network across emerging energy markets and growth in renewable power generation facilities are expected to drive the market. A number of governments of both emerging and underdeveloped nations across the world are increasingly focusing on expanding their power grid network toward rural areas. Regions such as Africa that have low access to electricity have initiated various road maps to lay down electricity grid toward its remote places. Power Africa, an initiative led by the U.S., is planning to have 30.0 GW of electricity generation by 2030 and is expected to provide electricity to around 60.0 million homes in the remote areas of the region. Such a step is likely to create ample opportunity for the instrument transformer companies to expand its business in the near future.
However, increase in competition from the unorganized sector of the instrument transformer market is expected to hamper growth of the instrument transformers market during the forecast period. Furthermore, rise in investments in the transmission & distribution infrastructure is expected to provide growth opportunities for the instrument transformers market during the forecast period.
A. Rise in alternative energy programs, refurbishment of the aging power infrastructure, huge investments in smart grids and energy systems, increasing investments in the transmission & distribution infrastructure, and adoption of the HVDC technology for long distance transmission are the driving factors and opportunities in the instrument transformers market.
A. Mergers & acquisitions, and product launch are the key growth strategies of instrument transformers market players.
A. The report sample for global instrument transformers market report can be obtained on demand from the website. Also, the 24*7 chat support and direct call services are provided to procure the sample report.
A. Asia-Pacific region will provide more business opportunities for solar PV module players in future.
A. ABB, General Electric, Schneider Electric, Siemens, CG Power and Industrial Solutions Ltd, Mitsubishi Electric Corporation, Instrument Transformer Equipment Corporation, Arteche, Nissin Electric, and Bharat Heavy Electrical Limited are the leading global players in the instrument transformers market.
A. The top ten market players are selected based on two key attributes - competitive strength and market positioning
A. Power utilities segment holds the maximum share of the instrument transformers market.
A. Power utilities, power generation, railways & metros, manufacturing industries across the globe are the potential customers of instrument transformers industry.
A. The global instrument transformers market was valued at $7.0 billion in 2020, and is projected to reach $13.0 billion by 2030, growing at a CAGR of 6.5% from 2021 to 2030.
A. The global instrument transformers market analysis covers in-depth information of major industry participants, Porter’s five forces analysis help analyze potential of buyers & suppliers and the competitive scenario of the industry for strategy building, major countries have been mapped according to their individual revenue contribution to the regional market, the report provides in-depth analysis of the global instrument transformers market forecast for the period 2021–2030, the report outlines the current global instrument transformers market trends and future scenario of the global instrument transformers market from 2020 to 2030 to understand the prevailing opportunities and potential investment pockets, and key drivers, restraints, & opportunities and their detailed impact analysis are explained in the global instrument transformers market study.
Start reading instantly.
This Report and over 66,905+ more Reports, Available with Avenue Library. T&C*.
Enterprise
License/PDF
Library
Membership
*Taxes/Fees, if applicable will be added during checkout. All prices in USD
To ensure high-level data integrity, accurate analysis, and impeccable forecasts
For complete satisfaction
On-demand customization of scope of the report to exactly meet your needs
Targeted market view to provide pertinent information and save time of readers
Get insights on topics that are crucial for your business. Stay abreast of your interest areas.
Get Industry Data AlertsTo ensure high-level data integrity, accurate analysis, and impeccable forecasts
For complete satisfaction
On-demand customization of scope of the report to exactly meet your needs
Targeted market view to provide pertinent information and save time of readers