Report Code: A04252 | Apr 2018 | Pages: 225 | ||
Tables: 102 | Charts: 53 |
|
Pandemic disrupted the entire world and affected many industries.
Get detailed COVID-19 impact analysis on the Intelligent Building Market
Request Now !The global intelligent building market size was valued at $ 12,371 million in 2017, and is projected to reach $ 42,649 million by 2024, growing at a CAGR of 19.6% from 2018 to 2024. The rise in need for the energy efficient interventions in infrastructure industry, increased market for Building automation and control system, and growth in penetration of Internet of Things (IoT) in the building management system are some of the major factors that propel the growth of the market. In addition, rise in the development of smart city projects across the globe is expected to provide promising opportunities for global market.
However, complexity of interoperability between different connected building automation systems and high investment cost required for developing an intelligent building restrain the intelligent building market growth.
Â
An intelligent building is the integration of building, technology, and energy systems. Building automation systems include building automation, life safety, telecommunications, user systems, and facility management systems. Intelligent buildings deliver actionable information about a building or space inside a building to permit the building owner or occupant to manage the building or space.
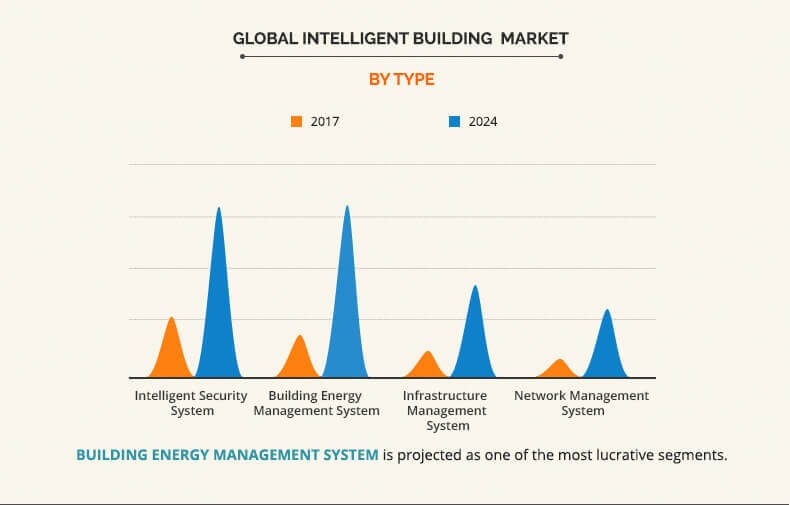
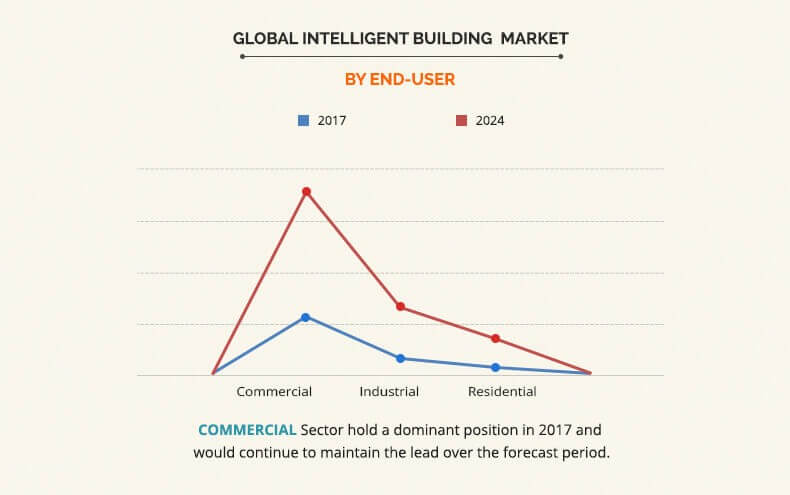
Building energy management system is expected to grow at a significant pace during the forecast period. The commercial segment led the market in 2017 and is expected to dominate in the near future. Furthermore, Europe is expected to dominate the overall intelligent building market during the forecast period, as it experiences the highest demand for intelligent buildings.
The report focuses on the growth prospects and restraints of the market based on the analysis of regional trends. The study provides Porters Five Forces analysis of the industry to understand the impact of various factors such as bargaining power of suppliers, competitive intensity of competitors, threat of new entrants, threat of substitutes, and bargaining power of buyers on the intelligent building market growth.
Segment Review
The global intelligent building market is segmented into component, type, end user, and region. Based on component, the market is classified into hardware, software, and service. Based on type, the market is divided into intelligent security system, building energy management system, infrastructure management system, and network management system. Based on end user, it is bifurcated into commercial, industrial, and residential. Based on region, it is analyzed across North America, Europe, Asia-Pacific, and LAMEA.
The global intelligent building market is dominated by key players such as ABB, Cisco Systems, Inc., Delta Controls, Honeywell International Inc., Intel Corporation, Johnson Controls, Legrand, Schneider Electric, Siemens AG, and United Technologies Corporation.
Top Impacting Factors
Increased need for energy efficiency, standards, and regulations of the supportive industry, and development in the market for smart cities driving the global intelligent evacuation system market share. However, high initial investment is expected to hamper the intelligent building market growth during the forecast period.
Increased need for energy efficiency
The demand for intelligent building is on an increase since the past few years due to constant increase in awareness about energy conservation throughout the world. Moreover, the adoption of green building and ecofriendly infrastructure has led to the construction of smart and energy efficient buildings, which regulates the energy usage and effectively manages the energy consumption in building across all the sectors. Smart technologies, such as occupancy sensors, smart thermostats, and HVAC and lighting controls help reduce energy usage in unoccupied offices, conference rooms, and other spaces. According to American Council for an Energy-Efficient Economy (AMCEE), smart technologies will save an estimated 8-18% of total energy consumption in subsectors that include Class B offices, small chain and independent retail stores, middle-tier franchise hotels, and regional hospitals.
Supportive industry standards and regulations
The governments across major economies are taking initiatives toward energy efficiency and sustainability in construction sector. Protocols and industry standards such as American Society of Heating, Refrigerating and Air Conditioning Engineers (ASHRAE), BACnet, network communications protocol for building automation and control systems adopted worldwide as ISO 16484-5:2003, Chartered Institution of Building Services Engineers, the ISO standard for building automation worldwide: ISO/IEC 14908-1, ISO/IEC 14908-2, ISO/IEC 14908-3, and ISO/IEC 14908-4 are expected to generate lucrative opportunities for the market growth during the forecast period.
High initial investment
Intelligent buildings have complex operational procedures due to integration of associated additional components. This adds to the system cost as well as increases the overall cost for the smart building owing to the complexity associated with installation and requirement of experienced and skilled professionals. These systems require regular maintenance checks to ensure the functionality of the system and reliability, which results in extra maintenance cost that impedes the growth of the intelligent building market.
Evolving market for smart cities
Smart cities and smart buildings improve the quality and interactivity of urban services while reducing costs and ensuring sustainability. Smart buildings support energy efficiency, reduction in greenhouse gas emission, and deployment of renewable sources of energy. The intelligent building acts as the backbone of smart city and provides great opportunities for the vendors of the smart building market.
Intelligent Building Market Report Highlights
Aspects | Details |
---|---|
By Component |
|
By Type |
|
By End User |
|
By Region |
|
Key Market Players | DELTA CONTROLS, ABB LTD., LEGRAND, HONEYWELL INTERNATIONAL INC., CISCO SYSTEMS, INC., SCHNEIDER ELECTRIC, INTEL CORPORATION, JOHNSON CONTROLS, SIEMENS AG, UNITED TECHNOLOGIES CORPORATION |
CHAPTER 1: INTRODUCTION
1.1. REPORT DESCRIPTION
1.2. KEY BENEFITS FOR STAKEHOLDERS
1.3. RESEARCH METHODOLOGY
1.3.1. Secondary research
1.3.2. Primary research
1.3.3. Analyst tools & models
CHAPTER 2: EXECUTIVE SUMMARY
2.1. CXO PERSPECTIVE
CHAPTER 3: MARKET OVERVIEW
3.1. MARKET DEFINITION AND SCOPE
3.2. KEY FINDINGS
3.2.1. Top impacting factors
3.2.2. Top investment pockets
3.2.3. Top winning strategies
3.2.3.1. Top Winning Strategies, By Year
3.2.3.2. Top Winning Strategies, By Development
3.2.3.3. Top Winning Strategies, By Company
3.3. PORTER'S FIVE FORCES ANALYSIS
3.4. MARKET PLAYER POSITIONING
3.5. MARKET DYNAMICS
3.5.1. Drivers
3.5.1.1. Increased need for energy efficiency
3.5.1.2. Supportive industry standards and regulations
3.5.2. Restraints
3.5.2.1. High initial investment
3.5.2.2. Complex interoperability
3.5.3. Opportunities
3.5.3.1. Evolving market for smart cities
CHAPTER 4: INTELLIGENT BUILDING MARKET BY COMPONENT
4.1. OVERVIEW
4.2. HARDWARE
4.2.1. Overview
4.2.2. Key market trends, growth factors and opportunities
4.2.3. Market size and forecast by region
4.2.4. Market analysis by country
4.3. SOFTWARE
4.3.1. Overview
4.3.2. Key market trends, growth factors and opportunities
4.3.3. Market size and forecast by region
4.3.4. Market analysis by country
4.4. SERVICES
4.4.1. Overview
4.4.2. Key market trends, growth factors and opportunities
4.4.3. Market size and forecast by region
4.4.4. Market analysis by country
CHAPTER 5: INTELLIGENT BUILDING MARKT BY TYPE
5.1. OVERVIEW
5.2. INTELLIGENT SECURITY SYSTEM
5.2.1. Overview
5.2.2. Key market trends, growth factors and opportunities
5.2.3. Market size and forecast by region
5.2.4. Market analysis by country
5.3. BUILDING ENERGY MANAGEMENT SYSTEM
5.3.1. Overview
5.3.2. Key market trends, growth factors and opportunities
5.3.3. Market size and forecast by region
5.3.4. Market analysis by country
5.4. INFRASTRUCTURE MANAGEMENT SYSTEM
5.4.1. Overview
5.4.2. Key market trends, growth factors and opportunities
5.4.3. Market size and forecast by region
5.4.4. Market analysis by country
5.5. NETWORK MANAGEMENT SYSTEM
5.5.1. Overview
5.5.2. Key market trends, growth factors and opportunities
5.5.3. Market size and forecast by region
5.5.4. Market analysis by country
CHAPTER 6: INTELLIGENT BUILDING MARKT BY END USER
6.1. OVERVIEW
6.2. COMMERCIAL
6.2.1. Overview
6.2.2. Key market trends, growth factors and opportunities
6.2.3. Market size and forecast by region
6.2.4. Market analysis by country
6.3. INDUSTRIAL
6.3.1. Overview
6.3.2. Key market trends, growth factors and opportunities
6.3.3. Market size and forecast by region
6.3.4. Market analysis by country
6.4. RESIDENTIAL
6.4.1. Overview
6.4.2. Key market trends, growth factors and opportunities
6.4.3. Market size and forecast by region
6.4.4. Market analysis by country
CHAPTER 7: INTELLIGENT BUILDING MARKET BY REGION
7.1. OVERVIEW
7.2. NORTH AMERICA
7.2.1. Key market trends, growth factors and opportunities
7.2.2. Market size and forecast by component
7.2.3. Market size and forecast by type
7.2.4. Market size and forecast by end user
7.2.5. Market size and forecast, by country
7.2.6. U.S. INTELLIGENT BUILDING MARKET
7.2.6.1. Market size and forecast by component
7.2.6.2. Market size and forecast by type
7.2.6.3. Market size and forecast by end user
7.2.7. CANADA INTELLIGENT BUILDING MARKET
7.2.7.1. Market size and forecast by component
7.2.7.2. Market size and forecast by type
7.2.7.3. Market size and forecast by end user
7.2.8. MEXICO INTELLIGENT BUILDING MARKET
7.2.8.1. Market size and forecast by component
7.2.8.2. Market size and forecast by type
7.2.8.3. Market size and forecast by end user
7.3. EUROPE
7.3.1. Key market trends, growth factors and opportunities
7.3.2. Market size and forecast by component
7.3.3. Market size and forecast by type
7.3.4. Market size and forecast by end user
7.3.5. Market size and forecast, by country
7.3.6. UK INTELLIGENT BUILDING MARKET
7.3.6.1. Market size and forecast by component
7.3.6.2. Market size and forecast by type
7.3.6.3. Market size and forecast by end user
7.3.7. GERMANY INTELLIGENT BUILDING MARKET
7.3.7.1. Market size and forecast by component
7.3.7.2. Market size and forecast by type
7.3.7.3. Market size and forecast by end user
7.3.8. FRANCE INTELLIGENT BUILDING MARKET
7.3.8.1. Market size and forecast by component
7.3.8.2. Market size and forecast by type
7.3.8.3. Market size and forecast by end user
7.3.9. REST OF EUROPE INTELLIGENT BUILDING MARKET
7.3.9.1. Market size and forecast by component
7.3.9.2. Market size and forecast by type
7.3.9.3. Market size and forecast by end user
7.4. ASIA-PACIFIC
7.4.1. Key market trends, growth factors and opportunities
7.4.2. Market size and forecast by component
7.4.3. Market size and forecast by type
7.4.4. Market size and forecast by end user
7.4.5. Market size and forecast, by country
7.4.6. CHINA INTELLIGENT BUILDING MARKET
7.4.6.1. Market size and forecast by component
7.4.6.2. Market size and forecast by type
7.4.6.3. Market size and forecast by end user
7.4.7. INDIA INTELLIGENT BUILDING MARKET
7.4.7.1. Market size and forecast by component
7.4.7.2. Market size and forecast by type
7.4.7.3. Market size and forecast by end user
7.4.8. JAPAN INTELLIGENT BUILDING MARKET
7.4.8.1. Market size and forecast by component
7.4.8.2. Market size and forecast by type
7.4.8.3. Market size and forecast by end user
7.4.9. REST OF ASIA-PACIFIC INTELLIGENT BUILDING MARKET
7.4.9.1. Market size and forecast by component
7.4.9.2. Market size and forecast by type
7.4.9.3. Market size and forecast by end user
7.5. LAMEA
7.5.1. Key market trends, growth factors and opportunities
7.5.2. Market size and forecast by component
7.5.3. Market size and forecast by type
7.5.4. Market size and forecast by end user
7.5.5. Market size and forecast, by country
7.5.6. LATIN AMERICA INTELLIGENT BUILDING MARKET
7.5.6.1. Market size and forecast by component
7.5.6.2. Market size and forecast by type
7.5.6.3. Market size and forecast by end user
7.5.7. MIDDLE EAST INTELLIGENT BUILDING MARKET
7.5.7.1. Market size and forecast by component
7.5.7.2. Market size and forecast by type
7.5.7.3. Market size and forecast by end user
7.5.8. AFRICA INTELLIGENT BUILDING MARKET
7.5.8.1. Market size and forecast by component
7.5.8.2. Market size and forecast by type
7.5.8.3. Market size and forecast by end user
CHAPTER 8: COMPANY PROFILES
8.1. ABB LTD.
8.1.1. Company overview
8.1.2. Company snapshot
8.1.3. Operating business segments
8.1.4. Product portfolio
8.1.5. Business performance
8.1.6. Key strategic moves and developments
8.2. CISCO SYSTEMS, INC.
8.2.1. Company overview
8.2.2. Company snapshot
8.2.3. Operating business segments
8.2.4. Product portfolio
8.2.5. Business performance
8.3. DELTA CONTROLS
8.3.1. Company overview
8.3.2. Company snapshot
8.3.3. Operating business segments
8.3.4. Product portfolio
8.3.5. Business performance
8.4. HONEYWELL INTERNATIONAL INC.
8.4.1. Company overview
8.4.2. Company snapshot
8.4.3. Operating business segments
8.4.4. Product portfolio
8.4.5. Business performance
8.4.6. Key strategic moves and developments
8.5. INTEL CORPORATION
8.5.1. Company overview
8.5.2. Company snapshot
8.5.3. Operating business segments
8.5.4. Product portfolio
8.5.5. Business performance
8.5.6. Key strategic moves and developments
8.6. JOHNSON CONTROLS
8.6.1. Company overview
8.6.2. Company snapshot
8.6.3. Operating business segments
8.6.4. Product portfolio
8.6.5. Business performance
8.6.6. Key strategic moves and developments
8.7. LEGRAND
8.7.1. Company overview
8.7.2. Company snapshot
8.7.3. Operating business segments
8.7.4. Product portfolio
8.7.5. Business performance
8.7.6. Key strategic moves and developments
8.8. SCHNEIDER ELECTRIC
8.8.1. Company overview
8.8.2. Company snapshot
8.8.3. Operating business segments
8.8.4. Product portfolio
8.8.5. Key strategic moves and developments
8.9. SIEMENS AG
8.9.1. Company overview
8.9.2. Company snapshot
8.9.3. Operating business segments
8.9.4. Product portfolio
8.9.5. Business performance
8.9.6. Key strategic moves and developments
8.10. UNITED TECHNOLOGIES CORPORATION
8.10.1. Company overview
8.10.2. Company snapshot
8.10.3. Operating business segments
8.10.4. Product portfolio
8.10.5. Business performance
8.10.6. Key strategic moves and developments
LIST OF TABLES
TABLE 01. GLOBAL INTELLIGENT BUILDING MARKET REVENUE, BY COMPONENT, 2017-2024 ($MILLION)
TABLE 02. GLOBAL INTELLIGENT BUILDING MARKET REVENUE FOR HARDWARE, BY REGION, 2017-2024 ($MILLION)
TABLE 03. GLOBAL INTELLIGENT BUILDING MARKET REVENUE FOR SOFTWARE, BY REGION, 2017-2024 ($MILLION)
TABLE 04. GLOBAL INTELLIGENT BUILDING MARKET REVENUE FOR SERVICES, BY REGION, 2017-2024 ($MILLION)
TABLE 05. GLOBAL INTELLIGENT BUILDING MARKET REVENUE, BY TYPE, 2017-2024 ($MILLION)
TABLE 06. GLOBAL INTELLIGENT BUILDING MARKET REVENUE FOR INTELLIGENT SECURITY SYSTEM, BY REGION, 2017-2024 ($MILLION)
TABLE 07. GLOBAL INTELLIGENT BUILDING MARKET REVENUE FOR BUILDING ENERGY MANAGEMENT SYSTEM, BY REGION, 2017-2024 ($MILLION)
TABLE 08. GLOBAL INTELLIGENT BUILDING MARKET REVENUE FOR INFRASTRUCTURE MANAGEMENT SYSTEM, BY REGION, 2017-2024 ($MILLION)
TABLE 09. GLOBAL INTELLIGENT BUILDING MARKET REVENUE FOR NETWORK MANAGEMENT SYSTEM, BY REGION, 2017-2024 ($MILLION)
TABLE 10. GLOBAL INTELLIGENT BUILDING MARKET REVENUE, BY END USER, 2017-2024 ($MILLION)
TABLE 11. GLOBAL INTELLIGENT BUILDING MARKET REVENUE FOR COMMERCIAL, BY REGION, 2017-2024 ($MILLION)
TABLE 12. GLOBAL INTELLIGENT BUILDING MARKET REVENUE FOR INDUSTRIAL, BY REGION, 2017-2024 ($MILLION)
TABLE 13. GLOBAL INTELLIGENT BUILDING MARKET REVENUE FOR RESIDENTIAL, BY REGION, 2017-2024 ($MILLION)
TABLE 14. GLOBAL INTELLIGENT BUILDING MARKET REVENUE, BY GEOGRAPHY, 2017-2024 ($MILLION)
TABLE 15. NORTH AMERICA INTELLIGENT BUILDING MARKET REVENUE, BY COMPONENT, 2017-2024 ($MILLION)
TABLE 16. NORTH AMERICA INTELLIGENT BUILDING MARKET REVENUE, BY TYPE, 2017-2024 ($MILLION)
TABLE 17. NORTH AMERICA INTELLIGENT BUILDING MARKET REVENUE, BY END USER, 2017-2024 ($MILLION)
TABLE 18. NORTH AMERICA INTELLIGENT BUILDING MARKET REVENUE, BY COUNTRY, 2017-2024 ($MILLION)
TABLE 19. U.S. INTELLIGENT BUILDING MARKET REVENUE, BY COMPONENT, 2017-2024 ($MILLION)
TABLE 20. U.S. INTELLIGENT BUILDING MARKET REVENUE, BY TYPE, 2017-2024 ($MILLION)
TABLE 21. U.S. INTELLIGENT BUILDING MARKET REVENUE, BY END USER, 2017-2024 ($MILLION)
TABLE 22. CANADA INTELLIGENT BUILDING MARKET REVENUE, BY COMPONENT, 2017-2024 ($MILLION)
TABLE 23. CANADA INTELLIGENT BUILDING MARKET REVENUE, BY TYPE, 2017-2024 ($MILLION)
TABLE 24. CANADA INTELLIGENT BUILDING MARKET REVENUE, BY END USER, 2017-2024 ($MILLION)
TABLE 25. MEXICO INTELLIGENT BUILDING MARKET REVENUE, BY COMPONENT, 2017-2024 ($MILLION)
TABLE 26. MEXICO INTELLIGENT BUILDING MARKET REVENUE, BY TYPE, 2017-2024 ($MILLION)
TABLE 27. MEXICO INTELLIGENT BUILDING MARKET REVENUE, BY END USER, 2017-2024 ($MILLION)
TABLE 28. EUROPE INTELLIGENT BUILDING MARKET REVENUE, BY COMPONENT, 2017-2024 ($MILLION)
TABLE 29. EUROPE INTELLIGENT BUILDING MARKET REVENUE, BY TYPE, 2017-2024 ($MILLION)
TABLE 30. EUROPE INTELLIGENT BUILDING MARKET REVENUE, BY END USER, 2017-2024 ($MILLION)
TABLE 31. EUROPE INTELLIGENT BUILDING MARKET REVENUE, BY COUNTRY, 2017-2024 ($MILLION)
TABLE 32. UK INTELLIGENT BUILDING MARKET REVENUE, BY COMPONENT, 2017-2024 ($MILLION)
TABLE 33. UK INTELLIGENT BUILDING MARKET REVENUE, BY TYPE, 2017-2024 ($MILLION)
TABLE 34. UK INTELLIGENT BUILDING MARKET REVENUE, BY END USER, 2017-2024 ($MILLION)
TABLE 35. GERMANY INTELLIGENT BUILDING MARKET REVENUE, BY COMPONENT, 2017-2024 ($MILLION)
TABLE 36. GERMANY INTELLIGENT BUILDING MARKET REVENUE, BY TYPE, 2017-2024 ($MILLION)
TABLE 37. GERMANY INTELLIGENT BUILDING MARKET REVENUE, BY END USER, 2017-2024 ($MILLION)
TABLE 38. FRANCE INTELLIGENT BUILDING MARKET REVENUE, BY COMPONENT, 2017-2024 ($MILLION)
TABLE 39. FRANCE INTELLIGENT BUILDING MARKET REVENUE, BY TYPE, 2017-2024 ($MILLION)
TABLE 40. FRANCE INTELLIGENT BUILDING MARKET REVENUE, BY END USER, 2017-2024 ($MILLION)
TABLE 41. REST OF EUROPE INTELLIGENT BUILDING MARKET REVENUE, BY COMPONENT, 2017-2024 ($MILLION)
TABLE 42. REST OF EUROPE INTELLIGENT BUILDING MARKET REVENUE, BY TYPE, 2017-2024 ($MILLION)
TABLE 43. REST OF EUROPE INTELLIGENT BUILDING MARKET REVENUE, BY END USER, 2017-2024 ($MILLION)
TABLE 44. ASIA-PACIFIC INTELLIGENT BUILDING MARKET REVENUE, BY COMPONENT, 2017-2024 ($MILLION)
TABLE 45. ASIA-PACIFIC INTELLIGENT BUILDING MARKET REVENUE, BY TYPE, 2017-2024 ($MILLION)
TABLE 46. ASIA-PACIFIC INTELLIGENT BUILDING MARKET REVENUE, BY END USER, 2017-2024 ($MILLION)
TABLE 47. ASIA-PACIFIC INTELLIGENT BUILDING MARKET REVENUE, BY COUNTRY, 2017-2024 ($MILLION)
TABLE 48. CHINA INTELLIGENT BUILDING MARKET REVENUE, BY COMPONENT, 2017-2024 ($MILLION)
TABLE 49. CHINA INTELLIGENT BUILDING MARKET REVENUE, BY TYPE, 2017-2024 ($MILLION)
TABLE 50. CHINA INTELLIGENT BUILDING MARKET REVENUE, BY END USER, 2017-2024 ($MILLION)
TABLE 51. INDIA INTELLIGENT BUILDING MARKET REVENUE, BY COMPONENT, 2017-2024 ($MILLION)
TABLE 52. INDIA INTELLIGENT BUILDING MARKET REVENUE, BY TYPE, 2017-2024 ($MILLION)
TABLE 53. INDIA INTELLIGENT BUILDING MARKET REVENUE, BY END USER, 2017-2024 ($MILLION)
TABLE 54. JAPAN INTELLIGENT BUILDING MARKET REVENUE, BY COMPONENT, 2017-2024 ($MILLION)
TABLE 55. JAPAN INTELLIGENT BUILDING MARKET REVENUE, BY TYPE, 2017-2024 ($MILLION)
TABLE 56. JAPAN INTELLIGENT BUILDING MARKET REVENUE, BY END USER, 2017-2024 ($MILLION)
TABLE 57. REST OF ASIA-PACIFIC INTELLIGENT BUILDING MARKET REVENUE, BY COMPONENT, 2017-2024 ($MILLION)
TABLE 58. REST OF ASIA-PACIFICÂ INTELLIGENT BUILDING MARKET REVENUE, BY TYPE, 2017-2024 ($MILLION)
TABLE 59. REST OF ASIA-PACIFIC INTELLIGENT BUILDING MARKET REVENUE, BY END USER, 2017-2024 ($MILLION)
TABLE 60. LAMEA INTELLIGENT BUILDING MARKET REVENUE, BY COMPONENT, 2017-2024 ($MILLION)
TABLE 61. LAMEA INTELLIGENT BUILDING MARKET REVENUE, BY TYPE, 2017-2024 ($MILLION)
TABLE 62. LAMEA INTELLIGENT BUILDING MARKET REVENUE, BY END USER, 2017-2024 ($MILLION)
TABLE 63. LAMEA INTELLIGENT BUILDING MARKET REVENUE, BY COUNTRY, 2017-2024 ($MILLION)
TABLE 64. LATIN AMERICA INTELLIGENT BUILDING MARKET REVENUE, BY COMPONENT, 2017-2024 ($MILLION)
TABLE 65. LATIN AMERICA INTELLIGENT BUILDING MARKET REVENUE, BY TYPE, 2017-2024 ($MILLION)
TABLE 66. LATIN AMERICA INTELLIGENT BUILDING MARKET REVENUE, BY END USER, 2017-2024 ($MILLION)
TABLE 67. MIDDLE EAST INTELLIGENT BUILDING MARKET REVENUE, BY COMPONENT, 2017-2024 ($MILLION)
TABLE 68. MIDDLE EAST INTELLIGENT BUILDING MARKET REVENUE, BY TYPE, 2017-2024 ($MILLION)
TABLE 69. MIDDLE EAST INTELLIGENT BUILDING MARKET REVENUE, BY END USER, 2017-2024 ($MILLION)
TABLE 70. AFRICA INTELLIGENT BUILDING MARKET REVENUE, BY COMPONENT, 2017-2024 ($MILLION)
TABLE 71. AFRICA INTELLIGENT BUILDING MARKET REVENUE, BY TYPE, 2017-2024 ($MILLION)
TABLE 72. AFRICA INTELLIGENT BUILDING MARKET REVENUE, BY END USER, 2017-2024 ($MILLION)
TABLE 73. ABB LTD.: COMPANY SNAPSHOT
TABLE 74. ABB LTD.: OPERATING SEGMENTS
TABLE 75. ABB LTD.: PRODUCT PORTFOLIO
TABLE 76. CISCO SYSTEMS, INC.: COMPANY SNAPSHOT
TABLE 77. CISCO SYSTEMS, INC.: OPERATING SEGMENTS
TABLE 78. CISCO SYSTEMS, INC.: PRODUCT PORTFOLIO
TABLE 79. DELTA CONTROLS: COMPANY SNAPSHOT
TABLE 80. DELTA CONTROLS: OPERATING SEGMENTS
TABLE 81. DELTA CONTROLS: PRODUCT PORTFOLIO
TABLE 82. HONEYWELL INTERNATIONAL INC.: COMPANY SNAPSHOT
TABLE 83. HONEYWELL INTERNATIONAL INC.: OPERATING SEGMENTS
TABLE 84. HONEYWELL INTERNATIONAL INC.: PRODUCT PORTFOLIO
TABLE 85. INTEL CORPORATION: COMPANY SNAPSHOT
TABLE 86. INTEL CORPORATION: OPERATING SEGMENTS
TABLE 87. INTEL CORPORATION: PRODUCT PORTFOLIO
TABLE 88. JOHNSON CONTROLS: COMPANY SNAPSHOT
TABLE 89. JOHNSON CONTROLS: OPERATING SEGMENTS
TABLE 90. JOHNSON CONTROLS: PRODUCT PORTFOLIO
TABLE 91. LEGRAND: COMPANY SNAPSHOT
TABLE 92. LEGRAND: OPERATING SEGMENTS
TABLE 93. LEGRAND: PRODUCT PORTFOLIO
TABLE 94. SCHNEIDER ELECTRIC: COMPANY SNAPSHOT
TABLE 95. SCHNEIDER ELECTRIC: OPERATING SEGMENTS
TABLE 96. SCHNEIDER ELECTRIC: PRODUCT PORTFOLIO
TABLE 97. SIEMENS AG: COMPANY SNAPSHOT
TABLE 98. SIEMENS AG: OPERATING SEGMENTS
TABLE 99. SIEMENS AG: PRODUCT PORTFOLIO
TABLE 100. UNITED TECHNOLOGIES CORPORATION: COMPANY SNAPSHOT
TABLE 101. UNITED TECHNOLOGIES CORPORATION: OPERATING SEGMENTS
TABLE 102. UNITED TECHNOLOGIES CORPORATION: PRODUCT PORTFOLIO
LIST OF FIGURES
FIGURE 01. GLOBAL INTELLIGENT BUILDING MARKET, 2017-2024
FIGURE 02. GLOBAL INTELLIGENT BUILDING MARKET, BY REGION, 2017-2024
FIGURE 03. GLOBAL INTELLIGENT BUILDING MARKET: KEY PLAYERS
FIGURE 04. SEGMENTATION OF GLOBAL INTELLIGENT BUILDING MARKET
FIGURE 05. TOP INVESTMENT POCKETS: INTELLIGENT BUILDING MARKET
FIGURE 06. MODERATE BARGAINING POWER OF BUYERS
FIGURE 07. HIGH BARGAINING POERT OF SUPPLIERS
FIGURE 08. HIGH THREAT OF NEW ENTRANTS
FIGURE 09. MODERATE THREAT OF SUBSTITUTES
FIGURE 10. HIGH COMPETITIVE RIVALARY
FIGURE 11. MARKET PLAYER POSITIONING: INTELLIGENT BUILDING MARKET
FIGURE 12. DRIVERS, RESTRAINTS, AND OPPORTUNITIES: INTELLIGENT BUILDING MARKET
FIGURE 13. U.S. INTELLIGENT BUILDING MARKET, 2017-2024 ($ MILLION)
FIGURE 14. CANADA INTELLIGENT BUILDING MARKET, 2017-2024 ($ MILLION)
FIGURE 15. MEXICO INTELLIGENT BUILDING MARKET, 2017-2024 ($ MILLION)
FIGURE 16. UK INTELLIGENT BUILDING MARKET, 2017-2024 ($ MILLION)
FIGURE 17. GERMANY INTELLIGENT BUILDING MARKET, 2017-2024 ($ MILLION)
FIGURE 18. FRANCE INTELLIGENT BUILDING MARKET, 2017-2024 ($ MILLION)
FIGURE 19. REST OF EUROPE INTELLIGENT BUILDING MARKET, 2017-2024 ($ MILLION)
FIGURE 20. CHINA INTELLIGENT BUILDING MARKET, 2017-2024 ($ MILLION)
FIGURE 21. INDIA INTELLIGENT BUILDING MARKET, 2017-2024 ($ MILLION)
FIGURE 22. JAPAN INTELLIGENT BUILDING MARKET, 2017-2024 ($ MILLION)
FIGURE 23. REST OF ASIA-PACIFIC INTELLIGENT BUILDING MARKET, 2017-2024 ($ MILLION)
FIGURE 24. LATIN AMERICA INTELLIGENT BUILDING MARKET, 2017-2024 ($ MILLION)
FIGURE 25. MIDDLE EAST INTELLIGENT BUILDING MARKET, 2017-2024 ($ MILLION)
FIGURE 26. AFRICA INTELLIGENT BUILDING MARKET, 2017-2024 ($ MILLION)
FIGURE 27. ABB LTD.: REVENUE
FIGURE 28. ABB LTD.: REVENUE SHARE BY SEGMENT
FIGURE 29. ABB LTD.: REVENUE SHARE BY GEOGRAPHY
FIGURE 30. CISCO SYSTEMS, INC.: REVENUE
FIGURE 31. CISCO SYSTEMS, INC.: REVENUE SHARE BY SEGMENT
FIGURE 32. CISCO SYSTEMS, INC.: REVENUE SHARE BY GEOGRAPHY
FIGURE 33. GENERAL ELECTRIC COMPANY: REVENUE
FIGURE 34. DELTA CONTROLS: REVENUE SHARE BY SEGMENT
FIGURE 35. DELTA CONTROLS: REVENUE SHARE BY GEOGRAPHY
FIGURE 36. HONEYWELL INTERNATIONAL INC.: REVENUE
FIGURE 37. HONEYWELL INTERNATIONAL INC.: REVENUE SHARE BY SEGMENT
FIGURE 38. HONEYWELL INTERNATIONAL INC.: REVENUE SHARE BY GEOGRAPHY
FIGURE 39. INTEL CORPORATION: REVENUE.
FIGURE 40. INTEL CORPORATION: REVENUE SHARE BY SEGMENT
FIGURE 41. INTEL CORPORATION: REVENUE SHARE BY GEOGRAPHY
FIGURE 42. JOHNSON CONTROLS: REVENUE
FIGURE 43. JOHNSON CONTROLS: REVENUE SHARE BY SEGMENT
FIGURE 44. JOHNSON CONTROLS: REVENUE SHARE BY GEOGRAPHY
FIGURE 45. LEGRAND: REVENUE
FIGURE 46. LEGRAND: REVENUE SHARE BY SEGMENT
FIGURE 47. LEGRAND: REVENUE SHARE BY GEOGRAPHY
FIGURE 48. SIEMENS AG: REVENUE
FIGURE 49. SIEMENS AG: REVENUE SHARE BY SEGMENT
FIGURE 50. SIEMENS AG: REVENUE SHARE BY GEOGRAPHY
FIGURE 51. UNITED TECHNOLOGIES CORPORATION: REVENUE
FIGURE 52. UNITED TECHNOLOGIES CORPORATION: REVENUE SHARE BY SEGMENT
FIGURE 53. UNITED TECHNOLOGIES CORPORATION: REVENUE SHARE BY GEOGRAPHY
Intelligent building utilizes advanced technologies and interconnected systems to support the automation of building management systems, which facilitates the efficient operation of the building and supports reconfiguration of the space in response to changing use.
The intelligent building market share has increased due to the rise in demand for connectedness, increase in automation of building management, increased market for Building automation and control system, and need for energy efficient solution for saving the energy and reducing the carbon emission throughout the world. Moreover, continuous extensive growth in population especially among the developing countries creates the need for smart buildings, which offer the optimum space utilization in core comforting and sustainable manner. Due to which government of many countries are making substantial investments for smart city and intelligent building development to promote sustainable development practices to address growth in urbanization challenges.
In addition, increase in need for integrated security and safety systems and decrease in operational costs due to uptake of building energy management systems (BEMS) leads to adoption or retrofitting into an intelligent building, which is expected to drive the demand for the global intelligent building market.
Moreover, rise in energy efficient projects and increase in digitization across commercial and industrial buildings are expected to provide potential growth opportunities for the market. Some of the key players operating in the intelligent building market that are profiled in the report include ABB, Cisco Systems, Inc., Delta Controls, Honeywell International Inc., Intel Corporation, Johnson Controls, Legrand, Schneider Electric, Siemens AG, and United Technologies Corporation. The intelligent building market players have adopted various growth strategies to enhance their product portfolio and market penetration, as well as they launch new products to increase their customer base and to cater to the demands of the consumers.
Start reading instantly.
This Report and over 66,782+ more Reports, Available with Avenue Library. T&C*.
Enterprise
License/PDF
Library
Membership
*Taxes/Fees, if applicable will be added during checkout. All prices in USD
To ensure high-level data integrity, accurate analysis, and impeccable forecasts
For complete satisfaction
On-demand customization of scope of the report to exactly meet your needs
Targeted market view to provide pertinent information and save time of readers
Get insights on topics that are crucial for your business. Stay abreast of your interest areas.
Get Industry Data AlertsTo ensure high-level data integrity, accurate analysis, and impeccable forecasts
For complete satisfaction
On-demand customization of scope of the report to exactly meet your needs
Targeted market view to provide pertinent information and save time of readers