0
2019
Interactive Display Market

Interactive Display Market

by Panel Type (Flat Panel, Flexible Panel, and Transparent Panel), Technology (OLED, LED, LCD, and QD), Screen Size(Less than 35", 35" to 60", and More than 60"), Application (Interactive Table, Interactive Monitor, Interactive Kiosk, Interactive Whiteboard, and Video Wall), and End User (Healthcare, Retail, BFSI, Military & Defense, Transportation, Education, and Other): Global Opportunity Analysis and Industry Forecast, 2019-2026

Report Code: A05776
Oct 2019 | Pages: 381
Tables: 161
Charts: 28
  • Formats*:

  • pdf

    Single User License, Five User
    License & Enterprise User License

  • xls

    Data Pack Excel License

  • ppt

    It comes with the additional cost
    of $2500.00 contact sales.


COVID-19

Pandemic disrupted the entire world and affected many industries.

Get detailed COVID-19 impact analysis on the Interactive Display Market

Request Now !

Interactive Display Market Outlook - 2026
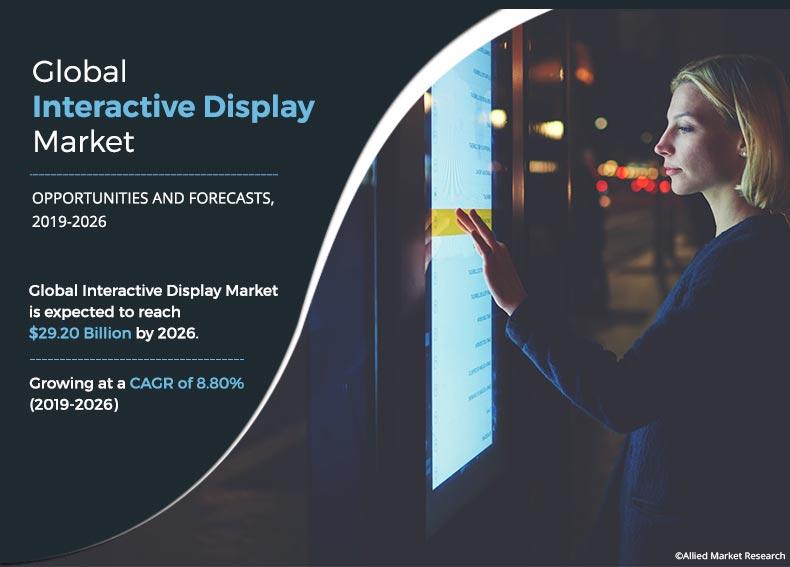
The global interactive display market was valued at $14.63 billion in 2018, and is projected to reach $29.19 billion by 2026, registering a CAGR of 8.80% from 2019 to 2026. Interactive display includes screens that project information such as images, videos, and texts. These display screens utilize numerous technologies such as light-emitting diode (LED), liquid crystal display (LCD), organic light-emitting diode (OLED), and others. Also, it is majorly used in consumer electronic devices such as monitor, laptops, tablets, smart watches, and others. The emergence of advanced technologies offers enhanced visualizations in several industry verticals, which include education, corporate, retail, sports & entertainment, transportation, and others. 
 
Touch screen displays are in trend in education and corporate sector. Also, flexible display technologies witness popularity at a high pace. In addition, the touch screen displays provide high quality range solution across spectrum of interactive technologies. Also, display technologies such as organic light-emitting diode (OLED) have gained increased importance in products such as monitors, video walls, smartphones, and other devices. Moreover, display manufacturers plan to incorporate touchscreen panels, which are used in digital signage.  

Interactive Display Market

The scope of the report discusses the potential opportunities for the market players to enter the global interactive display market. Furthermore, it provides an in-depth interactive display market analysis, outlining current trends, key driving factors, and key area of investment. The study includes Porter’s five forces analysis of the industry to determine the impact of suppliers, competitors, new entrants, substitutes, and buyers on the market growth. Moreover, it features the strategies adopted by key market players to maintain their foothold in the market. 

The major factors that drive the global interactive display market include growth in the flexible display technologies, increase in demand for interactive whiteboard in education sector, and rise in trend of touch-based devices. However, high cost of the latest display technologies such as transparent display and quantum dot displays are hinder the market growth. Furthermore, upcoming applications in the flexible display devices is expected to create lucrative growth opportunities for the global interactive display market. 

Segment Overview

The global interactive display market trends are analyzed across various segments including panel type, technology, screen size, application, end user, and region. Based on panel type, the market is divided into flat panel display, flexible panel display, and transparent panel display. Based on technology, it is classified into OLED, quantum dots, LED, and LCD. By application, it is categorized into interactive table, interactive monitor, interactive kiosk, interactive whiteboard, and video wall. By end user, the market is divided into healthcare, retail, BFSI, military & defense, transportation, education, and others. Based on region, the market is analyzed across North America, Europe, Asia-Pacific, and Latin America & Middle East (LAMEA).  

The regional segmentation of the global interactive display market includes North America, Europe, Asia-Pacific, and LAMEA. The North America interactive display market share are expected to grow at the highest CAGR during the forecast period, owing advancements in display technology have led to their further adoption in the region.

Top Impacting Factors

The major factors that drive the global interactive display market include growth in the flexible display technologies, increase in demand for interactive whiteboard in education sector, and rise in trend of touch-based devices. However, high cost of the latest display technologies such as transparent display and quantum dot displays hinder the market growth. Furthermore, upcoming applications in the flexible display devices is expected to create lucrative growth for the global interactive display market opportunities. Each of these factors is anticipated to have a definite impact on the interactive display market size during the forecast period. 

Interactive Display Market
By Panel Type

Your browser does not support the canvas element.

Transparent Panel would exhibit the highest CAGR of 18.70% during 2019-2026.

Get more information on this report : Request Sample Pages

Increase in demand for interactive whiteboard in education sector

Rise in demand for interactive whiteboard in schools, institutions, and universities around the worlds. These displays are useful for learning and teaching. The interactive display industry offers numerous advantages such as increase level of engagement between students and teachers, it allows students to learn better with various disability, bring flexibility in learning, saves teaching cost, and allows student to save lessons for latter learning or review. Also, interactive display allows teachers to share text, screen, video, and audio files with student easily. 

Surge in adoption of interactive display in retail application

Over the years, the advancement in display technologies has lured large consumer base. The fast-growing adoption of 4K or Ultra High Definition TVs in residential sector has increased the demand for AV cables. This offers HDMI ports that are capable of supporting high transfer rate. These TVs also provide ports for connection of various entertainment systems such as gaming consoles, home theatre systems, and others, which in turn provides lucrative interactive display market opportunity globally.

Interactive Display Market
By Application

Your browser does not support the canvas element.

Interactive table would exhibit the highest CAGR of 14.40% during 2019-2026.

Get more information on this report : Request Sample Pages

Rise in trend touch-based devices

There is an increase in the number of devices having touch sensors as touch-based devices are easier to access. The touch-based devices require a display panel to operate which in turn helps in the growth of the display devices. Therefore, a wide range of devices in the home appliances category, such as refrigerator, microwave, washing machine, and chimneys are incorporated with displays having touch sensors. In addition, the automobile industry has witnessed rise in providing sophisticated display devices in the vehicle, such as the navigation system, digital dashboard, digital rearview mirrors, heads-up display, and others. Moreover, use of digital signage and touch-based displays in commercial buildings such as malls, theaters, entertainment hubs and others, have increased due to the complex and large architecture of these structures. These displays are incorporated with touch sensors, which the user can use for navigating and extracting other information. Hence, the trend of touch-based devices is driving the interactive display market growth. 

Competitive Analysis

The key players profiled in the report include LG Electronics, NEC Corporation, Sharp Corporation, Samsung Electronics Co. Ltd., ViewSonic Corporation, Planar Systems, Horizon Display Inc., Baanto International Ltd., Crystal Display Systems Ltd., and Elo Touch Solutions occupy a prominent revenue share in the interactive display market. These key players have adopted strategies, such as product portfolio, agreements, and partnership to enhance their position in the interactive display market. 

Interactive Display Market
By Region

2026
North America 
Europe
Asia-Pacific
LAMEA

Asia-Pacific would exhibit the highest CAGR of 13.00% during 2019-2026.

Get more information on this report : Request Sample Pages

Historical Data & Information 

The global interactive display market is highly competitive, owing to the strong presence of existing vendors. Vendors of the interactive display market with extensive technical and financial resources are expected to gain a competitive advantage over their competitors because they can cater to market demands. The competitive environment in this market is expected to get intense as technological innovations, product extensions, and different strategies adopted by key vendors increase.

Key Developments/ Strategies

LG Electronics, NEC Corporation, Sharp Corporation, Samsung Electronics Co. Ltd., ViewSonic Corporation, Planar Systems, Horizon Display Inc., Baanto International Ltd., Crystal Display Systems Ltd., and Elo Touch Solutions occupy a prominent revenue share in the interactive display market. Top market players have adopted various strategies, such as product launch and product development, to expand their foothold in the interactive display market.

  • In August 2022, with the introduction of Sign touch, powered by Samsung, a ground-breaking digital sales center solution and a member of the Sign Build group of companies, Samsung Electronics Co. Ltd. can provide new homebuilders with improved development advertising, content management, customer experience, footfall analytics, & sales performance through a single, user-friendly interactive platform. Netizen preferences for experiencing a new housing complex and, eventually, for researching and purchasing a new house are changing quickly. Consumers no longer accept homogenized sales experiences; instead, they demand personalized, multi-channel, and interactive experiences at every stage, as retail data analytics reveals.
  • In March 2020, NEC Corporation and Sharp Corporation agreed to form a joint venture by merging NEC Display Solutions, Ltd. (NDS), a NEC subsidiary, with Sharp. Sharp and NEC's joint venture will allow both businesses to capitalize on their capabilities while also meeting the demands of their worldwide consumers in terms of visualization.

Key Benefits for Interactive Display Market:

  • This study comprises analytical depiction of the global interactive display market size along with the current trends and future estimations to depict the imminent investment pockets.
  • The overall analysis is determined to understand the profitable trends to gain a stronger foothold.
  • The report presents information related to key drivers, restraints, and opportunities with a detailed impact analysis.
  • The global interactive display market forecast is quantitatively analyzed from 2019 to 2026 to benchmark the financial competency.
  • Porter’s five forces analysis illustrates the potency of the buyers and suppliers in the interactive display industry.
  • The report includes the share of key vendors and market trends.

Interactive Display Market Report Highlights

Aspects Details
By Panel Type
  • Flat Panel
  • Flexible Panel
  • Transparent Panel
By Technology
  • OLED
  • LED
  • LCD
  • QD
By Screen Size
  • Less than 35”
  • 35” to 60”
  • More than 60”
By Application
  • Interactive Table
  • Interactive Monitor
  • Interactive Kiosk
  • Interactive Whiteboard
  • Video Wall
By End User
  • Healthcare
  • Retail
  • BFSI
  • Military & Defense
  • Education
  • Other
By Region
  • North America  (U.S., Canada, Mexico)
  • Europe  (Germany, France, UK, Italy, Rest of Europe)
  • Asia-Pacific  (Japan, China, India, South Korea, Rest of Asia-Pacific)
  • LAMEA  (Latin America, Middle East, Africa)
Key Market Players Planar Systems (Leyard Optoelectronic), Elo Touch Solutions, Inc. (Crestview), SAMSUNG ELECTRONICS CO. LTD., Crystal Display Systems Ltd, NEC Corporation, ViewSonic Corporation, Baanto International Ltd., Sharp Corporation (Foxconn), LG Electronics, Horizon Display Inc
 

Chapter 1:    Introduction

1.1.    Report description
1.2.    Key benefits for stakeholders
1.3.    Key market segments
1.4.    Research methodology

1.4.1.    Primary research
1.4.2.    Secondary research
1.4.3.    Analyst tools and models

Chapter 2:    Executive summary

2.1.    Key findings

2.1.1.    Top impacting factors
2.1.2.    Top investment pockets

2.2.    CXO perspective

Chapter 3:    MARKET OVERVIEW

3.1.    Market definition and scope
3.2.    Parent/Peer Market Overview
3.3.    Key Forces Shaping Interactive Display Market
3.4.    Patent Analysis

3.4.1.    By Region (2018-2026)

3.5.    Market dynamics

3.5.1.    Drivers

3.5.1.1.    Increase in demand for interactive whiteboard in education sector
3.5.1.2.    Rise in adoption of interactive display in retail application
3.5.1.3.    Rise in trend touch-based devices

3.5.2.    Restraint

3.5.2.1.    High cost of new display technologies

3.5.3.    Opportunity

3.5.3.1.    Rise in focus toward adoption of new advance technology

Chapter 4:    Global Interactive Display Market, BY Panel Type

4.1.    Overview
4.2.    Flat Panel

4.2.1.    Key market trends, growth factors, and opportunities
4.2.2.    Market size and forecast, by region
4.2.3.    Market analysis, by country

4.3.    Flexible Panel

4.3.1.    Key market trends, growth factors, and opportunities
4.3.2.    Market size and forecast, by region
4.3.3.    Market analysis, by country

4.4.    Transparent panel display

4.4.1.    Key market trends, growth factors, and opportunities
4.4.2.    Market size and forecast, by region
4.4.3.    Market analysis by country

Chapter 5:    Global Interactive display Market, BY technology

5.1.    Overview
5.2.    OLED

5.2.1.    Key market trends, growth factors, and opportunities
5.2.2.    Market size and forecast, by region
5.2.3.    Market analysis, by country

5.3.    LED

5.3.1.    Key market trends, growth factors, and opportunities
5.3.2.    Market size and forecast, by region
5.3.3.    Market analysis, by country

5.4.    LCD

5.4.1.    Key market trends, growth factors, and opportunities
5.4.2.    Market size and forecast, by region
5.4.3.    Market analysis, by country

5.5.    Quantum dot

5.5.1.    Key market trends, growth factors, and opportunities
5.5.2.    Market size and forecast, by region
5.5.3.    Market analysis, by country

Chapter 6:    Global Interactive display Market, by Screen Size

6.1.    Overview
6.2.    Less than 35

6.2.1.    Key market trends, growth factors, and opportunities
6.2.2.    Market size and forecast, by region
6.2.3.    Market analysis, by country

6.3.    35 to 60

6.3.1.    Key market trends, growth factors, and opportunities
6.3.2.    Market size and forecast, by region
6.3.3.    Market analysis, by country

6.4.    Greater than 60

6.4.1.    Key market trends, growth factors, and opportunities
6.4.2.    Market size and forecast, by region
6.4.3.    Market analysis, by country

Chapter 7:    Global Interactive Display MARKet, BY Application

7.1.    Overview
7.2.    Interactive Kiosk

7.2.1.    Key market trends, growth factors, and opportunities
7.2.2.    Market size and forecast, by region
7.2.3.    Market analysis by country

7.3.    Interactive Whiteboard

7.3.1.    Key market trends, growth factors, and opportunities
7.3.2.    Market size and forecast, by region
7.3.3.    Market analysis by country

7.4.    Interactive Monitor

7.4.1.    Key market trends, growth factors, and opportunities
7.4.2.    Market size and forecast, by region
7.4.3.    Market analysis by country

7.5.    Video Wall

7.5.1.    Key market trends, growth factors, and opportunities
7.5.2.    Market size and forecast, by region
7.5.3.    Market analysis by country

7.6.    Interactive Table

7.6.1.    Key market trends, growth factors and opportunities
7.6.2.    Market size and forecast, by region
7.6.3.    Market analysis by country

Chapter 8:    Global interactive display Market, BY end user

8.1.    Overview
8.2.    Healthcare

8.2.1.    Key market trends, growth factors, and opportunities
8.2.2.    Market size and forecast, by region
8.2.3.    Market analysis, by country

8.3.    Retail

8.3.1.    Key market trends, growth factors, and opportunities
8.3.2.    Market size and forecast, by region
8.3.3.    Market analysis, by country

8.4.    BFSI

8.4.1.    Key market trends, growth factors, and opportunities
8.4.2.    Market size and forecast, by region
8.4.3.    Market analysis, by country

8.1.    Military & defense

8.1.1.    Key market trends, growth factors and opportunities
8.1.2.    Market size and forecast, by region
8.1.3.    Market analysis by country

8.2.    Education

8.2.1.    Key market trends, growth factors and opportunities
8.2.2.    Market size and forecast, by region
8.2.3.    Market analysis by country

8.3.    Others

8.3.1.    Key market trends, growth factors and opportunities
8.3.2.    Market size and forecast, by region
8.3.3.    Market analysis by country

Chapter 9:    global INTERACTIVE display Market, BY Region

9.1.    Overview
9.2.    North America

9.2.1.    Key market trends, growth factors, and opportunities
9.2.2.    Market size and forecast, by panel type
9.2.3.    Market size and forecast, by Technology
9.2.4.    Market size and forecast, by screen size
9.2.5.    Market size and forecast, by application
9.2.6.    Market size and forecast, by end-user
9.2.7.    Market analysis by country

9.2.7.1.    U.S.

9.2.7.1.1.    Market size and forecast, by panel type
9.2.7.1.2.    Market size and forecast, by technology
9.2.7.1.3.    Market size and forecast, by screen size
9.2.7.1.4.    Market size and forecast, by application
9.2.7.1.5.    Market size and forecast, by end-user

9.2.7.2.    Canada

9.2.7.2.1.    Market size and forecast, by type
9.2.7.2.2.    Market size and forecast, by technology
9.2.7.2.3.    Market size and forecast, by screen size
9.2.7.2.4.    Market size and forecast, by application
9.2.7.2.5.    Market size and forecast, by end-user

9.2.7.3.    Mexico

9.2.7.3.1.    Market size and forecast, by type
9.2.7.3.2.    Market size and forecast, by technology
9.2.7.3.3.    Market size and forecast, by screen size
9.2.7.3.4.    Market size and forecast, by application
9.2.7.3.5.    Market size and forecast, by end-user

9.3.    Europe

9.3.1.    Key market trends, growth factors, and opportunities
9.3.2.    Market size and forecast, by panel type
9.3.3.    Market size and forecast, by Technology
9.3.4.    Market size and forecast, by screen size
9.3.5.    Market size and forecast, by application
9.3.6.    Market size and forecast, by end-user
9.3.7.    Market analysis by country

9.3.7.1.    Germany

9.3.7.1.1.    Market size and forecast, by type
9.3.7.1.2.    Market size and forecast, by technology
9.3.7.1.3.    Market size and forecast, by screen size
9.3.7.1.4.    Market size and forecast, by application
9.3.7.1.5.    Market size and forecast, by end-user

9.3.7.2.    France

9.3.7.2.1.    Market size and forecast, by type
9.3.7.2.2.    Market size and forecast, by technology
9.3.7.2.3.    Market size and forecast, by screen size
9.3.7.2.4.    Market size and forecast, by application
9.3.7.2.5.    Market size and forecast, by end-user

9.3.7.3.    UK

9.3.7.3.1.    Market size and forecast, by type
9.3.7.3.2.    Market size and forecast, by technology
9.3.7.3.3.    Market size and forecast, by screen size
9.3.7.3.4.    Market size and forecast, by application
9.3.7.3.5.    Market size and forecast, by end-user

9.3.7.4.    Italy

9.3.7.4.1.    Market size and forecast, by type
9.3.7.4.2.    Market size and forecast, by technology
9.3.7.4.3.    Market size and forecast, by screen size
9.3.7.4.4.    Market size and forecast, by application
9.3.7.4.5.    Market size and forecast, by end-user

9.3.7.5.    Rest of Europe

9.3.7.5.1.    Market size and forecast, by type
9.3.7.5.2.    Market size and forecast, by technology
9.3.7.5.3.    Market size and forecast, by screen size
9.3.7.5.4.    Market size and forecast, by application
9.3.7.5.5.    Market size and forecast, by end-user

9.4.    Asia-Pacific

9.4.1.    Key market trends, growth factors, and opportunities
9.4.2.    Market size and forecast, by type
9.4.3.    Market size and forecast, by Technology
9.4.4.    Market size and forecast, by screen size
9.4.5.    Market size and forecast, by application
9.4.6.    Market size and forecast, by end-user
9.4.7.    Market analysis by country

9.4.7.1.    Japan

9.4.7.1.1.    Market size and forecast, by type
9.4.7.1.2.    Market size and forecast, by technology
9.4.7.1.3.    Market size and forecast, by screen size
9.4.7.1.4.    Market size and forecast, by application
9.4.7.1.5.    Market size and forecast, by end-user

9.4.7.2.    China

9.4.7.2.1.    Market size and forecast, by type
9.4.7.2.2.    Market size and forecast, by technology
9.4.7.2.3.    Market size and forecast, by screen size
9.4.7.2.4.    Market size and forecast, by application
9.4.7.2.5.    Market size and forecast, by end-user

9.4.7.3.    India

9.4.7.3.1.    Market size and forecast, by type
9.4.7.3.2.    Market size and forecast, by technology
9.4.7.3.3.    Market size and forecast, by screen size
9.4.7.3.4.    Market size and forecast, by application
9.4.7.3.5.    Market size and forecast, by end-user

9.4.7.4.    South Korea

9.4.7.4.1.    Market size and forecast, by type
9.4.7.4.2.    Market size and forecast, by technology
9.4.7.4.3.    Market size and forecast, by screen size
9.4.7.4.4.    Market size and forecast, by application
9.4.7.4.5.    Market size and forecast, by end-user

9.4.7.5.    Rest of Asia-Pacific

9.4.7.5.1.    Market size and forecast, by type
9.4.7.5.2.    Market size and forecast, by technology
9.4.7.5.3.    Market size and forecast, by screen size
9.4.7.5.4.    Market size and forecast, by application
9.4.7.5.5.    Market size and forecast, by end-user

9.5.    LAMEA

9.5.1.    Key market trends, growth factors, and opportunities
9.5.2.    Market size and forecast, by type
9.5.3.    Market size and forecast, by Technology
9.5.4.    Market size and forecast, by screen size
9.5.5.    Market size and forecast, by application
9.5.6.    Market size and forecast, by end-user
9.5.7.    Market analysis by country

9.5.7.1.    Latin America

9.5.7.1.1.    Market size and forecast, by panel type
9.5.7.1.2.    Market size and forecast, by technology
9.5.7.1.3.    Market size and forecast, by screen size
9.5.7.1.4.    Market size and forecast, by application
9.5.7.1.5.    Market size and forecast, by end-user

9.5.7.2.    Middle East

9.5.7.2.1.    Market size and forecast, by panel type
9.5.7.2.2.    Market size and forecast, by technology
9.5.7.2.3.    Market size and forecast, by screen size
9.5.7.2.4.    Market size and forecast, by application
9.5.7.2.5.    Market size and forecast, by end-user

9.5.7.3.    Africa

9.5.7.3.1.    Market size and forecast, by panel type
9.5.7.3.2.    Market size and forecast, by technology
9.5.7.3.3.    Market size and forecast, by screen size
9.5.7.3.4.    Market size and forecast, by application
9.5.7.3.5.    Market size and forecast, by end-user

Chapter 10:    COMPETITIVE LANDSCAPE

10.1.    INTRODUCTION

10.1.1.    MARKET PLAYER POSITIONING, 2019

10.2.    Top Winning Strategies
10.3.    PRODUCT MAPPING OF TOP 10 PLAYER
10.4.    COMPETITIVE DASHBOARD
10.5.    COMPETITIVE HEATMAP
10.6.    KEY DEVELOPMENTS

10.6.1.    New product launches
10.6.2.    Other developments

Chapter 11:    Company Profile

11.1.    Baanto International Ltd.

11.1.1.    Company overview
11.1.2.    Key Executives
11.1.3.    Company snapshot
11.1.4.    Product portfolio
11.1.5.    Key strategic moves and developments

11.2.    Crystal Display Systems Ltd

11.2.1.    Company overview
11.2.2.    Key Executives
11.2.3.    Company snapshot
11.2.4.    Product portfolio
11.2.5.    Key strategic moves and developments

11.3.    Elo Touch Solutions, Inc. (Crestview)

11.3.1.    Company overview
11.3.2.    Key Executives
11.3.3.    Company snapshot
11.3.4.    Product portfolio
11.3.5.    Key strategic moves and developments

11.4.    Horizon Display Inc.

11.4.1.    Company overview
11.4.2.    Key Executives
11.4.3.    Company snapshot
11.4.4.    Product portfolio
11.4.5.    Key strategic moves and developments

11.5.    LG Electronics

11.5.1.    Company overview
11.5.2.    Key Executives
11.5.3.    Company snapshot
11.5.4.    Operating business segments
11.5.5.    Product portfolio
11.5.6.    R&D Expenditure
11.5.7.    Business performance
11.5.8.    Key strategic moves and developments

11.6.    NEC Corporation

11.6.1.    Company overview
11.6.2.    Key Executives
11.6.3.    Company snapshot
11.6.4.    Operating business segments
11.6.5.    Product portfolio
11.6.6.    R&D Expenditure
11.6.7.    Business performance
11.6.8.    Key strategic moves and developments

11.7.    Sharp Corporation (Foxconn)

11.7.1.    Company overview
11.7.2.    Key Executives
11.7.3.    Company snapshot
11.7.4.    Operating business segments
11.7.5.    Product portfolio
11.7.6.    R&D Expenditure
11.7.7.    Business performance
11.7.8.    Key strategic moves and developments

11.8.    SAMSUNG ELECTRONICS CO. LTD.

11.8.1.    Company overview
11.8.2.    Key Executives
11.8.3.    Company snapshot
11.8.4.    Operating business segments
11.8.5.    Product portfolio
11.8.6.    R&D Expenditure
11.8.7.    Business performance
11.8.8.    Key strategic moves and developments

11.9.    ViewSonic Corporation

11.9.1.    Company overview
11.9.2.    Key Executives
11.9.3.    Company snapshot
11.9.4.    Product portfolio
11.9.5.    Key strategic moves and developments

11.10.    Planar Systems (Leyard Optoelectronic)

11.10.1.    Company overview
11.10.2.    Key Executives
11.10.3.    Company snapshot
11.10.4.    Product portfolio
11.10.5.    Key strategic moves and developments

LIST OF TABLES

TABLE 01.    GLOBAL INTERACTIVE DISPLAY MARKET, BY TYPE, 2018-2026 ($MILLION)
TABLE 02.    FLAT PANEL INTERACTIVE DISPLAY MARKET, BY REGION, 2018-2026 ($MILLION)
TABLE 03.    FLEXIBLE PANEL INTERACTIVE DISPLAY MARKET, BY REGION, 2018-2026 ($MILLION)
TABLE 04.    TRANSPARENT PANEL DISPLAY INTERACTIVE DISPLAY MARKET, BY REGION 2018-2026 ($BILLION)
TABLE 05.    GLOBAL INTERACTIVE DISPLAY MARKET, BY TECHNOLOGY, 2018-2026 ($MILLION)
TABLE 06.    GLOBAL INTERACTIVE DISPLAY MARKET FOR OLED, BY REGION, 2018-2026 ($MILLION)
TABLE 07.    GLOBAL INTERACTIVE DISPLAY MARKET FOR LED, BY REGION, 2018-2026 ($MILLION)
TABLE 08.    INTERACTIVE DISPLAY MARKET FOR LCD, BY REGION, 2018-2026 ($MILLION)
TABLE 09.    INTERACTIVE DISPLAY MARKET FOR QUANTUM DOT, BY REGION, 2018-2026 ($MILLION)
TABLE 10.    GLOBAL INTERACTIVE DISPLAY MARKET REVENUE, BY SCREEN SIZE, 2018-2026 ($MILLION)
TABLE 11.    GLOBAL INTERACTIVE DISPLAY MARKET REVENUE FOR LESS THAN 35 SCREEN SIZE, BY REGION, 2018-2026 ($MILLION)
TABLE 12.    INTERACTIVE DISPLAY MARKET REVENUE FOR 35 TO 60 SCREEN SIZE, BY REGION, 2018-2026 ($MILLION)
TABLE 13.    GLOBAL INTERACTIVE DISPLAY MARKET REVENUE FOR GREATER THAN 60 SCREEN SIZE, BY REGION, 2018-2026 ($MILLION)
TABLE 14.    GLOBAL INTERACTIVE DISPLAY MARKET, BY APPLICATION, 2017-2025($BILLION)
TABLE 15.    INTERACTIVE DISPLAY MARKET REVENUE FOR INTERACTIVE KIOSK, BY REGION 2018–2026 ($BILLION)
TABLE 16.    INTERACTIVE DISPLAY MARKET REVENUE FOR INTERACTIVE WHITEBOARD, BY REGION 2018–2026 ($BILLION)
TABLE 17.    INTERACTIVE DISPLAY MARKET REVENUE FOR INTERACTIVE MONITOR, BY REGION 2018–2026 ($BILLION)
TABLE 18.    INTERACTIVE DISPLAY MARKET REVENUE FOR VIDEO WALL, BY REGION 2018–2026 ($BILLION)
TABLE 19.    INTERACTIVE DISPLAY MARKET REVENUE FOR INTERACTIVE TABLE, BY REGION 2018-2026 ($BILLION)
TABLE 20.    GLOBAL INTERACTIVE DISPLAY MARKET REVENUE, BY END USER, 2018-2026 ($MILLION)
TABLE 21.    HEALTHCARE INTERACTIVE DISPLAY MARKET REVENUE, BY REGION, 2018-2026 ($MILLION)
TABLE 22.    RETAIL INTERACTIVE DISPLAY MARKET REVENUE, BY REGION, 2018-2026 ($MILLION)
TABLE 23.    BFSI GLOBAL INTERACTIVE DISPLAY MARKET REVENUE, BY REGION, 2018-2026 ($MILLION)
TABLE 01.    INTERACTIVE DISPLAY MARKET REVENUE FOR MILITARY & DEFENSE, BY REGION 2018–2026 ($BILLION)
TABLE 02.    INTERACTIVE DISPLAY MARKET REVENUE FOR EDUCATION, BY REGION 2017–2025 ($BILLION)
TABLE 03.    INTERACTVIE DISPLAY MARKET REVENUE FOR OTHERS, BY REGION, 2018–2026 ($MILLION)
TABLE 04.    NORTH AMERICA INTERACTIVE DISPLAY MARKET, BY PANEL TYPE, 2018-2026 ($MILLION)
TABLE 05.    NORTH AMERICA INTERACTIVE DISPLAY MARKET, BY TECHNOLOGY, 2018-2026 ($MILLION)
TABLE 06.    NORTH AMERICA INTERACTIVE DISPLAY MARKET, BY SCREEN SIZE, 2018-2026 ($MILLION)
TABLE 07.    NORTH AMERICA INTERACTIVE DISPLAY MARKET, BY APPLICATION, 2018-2026 ($MILLION)
TABLE 08.    NORTH AMERICA INTERACTIVE DISPLAY MARKET, BY END-USER, 2018-2026 ($MILLION)
TABLE 09.    U.S. INTERACTIVE DISPLAY MARKET, BY TYPE, 2018-2026 ($MILLION)
TABLE 10.    U.S. INTERACTIVE DISPLAY MARKET, BY TECHNOLOGY, 2018-2026 ($MILLION)
TABLE 11.    U.S. INTERACTIVE DISPLAY MARKET, BY SCREEN SIZE, 2018-2026 ($MILLION)
TABLE 12.    U.S. INTERACTIVE DISPLAY MARKET, BY APPLICATION, 2018-2026 ($MILLION)
TABLE 13.    U.S. INTERACTIVE DISPLAY MARKET, BY END-USER, 2018-2026 ($MILLION)
TABLE 14.    CANADA INTERACTIVE DISPLAY MARKET, BY TYPE, 2018-2026 ($MILLION)
TABLE 15.    CANADA INTERACTIVE DISPLAY MARKET, BY TECHNOLOGY, 2018-2026 ($MILLION)
TABLE 16.    CANADA INTERACTIVE DISPLAY MARKET, BY SCREEN SIZE, 2018-2026 ($MILLION)
TABLE 17.    CANADA INTERACTIVE DISPLAY MARKET, BY APPLICATION, 2018-2026 ($MILLION)
TABLE 18.    CANADA INTERACTIVE DISPLAY MARKET, BY END-USER, 2018-2026 ($MILLION)
TABLE 19.    MEXICO INTERACTIVE DISPLAY MARKET, BY TYPE, 2018-2026 ($MILLION)
TABLE 20.    MEXICO INTERACTIVE DISPLAY MARKET, BY TECHNOLOGY, 2018-2026 ($MILLION)
TABLE 21.    MEXICO INTERACTIVE DISPLAY MARKET, BY SCREEN SIZE, 2018-2026 ($MILLION)
TABLE 22.    MEXICO INTERACTIVE DISPLAY MARKET, BY APPLICATION, 2018-2026 ($MILLION)
TABLE 23.    MEXICO INTERACTIVE DISPLAY MARKET, BY END-USER, 2018-2026 ($MILLION)
TABLE 24.    EUROPE INTERACTIVE DISPLAY MARKET, BY TYPE, 2018-2026 ($MILLION)
TABLE 25.    EUROPE INTERACTIVE DISPLAY MARKET, BY TECHNOLOGY, 2018-2026 ($MILLION)
TABLE 26.    EUROPE INTERACTIVE DISPLAY MARKET, BY SCREEN , 2018-2026 ($MILLION)
TABLE 27.    EUROPE INTERACTIVE DISPLAY MARKET, BY APPLICATION, 2018-2026 ($MILLION)
TABLE 28.    EUROPE INTERACTIVE DISPLAY MARKET, BY END-USER, 2018-2026 ($MILLION)
TABLE 29.    GERMANY INTERACTIVE DISPLAY MARKET, BY TYPE, 2018-2026 ($MILLION)
TABLE 30.    GERMANY INTERACTIVE DISPLAY MARKET, BY TECHNOLOGY, 2018-2026 ($MILLION)
TABLE 31.    GERMANY INTERACTIVE DISPLAY MARKET, BY SCREEN SIZE, 2018-2026 ($MILLION)
TABLE 32.    GERMANY INTERACTIVE DISPLAY MARKET, BY APPLICATION, 2018-2026 ($MILLION)
TABLE 33.    GERMANY INTERACTIVE DISPLAY MARKET, BY END-USER, 2018-2026 ($MILLION)
TABLE 34.    FRANCE INTERACTIVE DISPLAY MARKET, BY TYPE, 2018-2026 ($MILLION)
TABLE 35.    FRANCE INTERACTIVE DISPLAY MARKET, BY TECHNOLOGY, 2018-2026 ($MILLION)
TABLE 36.    FRANCE INTERACTIVE DISPLAY MARKET, BY SCREEN SIZE, 2018-2026 ($MILLION)
TABLE 37.    FRANCE INTERACTIVE DISPLAY MARKET, BY APPLICATION, 2018-2026 ($MILLION)
TABLE 38.    FRANCE INTERACTIVE DISPLAY MARKET, BY END-USER, 2018-2026 ($MILLION)
TABLE 39.    UK INTERACTIVE DISPLAY MARKET, BY TYPE, 2018-2026 ($MILLION)
TABLE 40.    UK INTERACTIVE DISPLAY MARKET, BY TECHNOLOGY, 2018-2026 ($MILLION)
TABLE 41.    UK INTERACTIVE DISPLAY MARKET, BY SCREEN SIZE, 2018-2026 ($MILLION)
TABLE 42.    UK INTERACTIVE DISPLAY MARKET, BY APPLICATION, 2018-2026 ($MILLION)
TABLE 43.    UK INTERACTIVE DISPLAY MARKET, BY END-USER, 2018-2026 ($MILLION)
TABLE 44.    ITALY INTERACTIVE DISPLAY MARKET, BY TYPE, 2018-2026 ($MILLION)
TABLE 45.    ITALY INTERACTIVE DISPLAY MARKET, BY TECHNOLOGY, 2018-2026 ($MILLION)
TABLE 46.    ITALY INTERACTIVE DISPLAY MARKET, BY SCREEN SIZE, 2018-2026 ($MILLION)
TABLE 47.    ITALY INTERACTIVE DISPLAY MARKET, BY APPLICATION, 2018-2026 ($MILLION)
TABLE 48.    ITALY INTERACTIVE DISPLAY MARKET, BY END-USER, 2018-2026 ($MILLION)
TABLE 49.    REST OF EUROPE INTERACTIVE DISPLAY MARKET, BY TYPE, 2018-2026 ($MILLION)
TABLE 50.    REST OF EUROPE INTERACTIVE DISPLAY MARKET, BY TECHNOLOGY, 2018-2026 ($MILLION)
TABLE 51.    REST OF EUROPE INTERACTIVE DISPLAY MARKET, BY SCREEN SIZE, 2018-2026 ($MILLION)
TABLE 52.    REST OF EUROPE INTERACTIVE DISPLAY MARKET, BY APPLICATION, 2018-2026 ($MILLION)
TABLE 53.    REST OF EUROPE INTERACTIVE DISPLAY MARKET, BY END-USER, 2018-2026 ($MILLION)
TABLE 54.    ASIA-PACIFIC INTERACTIVE DISPLAY MARKET, BY TYPE, 2018-2026 ($MILLION)
TABLE 55.    ASIA-PACIFIC INTERACTIVE DISPLAY MARKET, BY TECHNOLOGY, 2018-2026 ($MILLION)
TABLE 56.    ASIA-PACIFIC INTERACTIVE DISPLAY MARKET, BY SCREEN SIZE, 2018-2026 ($MILLION)
TABLE 57.    ASIA-PACIFIC INTERACTIVE DISPLAY MARKET, BY APPLICATION, 2018-2026 ($MILLION)
TABLE 58.    ASIA-PACIFIC INTERACTIVE DISPLAY MARKET, BY END-USER, 2018-2026 ($MILLION)
TABLE 59.    JAPAN INTERACTIVE DISPLAY MARKET, BY TYPE, 2018-2026 ($MILLION)
TABLE 60.    JAPAN INTERACTIVE DISPLAY MARKET, BY TECHNOLOGY, 2018-2026 ($MILLION)
TABLE 61.    JAPAN INTERACTIVE DISPLAY MARKET, BY SCREEN SIZE, 2018-2026 ($MILLION)
TABLE 62.    JAPAN INTERACTIVE DISPLAY MARKET, BY APPLICATION, 2018-2026 ($MILLION)
TABLE 63.    JAPAN INTERACTIVE DISPLAY MARKET, BY END-USER, 2018-2026 ($MILLION)
TABLE 64.    CHINA INTERACTIVE DISPLAY MARKET, BY TYPE, 2018-2026 ($MILLION)
TABLE 65.    CHINA INTERACTIVE DISPLAY MARKET, BY TECHNOLOGY, 2018-2026 ($MILLION)
TABLE 66.    CHINA INTERACTIVE DISPLAY MARKET, BY SCREEN SIZE, 2018-2026 ($MILLION)
TABLE 67.    CHINA INTERACTIVE DISPLAY MARKET, BY APPLICATION, 2018-2026 ($MILLION)
TABLE 68.    CHINA INTERACTIVE DISPLAY MARKET, BY END-USER, 2018-2026 ($MILLION)
TABLE 69.    INDIA INTERACTIVE DISPLAY MARKET, BY TYPE, 2018-2026 ($MILLION)
TABLE 70.    INDIA INTERACTIVE DISPLAY MARKET, BY TECHNOLOGY, 2018-2026 ($MILLION)
TABLE 71.    INDIA INTERACTIVE DISPLAY MARKET, BY SCREEN SIZE, 2018-2026 ($MILLION)
TABLE 72.    INDIA INTERACTIVE DISPLAY MARKET, BY APPLICATION, 2018-2026 ($MILLION)
TABLE 73.    INDIA INTERACTIVE DISPLAY MARKET, BY END-USER, 2018-2026 ($MILLION)
TABLE 74.    SOUTH KOREA INTERACTIVE DISPLAY MARKET, BY TYPE, 2018-2026 ($MILLION)
TABLE 75.    SOUTH KOREA INTERACTIVE DISPLAY MARKET, BY TECHNOLOGY, 2018-2026 ($MILLION)
TABLE 76.    SOUTH KOREA INTERACTIVE DISPLAY MARKET, BY SCREEN SIZE, 2018-2026 ($MILLION)
TABLE 77.    SOUTH KOREA INTERACTIVE DISPLAY MARKET, BY APPLICATION, 2018-2026 ($MILLION)
TABLE 78.    SOUTH KOREA INTERACTIVE DISPLAY MARKET, BY END-USER, 2018-2026 ($MILLION)
TABLE 79.    REST OF ASIA-PACIFIC INTERACTIVE DISPLAY MARKET, BY TYPE, 2018-2026 ($MILLION)
TABLE 80.    REST OF ASIA-PACIFIC INTERACTIVE DISPLAY MARKET, BY TECHNOLOGY, 2018-2026 ($MILLION)
TABLE 81.    REST OF ASIA-PACIFIC INTERACTIVE DISPLAY MARKET, BY SCREEN SIZE, 2018-2026 ($MILLION)
TABLE 82.    REST OF ASIA-PACIFIC INTERACTIVE DISPLAY MARKET, BY APPLICATION, 2018-2026 ($MILLION)
TABLE 83.    REST OF ASIA-PACIFIC INTERACTIVE DISPLAY MARKET, BY END-USER, 2018-2026 ($MILLION)
TABLE 84.    LAMEA INTERACTIVE DISPLAY MARKET, BY TYPE, 2018-2026 ($MILLION)
TABLE 85.    LAMEA INTERACTIVE DISPLAY MARKET, BY TECHNOLOGY, 2018-2026 ($MILLION)
TABLE 86.    LAMEA INTERACTIVE DISPLAY MARKET, BY SCREEN SIZE, 2018-2026 ($MILLION)
TABLE 87.    LAMEA INTERACTIVE DISPLAY MARKET, BY APPLICATION, 2018-2026 ($MILLION)
TABLE 88.    LAMEA INTERACTIVE DISPLAY MARKET, BY END-USER, 2018-2026 ($MILLION)
TABLE 89.    LATIN AMERICA INTERACTIVE DISPLAY MARKET, BY PANEL TYPE, 2018-2026 ($MILLION)
TABLE 90.    LATIN AMERICA INTERACTIVE DISPLAY MARKET, BY TECHNOLOGY, 2018-2026 ($MILLION)
TABLE 91.    LATIN AMERICA INTERACTIVE DISPLAY MARKET, BY SCREEN SIZE, 2018-2026 ($MILLION)
TABLE 92.    LATIN AMERICA INTERACTIVE DISPLAY MARKET, BY APPLICATION, 2018-2026 ($MILLION)
TABLE 93.    LATIN AMERICA INTERACTIVE DISPLAY MARKET, BY END-USER, 2018-2026 ($MILLION)
TABLE 94.    MIDDLE EAST INTERACTIVE DISPLAY MARKET, BY PANEL TYPE, 2018-2026 ($MILLION)
TABLE 95.    MIDDLE EAST INTERACTIVE DISPLAY MARKET, BY TECHNOLOGY, 2018-2026 ($MILLION)
TABLE 96.    MIDDLE EAST INTERACTIVE DISPLAY MARKET, BY SCREEN SIZE, 2018-2026 ($MILLION)
TABLE 97.    MIDDLE EAST INTERACTIVE DISPLAY MARKET, BY APPLICATION, 2018-2026 ($MILLION)
TABLE 98.    MIDDLE EAST INTERACTIVE DISPLAY MARKET, BY END-USER, 2018-2026 ($MILLION)
TABLE 99.    AFRICA INTERACTIVE DISPLAY MARKET, BY PANEL TYPE, 2018-2026 ($MILLION)
TABLE 100.    AFRICA INTERACTIVE DISPLAY MARKET, BY TECHNOLOGY, 2018-2026 ($MILLION)
TABLE 101.    AFRICA INTERACTIVE DISPLAY MARKET, BY SCREEN SIZE, 2018-2026 ($MILLION)
TABLE 102.    AFRICA INTERACTIVE DISPLAY MARKET, BY APPLICATION, 2018-2026 ($MILLION)
TABLE 103.    AFRICA INTERACTIVE DISPLAY MARKET, BY END-USER, 2018-2026 ($MILLION)
TABLE 104.    KEY NEW PRODUCT LAUNCHES (2016-2019)
TABLE 105.    OTHER KEY DEVELOPMENTS (2016-2019)
TABLE 106.    BAANTO INTERNATIONAL LTD.: KEY EXECUTIVES
TABLE 107.    BAANTO INTERNATIONAL LTD.: COMPANY SNAPSHOT
TABLE 108.    BAANTO INTERNATIONAL LTD.: PRODUCT PORTFOLIO
TABLE 109.    CRYSTAL DISPLAY SYSTEMS LTD: KEY EXECUTIVES
TABLE 110.    CRYSTAL DISPLAY SYSTEMS LTD: COMPANY SNAPSHOT
TABLE 111.    CRYSTAL DISPLAY SYSTEMS LTD: PRODUCT PORTFOLIO
TABLE 112.    ELO TOUCH SOLUTIONS, INC.: KEY EXECUTIVES
TABLE 113.    ELO TOUCH SOLUTIONS, INC.: COMPANY SNAPSHOT
TABLE 114.    ELO TOUCH SOLUTIONS, INC.: PRODUCT PORTFOLIO
TABLE 115.    HORIZON DISPLAY INC.: KEY EXECUTIVES
TABLE 116.    HORIZON DISPLAY INC.: COMPANY SNAPSHOT
TABLE 117.    HORIZON DISPLAY INC.: PRODUCT PORTFOLIO
TABLE 118.    LG ELECTRONICS: KEY EXECUTIVES
TABLE 119.    LG ELECTRONICS.: COMPANY SNAPSHOT
TABLE 120.    LG ELECTRONICS.: OPERATING SEGMENTS
TABLE 121.    LG ELECTRONICS.: PRODUCT PORTFOLIO
TABLE 122.    LG ELECTRONICS: R&D EXPENDITURE, 2016–2018 ($MILLION)
TABLE 123.    LG ELECTRONICS: NET SALES, 2016–2018 ($MILLION)
TABLE 124.    LG ELECTRONICS: SEGMENT, 2018 ($MILLION)
TABLE 125.    LG ELECTRONICS: REGION, 2018 ($MILLION)
TABLE 126.    LG ELECTRONICS.: KEY STRATEGIC MOVES AND DEVELOPMENTS
TABLE 127.    LG ELECTRONICS: KEY EXECUTIVES
TABLE 128.    NEC CORPORATION:  COMPANY SNAPSHOT
TABLE 129.    NEC CORPORATION: PRODUCT CATEGORY
TABLE 130.    NEC CORPORATION: PRODUCT PORTFOLIO
TABLE 131.    NEC CORPORATION: R&D EXPENDITURE, 2016–2018 ($MILLION)
TABLE 132.    NEC CORPORATION: NET SALES, 2016–2018 ($MILLION)
TABLE 133.    NEC CORPORATION: SEGMENT, 2018 ($MILLION)
TABLE 134.    NEC CORPORATION: REGION, 2018 ($MILLION)
TABLE 135.    NEC CORPORATION: KEY STRATEGIC MOVES AND DEVELOPMENTS
TABLE 136.    SHARP CORPORATION: KEY EXECUTIVES
TABLE 137.    SHARP CORPORATION: COMPANY SNAPSHOT
TABLE 138.    SHARP CORPORATION: OPERATING SEGMENTS
TABLE 139.    SHARP CORPORATION: PRODUCT PORTFOLIO
TABLE 140.    SHARP CORPORATION: R&D EXPENDITURE, 2016–2018 ($MILLION)
TABLE 141.    SHARP CORPORATION: REVENUE, 2016–2018 ($MILLION)
TABLE 142.    SHARP CORPORATION: SEGMENT, 2018 ($MILLION)
TABLE 143.    SHARP CORPORATION: REGION, 2018 ($MILLION)
TABLE 144.    SHARP CORPORATION: KEY STRATEGIC MOVES AND DEVELOPMENTS
TABLE 145.    SAMSUNG ELECTRONICS CO. LTD.: KEY EXECUTIVES
TABLE 146.    SAMSUNG ELECTRONICS CO. LTD.: COMPANY SNAPSHOT
TABLE 147.    SAMSUNG ELECTRONICS CO. LTD.: OPERATING SEGMENTS
TABLE 148.    SAMSUNG ELECTRONICS CO. LTD.: PRODUCT PORTFOLIO
TABLE 149.    SAMSUNG ELECTRONICS CO. LTD: R&D EXPENDITURE, 2016–2018 ($MILLION)
TABLE 150.    SAMSUNG ELECTRONICS CO. LTD.: NET SALES, 2016–2018 ($MILLION)
TABLE 151.    SAMSUNG ELECTRONICS CO. LTD.: SEGMENT, 2018 ($MILLION)
TABLE 152.    SAMSUNG ELECTRONICS CO. LTD.: REGION, 2018 ($MILLION)
TABLE 153.    SAMSUNG ELECTRONICS CO. LTD.: KEY STRATEGIC MOVES AND DEVELOPMENTS
TABLE 154.    VIEWSONIC CORPORATION: KEY EXECUTIVES
TABLE 155.    VIEWSONIC CORPORATION: COMPANY SNAPSHOT
TABLE 156.    VIEWSONIC CORPORATION: PRODUCT PORTFOLIO
TABLE 157.    VIEWSONIC CORPORATION: KEY STRATEGIC MOVES AND DEVELOPMENTS
TABLE 158.    PLANAR SYSTEMS: KEY EXECUTIVES
TABLE 159.    PLANAR SYSTEMS: COMPANY SNAPSHOT
TABLE 160.    PLANAR SYSTEMS: PRODUCT PORTFOLIO
TABLE 161.    PLANAR SYSTEMS: KEY STRATEGIC MOVES AND DEVELOPMENTS

LIST OF FIGURES

FIGURE 01.    KEY MARKET SEGMENTS
FIGURE 02.    GLOBAL INTERACTIVE DISPLAY MARKET: EXECUTIVE SUMMARY
FIGURE 03.    TOP IMPACTING FACTORS
FIGURE 04.    TOP INVESTMENT POCKETS
FIGURE 05.    PARENT/PEER MARKET OVERVIEW
FIGURE 06.    HIGH BARGAINING POWER OF SUPPLIERS
FIGURE 07.    MODERATE THREAT OF NEW ENTRANTS
FIGURE 08.    MODERATE THREAT OF SUBSTITUTES
FIGURE 09.    HIGH INTENSITY OF RIVALRY
FIGURE 10.    HIGH BARGAINING POWER OF BUYERS
FIGURE 11.    PATENT ANALYSIS, BY COUNTRY
FIGURE 12.    GLOBAL INTERACTIVE DISPLAY MARKET, BY TYPE, 2018-2026
FIGURE 13.    COMPARATIVE SHARE ANALYSIS OF FLAT PANEL INTERACTIVE DISPLAY MARKET, BY COUNTRY, 2018 & 2026(%)
FIGURE 14.    COMPARATIVE SHARE ANALYSIS OF FLEXIBLE PANEL INTERACTIVE DISPLAY MARKET, BY COUNTRY, 2018 & 2026(%)
FIGURE 15.    COMPARATIVE SHARE ANALYSIS OF TRANSPARENT PANEL DISPLAY INTERACTIVE DISPLAY MARKET, BY COUNTRY, 2018 - 2026 (%)
FIGURE 16.    GLOBAL INTERACTIVE DISPLAY MARKET, BY TECHNOLOGY, 2018-2026
FIGURE 17.    COMPARATIVE SHARE ANALYSIS OF GLOBAL INTERACTIVE DISPLAY MARKET FOR OLED, BY COUNTRY,  (%)
FIGURE 18.    COMPARATIVE SHARE ANALYSIS OF GLOBAL INTERACTIVE DISPLAY MARKET FOR LED, BY COUNTRY,  2018 & 2026(%)
FIGURE 19.    COMPARATIVE SHARE ANALYSIS OF INTERACTIVE DISPLAY MARKET FOR LCD, BY COUNTRY, (%)
FIGURE 20.    COMPARATIVE SHARE ANALYSIS OF INTERACTIVE DISPLAY MARKET FOR QUANTUM DOT, BY COUNTRY, 2018 & 2026
FIGURE 21.    GLOBAL INTERACTIVE DISPLAY MARKET SHARE, BY SCREEN SIZE, 2018-2026 (%)
FIGURE 22.    COMPARATIVE SHARE ANALYSIS OF GLOBAL INTERACTIVE DISPLAY MARKET FOR LESS THAN 35 SCREEN SIZE, BY COUNTRY, 2018 & 2026 (%)
FIGURE 23.    COMPARATIVE SHARE ANALYSIS OF GLOBAL INTERACTIVE DISPLAY MARKET FOR 35 TO 60 SCREEN SIZE, BY COUNTRY, 2018 & 2026 (%)
FIGURE 24.    COMPARATIVE SHARE ANALYSIS OF GLOBAL INTERACTIVE DISPLAY MARKET FOR GREATER THAN 60 SCREEN SIZE, BY COUNTRY, 2018 & 2026 (%)
FIGURE 25.    GLOBAL INTERACTIVE DISPLAY MARKET SHARE, BY APPLICATION, 2017–2025 (%)
FIGURE 26.    COMPARATIVE SHARE ANALYSIS OF INTERACTIVE DISPLAY MARKET FOR INTERACTIVE KIOSK, BY COUNTRY, 2018 & 2026 (%)
FIGURE 27.    COMPARATIVE SHARE ANALYSIS OF INTERACTVIE DISPLAY MARKET FOR INTERACTIVE WHITEBOARD, BY COUNTRY, 2017 & 2025 (%)
FIGURE 28.    COMPARATIVE SHARE ANALYSIS OF INTERACTIVE DISPLAY MARKET FOR INTERACTIVE MONITORS, BY COUNTRY, 2017 & 2025 (%)
FIGURE 29.    COMPARATIVE SHARE ANALYSIS OF INTERACTIVE DISPLAY MARKET FOR VIDEO WALL, BY COUNTRY, 2017 & 2025 (%)
FIGURE 30.    COMPARATIVE SHARE ANALYSIS OF INTERACTIVE DISPLAY MARKET FOR INTERACTIVE TABLE, BY COUNTRY, 2017 & 2025 (%)
FIGURE 31.    GLOBAL INTERACTIVE DISPLAY MARKET, BY END USER, 2018-2026
FIGURE 32.    COMPARATIVE SHARE ANALYSIS OF HEALTHCARE GLOBAL INTERACTIVE DISPLAY MARKET, BY COUNTRY, 2018 & 2026
FIGURE 33.    COMPARATIVE SHARE ANALYSIS OF RETAIL GLOBAL INTERACTIVE DISPLAY MARKET, BY COUNTRY,  2018 & 2026(%)
FIGURE 34.    COMPARATIVE SHARE ANALYSIS OF BFSI GLOBAL INTERACTIVE DISPLAY MARKET, BY COUNTRY, 2018 & 2026(%)
FIGURE 01.    COMPARATIVE SHARE ANALYSIS OF INTERACTIVE DISPLAY MARKET FOR MILITARY & DEFENSE, BY COUNTRY, 2017 & 2025 (%)
FIGURE 02.    COMPARATIVE SHARE ANALYSIS OF INTERACTIVE DISPLAY MARKET FOR EDUCATION, BY COUNTRY, 2017 & 2025 (%)
FIGURE 03.    COMPARATIVE SHARE ANALYSIS OF INTERACTIVE DISPLAY MARKET FOR OTHERS, BY COUNTRY, 2017 & 2025 (%)
FIGURE 01.    GLOBAL INTERACTIVE DISPLAY MARKET, BY REGION, 2018-2026
FIGURE 02.    COMPARATIVE SHARE ANALYSIS OF NORTH AMERICA INTERACTIVE DISPLAY MARKET, BY COUNTRY,  2018-2026 (%)
FIGURE 03.    U. S. INTERACTIVE DISPLAY MARKET, 2018-2026 ($MILLION)
FIGURE 04.    CANADA INTERACTIVE DISPLAY MARKET, 2018-2026 ($MILLION)
FIGURE 05.    MEXICO INTERACTIVE DISPLAY MARKET, 2018-2026 ($MILLION)
FIGURE 06.    COMPARATIVE SHARE ANALYSIS OF EUROPE INTERACTIVE DISPLAY MARKET, BY COUNTRY, 2018-2026 (%)
FIGURE 07.    GERMANY INTERACTIVE DISPLAY MARKET, 2018-2026 ($MILLION)
FIGURE 08.    FRANCE INTERACTIVE DISPLAY MARKET, 2018-2026 ($MILLION)
FIGURE 09.    UK INTERACTIVE DISPLAY MARKET, 2018-2026 ($MILLION)
FIGURE 10.    ITALY INTERACTIVE DISPLAY MARKET, 2018-2026 ($MILLION)
FIGURE 11.    REST OF EUROPE INTERACTIVE DISPLAY MARKET, 2018-2026 ($MILLION)
FIGURE 12.    COMPARATIVE SHARE ANALYSIS OF ASIA-PACIFIC INTERACTIVE DISPLAY MARKET, BY COUNTRY, 2018-2026 (%)
FIGURE 13.    INDIA INTERACTIVE DISPLAY MARKET, 2018-2026 ($MILLION)
FIGURE 14.    CHINA INTERACTIVE DISPLAY MARKET, 2018-2026 ($MILLION)
FIGURE 15.    CHINA INTERACTIVE DISPLAY MARKET, 2018-2026 ($MILLION)
FIGURE 16.    SOUTH KOREA INTERACTIVE DISPLAY MARKET, 2018-2026 ($MILLION)
FIGURE 17.    REST OF ASIA-PACIFIC INTERACTIVE DISPLAY MARKET, 2018-2026 ($MILLION)
FIGURE 18.    COMPARATIVE SHARE ANALYSIS OF LAMEA INTERACTIVE DISPLAY MARKET, BY COUNTRY, 2018-2026 (%)
FIGURE 19.    LATIN AMERICA INTERACTIVE DISPLAY MARKET, 2018-2026 ($MILLION)
FIGURE 20.    MIDDLE EAST INTERACTIVE DISPLAY MARKET, 2018-2026 ($MILLION)
FIGURE 21.    AFRICA INTERACTIVE DISPLAY MARKET, 2018-2026 ($MILLION)
FIGURE 22.    MARKET PLAYER POSITIONING, 2019
FIGURE 23.    TOP WINNING STRATEGIES, BY YEAR, 2016-2019*
FIGURE 24.    TOP WINNING STRATEGIES, BY DEVELOPMENT, 2016-2019*
FIGURE 25.    TOP WINNING STRATEGIES, BY COMPANY, 2016-2019*
FIGURE 26.    PRODUCT MAPPING OF TOP 10 PLAYERS
FIGURE 27.    COMPETITIVE DASHBOARD OF KEY PLAYER
FIGURE 28. &


Interactive display are the computer device, which are widely used in largest industries such as education, corporate, retail, and other sector. The touch screen displays provide high quality range of solution across spectrum of interactive technologies. Touch screen technology widely used in interactive kiosk, interactive table, interactive monitor, and video wall to replace the most important function such as mouse and keyboard. 

The demand for interactive displays in the education and corporate sector is expected to increase rapidly during the forecast period, owing to various factors such as surge in usage of interactive whiteboard, increase in demand for interactive kiosk. However, high cost of the latest display technologies such as transparent display and quantum dot displays hinders the market growth. The market for interactive display in education and corporate sector is analyzed and estimated in accordance with the impacts of the drivers, restraints, and opportunities.  

Presently, flat panel segment accounts for the largest market share, followed by the flexible panel, due to increase in adoption of touch screen display. However, Transparent Panel segment dominates the market, owing to the benefits associated with advancements in these displays. The North America region accounted for about 31.54% of the global interactive display market due to its immense popularity in U.S. and Canada.

Moreover, surge in adoption of interactive kiosk and interactive whiteboard are the key factors of the interactive display for education and retail market. Moreover, digitalization in the education industry in emerging economies is expected to generate tremendous growth opportunities during the forecast period. 

PURCHASE OPTIONS

Call or Email us

U.S.-Canada Toll-free: +1-800-792-5285
Int'l : +1-503-894-6022
Europe : +44-845-528-1300
Email : help@alliedmarketresearch.com

Looking for Customization?

 Customization Request

Have a Question?

 Speak with Analyst

Any Confusion?

 Inquire Before Buying

Have a glance of the Report

  Request Sample
RELATED TAGS

Purchase Full Report of
Interactive Display Market

Start reading instantly.
This Report and over 68,399+ more Reports, Available with Avenue Library. T&C*.

  • Online Only
  • $3,456
  • Online cloud access only
  • Restricted print, copy, paste & download
  • Read only
  • Free industry update
    (Within 180 days)
  • Free report update in next update cycle
    (Oct 2020 - Oct 2021)
  • Data Pack
  • $3,840
  • Restricted to one authorized user
  • One print only
  • Available in
    Excel
  • Free industry update
    (Within 180 days)
  •   Free report update in next update cycle
    (Oct 2020 - Oct 2021)
  • Single User
  • $5,769
  • Restricted to one authorized user
  • One print only
  • Available in
    PDF
  • Free industry update
    (Within 180 days)
  •   Free report update in next update cycle
    (Oct 2020 - Oct 2021)
  • Five Users
  • $6,450
  • Limited to five authorized users
  • Print upto five copies
  • Available in
    PDF
  • Free industry update
    (Within 180 days)
  •   Free report update in next update cycle
    (Oct 2020 - Oct 2021)
  • Enterprise
    License/PDF

  • $10,995
  • Unlimited
    within
    company/enterprise
  • Available in Excel & PDF
  • Free industry update
    (Within 180 days)
  •   Free report update in next update cycle
    (Oct 2020 - Oct 2021)
  • Library
    Membership

  • $999 $ 1,175
    Per User/ Per month/ Billed annually
  • Published Content
    E-access
  • Company Profiles
    E-access
  • Newly Added Content Access
  • 10 PDF
    Downloads
  • 5 Excel Data
    Pack Downloads
  • 250 Company Profiles PDF Downloads
  • Buy Now

*Taxes/Fees, if applicable will be added during checkout. All prices in USD

RELATED REPORTS
 

Why Allied Market Research?


Infallible Methodology

To ensure high-level data integrity, accurate analysis, and impeccable forecasts

Analyst Support

For complete satisfaction

Customization

On-demand customization of scope of the report to exactly meet your needs

TARGETED MARKET VIEW

Targeted market view to provide pertinent information and save time of readers

Get fresh content delivered

Get insights on topics that are crucial for your business. Stay abreast of your interest areas.

Get Industry Data Alerts

Why Allied Market Research?

Infallible Methodology

To ensure high-level data integrity, accurate analysis, and impeccable forecasts

Analyst Support

For complete satisfaction

Customization

On-demand customization of scope of the report to exactly meet your needs

TARGETED MARKET VIEW

Targeted market view to provide pertinent information and save time of readers