0
2022
Internet Of Things (iot) In Banking Market

Internet of Things (IoT) in Banking Market

by Offering (Solution, Services), by Deployment Model (On-premise, Cloud), by Application (Smart ATMs, Customer Management and Support, Security and Authentication, Others), by Enterprise Size (Large Enterprises, SMEs): Global Opportunity Analysis and Industry Forecast, 2021-2031

Report Code: A12751
Aug 2022 | Pages: 285
Tables: 123
Charts: 51
  • Formats*:

  • pdf

    Single User License, Five User
    License & Enterprise User License

  • xls

    Data Pack Excel License

  • ppt

    It comes with the additional cost
    of $2500.00 contact sales.


Internet Of Things (IoT) In Banking Market Research, 2031

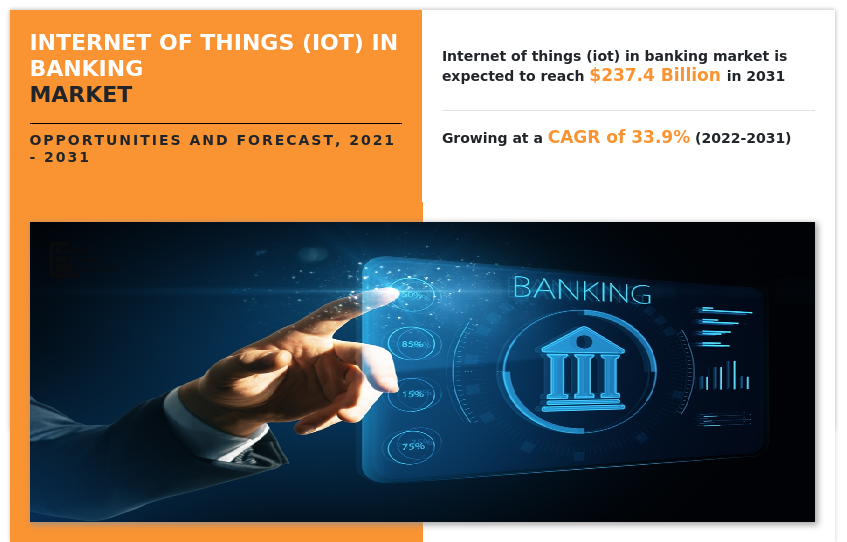
The global internet of things (iot) in banking market size was valued at $12.7 billion in 2021, and is projected to reach $237.4 billion by 2031, growing at a CAGR of 33.9% from 2022 to 2031.

The IoT in banking market was positively affected by the COVID-19 pandemic and showcased a positive growth rate during the period, owing to rise in the adoption of social distancing and contactless payments trends across the globe, which contributed towards the growth of the IoT in banking solutions market during the period."

Internet of Things (IoT) is defined as a network of physical objects (often termed nodes) that are embedded with sensors, software, and other technologies for the purpose of connecting and exchanging data with other devices and systems over the internet. Banking and financial institutes often depend on IoT devices to provide unique services to their customers, such as contactless payments and gamified rewards.

The major factor driving the Internet of Things (IoT) in banking market trends include rise in demands for IoT applications are propelling the growth of the global IoT in the banking market. Furthermore, increasing penetration of IoT-powered smartphones and smart wearables is also expected to aid the Internet of Things (IoT) in banking market opportunity. However, higher installation costs and complex infrastructural requirements can hamper the IoT in banking market growth. Conversely, advancements in the field of IoT and cloud technology are expected to offer remunerative opportunities for the expansion of the Internet of Things (IoT) in banking market growth during the forecast period.
Internet of Things (IoT) in Banking Market, Internet of Things (IoT) in Banking Industry, Internet of Things (IoT) in Banking Market Size, Internet of Things (IoT) in Banking Market Share, Internet of Things (IoT) in Banking Market Growth, Internet of Things (IoT) in Banking Market Trends, Internet of Things (IoT) in Banking Market Analysis, Internet of Things (IoT) in Banking Market Forecast, Internet of Things (IoT) in Banking Market Outlook, Internet of Things (IoT) in Banking Market Opportunity

The internet of things (iot) in banking market is segmented into Offering, Deployment Model, Application and Enterprise Size.

Segment review

The Internet of Things (IoT) in banking industry is segmented on the basis of offering, deployment model, application, enterprise size, and region. Based on offering, the market is segmented into solution and services. On the basis of deployment model, the market is bifurcated into on-premise and cloud. Depending on application, the market is classified into smart ATMs, customer management and support, security and authentication, and others. Based on enterprise size, the market is segmented into large enterprises and SMEs. Region wise, it is analyzed across North America, Europe, Asia-Pacific, and LAMEA.

The key players profiled in the Internet of Things (IoT) in banking market analysis are Accenture, Capgemini, Cisco Systems, Inc, Dynamics, Inc, GE Digital, IBM, Infosys Limited, Mastercard, Microsoft Corporation, Oracle Corporation, PTC, SAP SE, Software AG, Stripe, Temenos, Tibbo Systems, and Vodafone Group Plc. These players have adopted various strategies to increase their market penetration and strengthen their position in the Internet of Things (IoT) in banking industry.
Internet of Things (IoT) in Banking Market

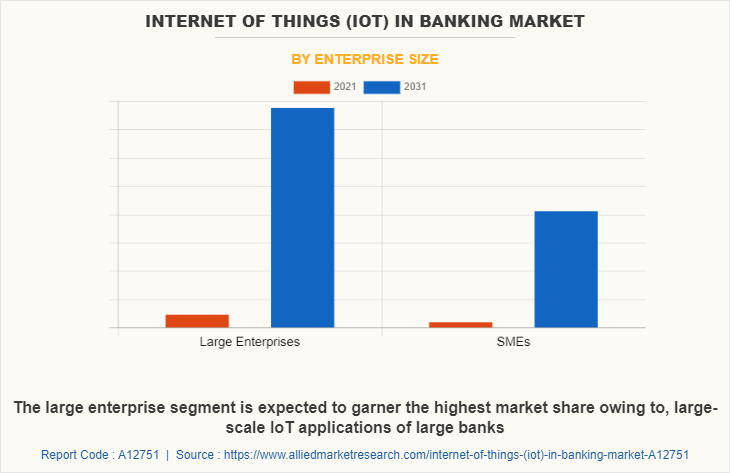
Depending on enterprise size, the large enterprise segment dominated the Internet of Things (IoT) in banking market share in 2021, and is expected to continue this trend during the forecast period owing to their large-scale operations needing highly efficient monitoring systems. However, the SMEs segment is expected to witness the highest growth in the upcoming years, owing to the growing number of technological investments by small-scale banks to make up for their smaller fleet of employees, which is anticipated to aid in the growth of IoT in retail banking.
Internet of Things (IoT) in Banking Market

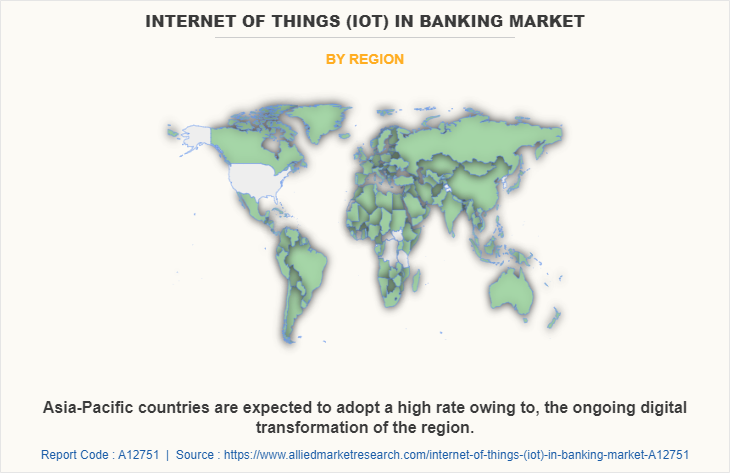
Region-wise, the IoT in banking market was dominated by North America in 2021, and is expected to retain its position during the forecast period, owing to high concentration of IoT in banking solution vendors in the region, which is expected to drive the market for IoT in banking technology during the forecast period. However, LAMEA is expected to witness significant growth during the forecast period, owing to its growing digital and economic transformation and the developing communication network infrastructure in the region, which is expected to fuel the growth of IoT in banking trends in the region in the coming few years.

The report focuses on growth prospects, restraints, and analysis of the global IoT in banking market trends. The study provides Porter’s five forces analysis to understand the impact of various factors, such as bargaining power of suppliers, competitive intensity of competitors, threat of new entrants, threat of substitutes, and bargaining power of buyers on the Internet of Things (IoT) in banking market share.

COVID-19 Impact Analysis

The Internet of Things (IoT) in banking market is expected to grow rapidly post the period of the pandemic, owing to the rise in the adoption of work-from-home culture across the globe. The IoT in banking market has witnessed significant growth in the past few years; however, owing to the outbreak of the COVID-19 pandemic, banks were forced to rapidly shift their business toward digital platforms. This is attributed to the various lockdown and movement restrictions in the public places by governments in a majority of countries, which helped to drive the market growth as banks sped up their transformation during the period to keep up with various social distancing and hygiene challenges during the period. Such factors supported the growth of IoT in banking market globally.

Top impacting factors

Wide range of applications for IoT solutions in the banking industry

Interconnected solutions, such as edge computing devices and IoT devices, are gaining high traction in the global market for their various high-throughput and productivity-enhancing applications. Moreover, IoT devices are being produced by a wide range of vendors which is further increasing the penetration of connected devices in the modern business world. IoT solutions use standard protocols and technologies such as radiofrequency identification (RFID), near-field communication (NFC), low-energy Bluetooth, low-energy wireless, low-energy radio protocols, LTE-A, and Wi-Fi-direct. These technologies support the specific networking functionality required in an IoT system in contrast to a standard uniform network of common systems which allows for IoT solutions to be deployed in a variety of applications. For instance, banks are deploying IoT-powered automated teller machines (ATM) for their “Smart ATM” initiatives. With smart ATMs, banks can reduce the number of frauds, service differently-abled customers more efficiently, and improve the overall customer experience of the ATM. Moreover, banks are also adopting IoT technology to facilitate faster and more convenient payments with the help of RFID and NFC-powered IoT solutions embedded in modern smartwatches, smartphones, and cards.

Improving Communication Networks 

As governments continue to try and enhance the present cellular networking infrastructure of their countries in order to improve communication speeds and overall connectivity for their citizens and the betterment of services, IoT applications are becoming easier to develop and deploy. This growth in many developing nations is helping newer businesses to invest in IoT applications. For instance, Ericsson, a Swedish telecommunications equipment, and services company, generated over $750 million in income in 2020 from the sale of telecom equipment and services in Southeast Asia and Australia. This was a 21% rise over the previous year of 2019. Such instances are highlighting the improving cellular connectivity, which in turn promises great opportunities for the growth of IoT-based applications in a variety of business sectors.

Moreover, modern communication technologies such as 5G communication networks that offer ultra-low latency and higher bandwidth, are empowering the use of real-time monitoring and communication systems, allowing banks and financial institutes to offer real-time payment settlement systems. Such factors are promising great opportunities for the future of IoT in modern banking applications.

KEY BENEFITS FOR STAKEHOLDERS

  • The study provides an in-depth analysis of the Internet of Things (IoT) in banking market forecast along with current & future trends to explain imminent investment pockets.
  • Information about key drivers, restraints, & opportunities and their impact analysis on Internet of Things (IoT) in banking market outlook is provided in the report.
  • Porter’s five forces analysis illustrates the potency of the buyers and suppliers operating in the industry.
  • The quantitative analysis of the Internet of Things (IoT) in Banking Market Opportunity from 2022 to 2031 is provided to determine the market potential.

Internet of Things (IoT) in Banking Market Report Highlights

Aspects Details
By Offering
  • Solution
  • Services
By Deployment Model
  • On-premise
  • Cloud
By Application
  • Smart ATMs
  • Customer Management and Support
  • Security and Authentication
  • Others
By Enterprise Size
  • Large Enterprises
  • SMEs
By Region
  • North America  (U.S., Canada)
  • Europe  (United Kingdom, Germany, France, Italy, Spain, Netherlands, Rest of Europe)
  • Asia-Pacific  (China, India, Japan, South Korea, Australia, Rest of Asia-Pacific)
  • LAMEA  (Latin America, Middle East, Africa)
Key Market Players IBM Corporation
 
  • CHAPTER 1:INTRODUCTION

    • 1.1.Report description

    • 1.2.Key market segments

    • 1.3.Key benefits to the stakeholders

    • 1.4.Research Methodology

      • 1.4.1.Secondary research

      • 1.4.2.Primary research

      • 1.4.3.Analyst tools and models

  • CHAPTER 2:EXECUTIVE SUMMARY

    • 2.1.Key findings of the study

    • 2.2.CXO Perspective

  • CHAPTER 3:MARKET OVERVIEW

    • 3.1.Market definition and scope

    • 3.2.Key findings

      • 3.2.1.Top investment pockets

    • 3.3.Porter’s five forces analysis

    • 3.4.Top player positioning

    • 3.5.Market dynamics

      • 3.5.1.Drivers

      • 3.5.2.Restraints

      • 3.5.3.Opportunities

    • 3.6.COVID-19 Impact Analysis on the market

  • CHAPTER 4: INTERNET OF THINGS (IOT) IN BANKING MARKET, BY OFFERING

    • 4.1 Overview

      • 4.1.1 Market size and forecast

    • 4.2 Solution

      • 4.2.1 Key market trends, growth factors and opportunities

      • 4.2.2 Market size and forecast, by region

      • 4.2.3 Market analysis by country

    • 4.3 Services

      • 4.3.1 Key market trends, growth factors and opportunities

      • 4.3.2 Market size and forecast, by region

      • 4.3.3 Market analysis by country

  • CHAPTER 5: INTERNET OF THINGS (IOT) IN BANKING MARKET, BY DEPLOYMENT MODEL

    • 5.1 Overview

      • 5.1.1 Market size and forecast

    • 5.2 On-premise

      • 5.2.1 Key market trends, growth factors and opportunities

      • 5.2.2 Market size and forecast, by region

      • 5.2.3 Market analysis by country

    • 5.3 Cloud

      • 5.3.1 Key market trends, growth factors and opportunities

      • 5.3.2 Market size and forecast, by region

      • 5.3.3 Market analysis by country

  • CHAPTER 6: INTERNET OF THINGS (IOT) IN BANKING MARKET, BY APPLICATION

    • 6.1 Overview

      • 6.1.1 Market size and forecast

    • 6.2 Smart ATMs

      • 6.2.1 Key market trends, growth factors and opportunities

      • 6.2.2 Market size and forecast, by region

      • 6.2.3 Market analysis by country

    • 6.3 Customer Management and Support

      • 6.3.1 Key market trends, growth factors and opportunities

      • 6.3.2 Market size and forecast, by region

      • 6.3.3 Market analysis by country

    • 6.4 Security and Authentication

      • 6.4.1 Key market trends, growth factors and opportunities

      • 6.4.2 Market size and forecast, by region

      • 6.4.3 Market analysis by country

    • 6.5 Others

      • 6.5.1 Key market trends, growth factors and opportunities

      • 6.5.2 Market size and forecast, by region

      • 6.5.3 Market analysis by country

  • CHAPTER 7: INTERNET OF THINGS (IOT) IN BANKING MARKET, BY ENTERPRISE SIZE

    • 7.1 Overview

      • 7.1.1 Market size and forecast

    • 7.2 Large Enterprises

      • 7.2.1 Key market trends, growth factors and opportunities

      • 7.2.2 Market size and forecast, by region

      • 7.2.3 Market analysis by country

    • 7.3 SMEs

      • 7.3.1 Key market trends, growth factors and opportunities

      • 7.3.2 Market size and forecast, by region

      • 7.3.3 Market analysis by country

  • CHAPTER 8: INTERNET OF THINGS (IOT) IN BANKING MARKET, BY REGION

    • 8.1 Overview

      • 8.1.1 Market size and forecast

    • 8.2 North America

      • 8.2.1 Key trends and opportunities

      • 8.2.2 North America Market size and forecast, by Offering

      • 8.2.3 North America Market size and forecast, by Deployment Model

      • 8.2.4 North America Market size and forecast, by Application

      • 8.2.5 North America Market size and forecast, by Enterprise Size

      • 8.2.6 North America Market size and forecast, by country

        • 8.2.6.1 U.S.
          • 8.2.6.1.1 Market size and forecast, by Offering
          • 8.2.6.1.2 Market size and forecast, by Deployment Model
          • 8.2.6.1.3 Market size and forecast, by Application
          • 8.2.6.1.4 Market size and forecast, by Enterprise Size
        • 8.2.6.2 Canada
          • 8.2.6.2.1 Market size and forecast, by Offering
          • 8.2.6.2.2 Market size and forecast, by Deployment Model
          • 8.2.6.2.3 Market size and forecast, by Application
          • 8.2.6.2.4 Market size and forecast, by Enterprise Size
    • 8.3 Europe

      • 8.3.1 Key trends and opportunities

      • 8.3.2 Europe Market size and forecast, by Offering

      • 8.3.3 Europe Market size and forecast, by Deployment Model

      • 8.3.4 Europe Market size and forecast, by Application

      • 8.3.5 Europe Market size and forecast, by Enterprise Size

      • 8.3.6 Europe Market size and forecast, by country

        • 8.3.6.1 United Kingdom
          • 8.3.6.1.1 Market size and forecast, by Offering
          • 8.3.6.1.2 Market size and forecast, by Deployment Model
          • 8.3.6.1.3 Market size and forecast, by Application
          • 8.3.6.1.4 Market size and forecast, by Enterprise Size
        • 8.3.6.2 Germany
          • 8.3.6.2.1 Market size and forecast, by Offering
          • 8.3.6.2.2 Market size and forecast, by Deployment Model
          • 8.3.6.2.3 Market size and forecast, by Application
          • 8.3.6.2.4 Market size and forecast, by Enterprise Size
        • 8.3.6.3 France
          • 8.3.6.3.1 Market size and forecast, by Offering
          • 8.3.6.3.2 Market size and forecast, by Deployment Model
          • 8.3.6.3.3 Market size and forecast, by Application
          • 8.3.6.3.4 Market size and forecast, by Enterprise Size
        • 8.3.6.4 Italy
          • 8.3.6.4.1 Market size and forecast, by Offering
          • 8.3.6.4.2 Market size and forecast, by Deployment Model
          • 8.3.6.4.3 Market size and forecast, by Application
          • 8.3.6.4.4 Market size and forecast, by Enterprise Size
        • 8.3.6.5 Spain
          • 8.3.6.5.1 Market size and forecast, by Offering
          • 8.3.6.5.2 Market size and forecast, by Deployment Model
          • 8.3.6.5.3 Market size and forecast, by Application
          • 8.3.6.5.4 Market size and forecast, by Enterprise Size
        • 8.3.6.6 Netherlands
          • 8.3.6.6.1 Market size and forecast, by Offering
          • 8.3.6.6.2 Market size and forecast, by Deployment Model
          • 8.3.6.6.3 Market size and forecast, by Application
          • 8.3.6.6.4 Market size and forecast, by Enterprise Size
        • 8.3.6.7 Rest of Europe
          • 8.3.6.7.1 Market size and forecast, by Offering
          • 8.3.6.7.2 Market size and forecast, by Deployment Model
          • 8.3.6.7.3 Market size and forecast, by Application
          • 8.3.6.7.4 Market size and forecast, by Enterprise Size
    • 8.4 Asia-Pacific

      • 8.4.1 Key trends and opportunities

      • 8.4.2 Asia-Pacific Market size and forecast, by Offering

      • 8.4.3 Asia-Pacific Market size and forecast, by Deployment Model

      • 8.4.4 Asia-Pacific Market size and forecast, by Application

      • 8.4.5 Asia-Pacific Market size and forecast, by Enterprise Size

      • 8.4.6 Asia-Pacific Market size and forecast, by country

        • 8.4.6.1 China
          • 8.4.6.1.1 Market size and forecast, by Offering
          • 8.4.6.1.2 Market size and forecast, by Deployment Model
          • 8.4.6.1.3 Market size and forecast, by Application
          • 8.4.6.1.4 Market size and forecast, by Enterprise Size
        • 8.4.6.2 India
          • 8.4.6.2.1 Market size and forecast, by Offering
          • 8.4.6.2.2 Market size and forecast, by Deployment Model
          • 8.4.6.2.3 Market size and forecast, by Application
          • 8.4.6.2.4 Market size and forecast, by Enterprise Size
        • 8.4.6.3 Japan
          • 8.4.6.3.1 Market size and forecast, by Offering
          • 8.4.6.3.2 Market size and forecast, by Deployment Model
          • 8.4.6.3.3 Market size and forecast, by Application
          • 8.4.6.3.4 Market size and forecast, by Enterprise Size
        • 8.4.6.4 South Korea
          • 8.4.6.4.1 Market size and forecast, by Offering
          • 8.4.6.4.2 Market size and forecast, by Deployment Model
          • 8.4.6.4.3 Market size and forecast, by Application
          • 8.4.6.4.4 Market size and forecast, by Enterprise Size
        • 8.4.6.5 Australia
          • 8.4.6.5.1 Market size and forecast, by Offering
          • 8.4.6.5.2 Market size and forecast, by Deployment Model
          • 8.4.6.5.3 Market size and forecast, by Application
          • 8.4.6.5.4 Market size and forecast, by Enterprise Size
        • 8.4.6.6 Rest of Asia-Pacific
          • 8.4.6.6.1 Market size and forecast, by Offering
          • 8.4.6.6.2 Market size and forecast, by Deployment Model
          • 8.4.6.6.3 Market size and forecast, by Application
          • 8.4.6.6.4 Market size and forecast, by Enterprise Size
    • 8.5 LAMEA

      • 8.5.1 Key trends and opportunities

      • 8.5.2 LAMEA Market size and forecast, by Offering

      • 8.5.3 LAMEA Market size and forecast, by Deployment Model

      • 8.5.4 LAMEA Market size and forecast, by Application

      • 8.5.5 LAMEA Market size and forecast, by Enterprise Size

      • 8.5.6 LAMEA Market size and forecast, by country

        • 8.5.6.1 Latin America
          • 8.5.6.1.1 Market size and forecast, by Offering
          • 8.5.6.1.2 Market size and forecast, by Deployment Model
          • 8.5.6.1.3 Market size and forecast, by Application
          • 8.5.6.1.4 Market size and forecast, by Enterprise Size
        • 8.5.6.2 Middle East
          • 8.5.6.2.1 Market size and forecast, by Offering
          • 8.5.6.2.2 Market size and forecast, by Deployment Model
          • 8.5.6.2.3 Market size and forecast, by Application
          • 8.5.6.2.4 Market size and forecast, by Enterprise Size
        • 8.5.6.3 Africa
          • 8.5.6.3.1 Market size and forecast, by Offering
          • 8.5.6.3.2 Market size and forecast, by Deployment Model
          • 8.5.6.3.3 Market size and forecast, by Application
          • 8.5.6.3.4 Market size and forecast, by Enterprise Size
  • CHAPTER 9: COMPANY LANDSCAPE

    • 9.1. Introduction

    • 9.2. Top winning strategies

    • 9.3. Product Mapping of Top 10 Player

    • 9.4. Competitive Dashboard

    • 9.5. Competitive Heatmap

    • 9.6. Key developments

  • CHAPTER 10: COMPANY PROFILES

    • 10.1 IBM Corporation

      • 10.1.1 Company overview

      • 10.1.2 Company snapshot

      • 10.1.3 Operating business segments

      • 10.1.4 Product portfolio

      • 10.1.5 Business performance

      • 10.1.6 Key strategic moves and developments

  • LIST OF TABLES

  • TABLE 1. GLOBAL INTERNET OF THINGS (IOT) IN BANKING MARKET, BY OFFERING, 2021-2031 ($MILLION)
    TABLE 2. INTERNET OF THINGS (IOT) IN BANKING MARKET SIZE, FOR SOLUTION, BY REGION, 2021-2031 ($MILLION)
    TABLE 3. INTERNET OF THINGS (IOT) IN BANKING MARKET FOR SOLUTION BY COUNTRY, 2021-2031 ($MILLION)
    TABLE 4. INTERNET OF THINGS (IOT) IN BANKING MARKET SIZE, FOR SERVICES, BY REGION, 2021-2031 ($MILLION)
    TABLE 5. INTERNET OF THINGS (IOT) IN BANKING MARKET FOR SERVICES BY COUNTRY, 2021-2031 ($MILLION)
    TABLE 6. GLOBAL INTERNET OF THINGS (IOT) IN BANKING MARKET, BY DEPLOYMENT MODEL, 2021-2031 ($MILLION)
    TABLE 7. INTERNET OF THINGS (IOT) IN BANKING MARKET SIZE, FOR ON-PREMISE, BY REGION, 2021-2031 ($MILLION)
    TABLE 8. INTERNET OF THINGS (IOT) IN BANKING MARKET FOR ON-PREMISE BY COUNTRY, 2021-2031 ($MILLION)
    TABLE 9. INTERNET OF THINGS (IOT) IN BANKING MARKET SIZE, FOR CLOUD, BY REGION, 2021-2031 ($MILLION)
    TABLE 10. INTERNET OF THINGS (IOT) IN BANKING MARKET FOR CLOUD BY COUNTRY, 2021-2031 ($MILLION)
    TABLE 11. GLOBAL INTERNET OF THINGS (IOT) IN BANKING MARKET, BY APPLICATION, 2021-2031 ($MILLION)
    TABLE 12. INTERNET OF THINGS (IOT) IN BANKING MARKET SIZE, FOR SMART ATMS, BY REGION, 2021-2031 ($MILLION)
    TABLE 13. INTERNET OF THINGS (IOT) IN BANKING MARKET FOR SMART ATMS BY COUNTRY, 2021-2031 ($MILLION)
    TABLE 14. INTERNET OF THINGS (IOT) IN BANKING MARKET SIZE, FOR CUSTOMER MANAGEMENT AND SUPPORT, BY REGION, 2021-2031 ($MILLION)
    TABLE 15. INTERNET OF THINGS (IOT) IN BANKING MARKET FOR CUSTOMER MANAGEMENT AND SUPPORT BY COUNTRY, 2021-2031 ($MILLION)
    TABLE 16. INTERNET OF THINGS (IOT) IN BANKING MARKET SIZE, FOR SECURITY AND AUTHENTICATION, BY REGION, 2021-2031 ($MILLION)
    TABLE 17. INTERNET OF THINGS (IOT) IN BANKING MARKET FOR SECURITY AND AUTHENTICATION BY COUNTRY, 2021-2031 ($MILLION)
    TABLE 18. INTERNET OF THINGS (IOT) IN BANKING MARKET SIZE, FOR OTHERS, BY REGION, 2021-2031 ($MILLION)
    TABLE 19. INTERNET OF THINGS (IOT) IN BANKING MARKET FOR OTHERS BY COUNTRY, 2021-2031 ($MILLION)
    TABLE 20. GLOBAL INTERNET OF THINGS (IOT) IN BANKING MARKET, BY ENTERPRISE SIZE, 2021-2031 ($MILLION)
    TABLE 21. INTERNET OF THINGS (IOT) IN BANKING MARKET SIZE, FOR LARGE ENTERPRISES, BY REGION, 2021-2031 ($MILLION)
    TABLE 22. INTERNET OF THINGS (IOT) IN BANKING MARKET FOR LARGE ENTERPRISES BY COUNTRY, 2021-2031 ($MILLION)
    TABLE 23. INTERNET OF THINGS (IOT) IN BANKING MARKET SIZE, FOR SMES, BY REGION, 2021-2031 ($MILLION)
    TABLE 24. INTERNET OF THINGS (IOT) IN BANKING MARKET FOR SMES BY COUNTRY, 2021-2031 ($MILLION)
    TABLE 25. INTERNET OF THINGS (IOT) IN BANKING MARKET, BY REGION, 2021-2031 ($MILLION)
    TABLE 26. NORTH AMERICA INTERNET OF THINGS (IOT) IN BANKING MARKET, BY OFFERING, 2021-2031 ($MILLION)
    TABLE 27. NORTH AMERICA INTERNET OF THINGS (IOT) IN BANKING MARKET, BY DEPLOYMENT MODEL, 2021-2031 ($MILLION)
    TABLE 28. NORTH AMERICA INTERNET OF THINGS (IOT) IN BANKING MARKET, BY APPLICATION, 2021-2031 ($MILLION)
    TABLE 29. NORTH AMERICA INTERNET OF THINGS (IOT) IN BANKING MARKET, BY ENTERPRISE SIZE, 2021-2031 ($MILLION)
    TABLE 30. NORTH AMERICA INTERNET OF THINGS (IOT) IN BANKING MARKET, BY COUNTRY, 2021-2031 ($MILLION)
    TABLE 31. U.S. INTERNET OF THINGS (IOT) IN BANKING MARKET, BY OFFERING, 2021-2031 ($MILLION)
    TABLE 32. U.S. INTERNET OF THINGS (IOT) IN BANKING MARKET, BY DEPLOYMENT MODEL, 2021-2031 ($MILLION)
    TABLE 33. U.S. INTERNET OF THINGS (IOT) IN BANKING MARKET, BY APPLICATION, 2021-2031 ($MILLION)
    TABLE 34. U.S. INTERNET OF THINGS (IOT) IN BANKING MARKET, BY ENTERPRISE SIZE, 2021-2031 ($MILLION)
    TABLE 35. CANADA INTERNET OF THINGS (IOT) IN BANKING MARKET, BY OFFERING, 2021-2031 ($MILLION)
    TABLE 36. CANADA INTERNET OF THINGS (IOT) IN BANKING MARKET, BY DEPLOYMENT MODEL, 2021-2031 ($MILLION)
    TABLE 37. CANADA INTERNET OF THINGS (IOT) IN BANKING MARKET, BY APPLICATION, 2021-2031 ($MILLION)
    TABLE 38. CANADA INTERNET OF THINGS (IOT) IN BANKING MARKET, BY ENTERPRISE SIZE, 2021-2031 ($MILLION)
    TABLE 39. EUROPE INTERNET OF THINGS (IOT) IN BANKING MARKET, BY OFFERING, 2021-2031 ($MILLION)
    TABLE 40. EUROPE INTERNET OF THINGS (IOT) IN BANKING MARKET, BY DEPLOYMENT MODEL, 2021-2031 ($MILLION)
    TABLE 41. EUROPE INTERNET OF THINGS (IOT) IN BANKING MARKET, BY APPLICATION, 2021-2031 ($MILLION)
    TABLE 42. EUROPE INTERNET OF THINGS (IOT) IN BANKING MARKET, BY ENTERPRISE SIZE, 2021-2031 ($MILLION)
    TABLE 43. EUROPE INTERNET OF THINGS (IOT) IN BANKING MARKET, BY COUNTRY, 2021-2031 ($MILLION)
    TABLE 44. UNITED KINGDOM INTERNET OF THINGS (IOT) IN BANKING MARKET, BY OFFERING, 2021-2031 ($MILLION)
    TABLE 45. UNITED KINGDOM INTERNET OF THINGS (IOT) IN BANKING MARKET, BY DEPLOYMENT MODEL, 2021-2031 ($MILLION)
    TABLE 46. UNITED KINGDOM INTERNET OF THINGS (IOT) IN BANKING MARKET, BY APPLICATION, 2021-2031 ($MILLION)
    TABLE 47. UNITED KINGDOM INTERNET OF THINGS (IOT) IN BANKING MARKET, BY ENTERPRISE SIZE, 2021-2031 ($MILLION)
    TABLE 48. GERMANY INTERNET OF THINGS (IOT) IN BANKING MARKET, BY OFFERING, 2021-2031 ($MILLION)
    TABLE 49. GERMANY INTERNET OF THINGS (IOT) IN BANKING MARKET, BY DEPLOYMENT MODEL, 2021-2031 ($MILLION)
    TABLE 50. GERMANY INTERNET OF THINGS (IOT) IN BANKING MARKET, BY APPLICATION, 2021-2031 ($MILLION)
    TABLE 51. GERMANY INTERNET OF THINGS (IOT) IN BANKING MARKET, BY ENTERPRISE SIZE, 2021-2031 ($MILLION)
    TABLE 52. FRANCE INTERNET OF THINGS (IOT) IN BANKING MARKET, BY OFFERING, 2021-2031 ($MILLION)
    TABLE 53. FRANCE INTERNET OF THINGS (IOT) IN BANKING MARKET, BY DEPLOYMENT MODEL, 2021-2031 ($MILLION)
    TABLE 54. FRANCE INTERNET OF THINGS (IOT) IN BANKING MARKET, BY APPLICATION, 2021-2031 ($MILLION)
    TABLE 55. FRANCE INTERNET OF THINGS (IOT) IN BANKING MARKET, BY ENTERPRISE SIZE, 2021-2031 ($MILLION)
    TABLE 56. ITALY INTERNET OF THINGS (IOT) IN BANKING MARKET, BY OFFERING, 2021-2031 ($MILLION)
    TABLE 57. ITALY INTERNET OF THINGS (IOT) IN BANKING MARKET, BY DEPLOYMENT MODEL, 2021-2031 ($MILLION)
    TABLE 58. ITALY INTERNET OF THINGS (IOT) IN BANKING MARKET, BY APPLICATION, 2021-2031 ($MILLION)
    TABLE 59. ITALY INTERNET OF THINGS (IOT) IN BANKING MARKET, BY ENTERPRISE SIZE, 2021-2031 ($MILLION)
    TABLE 60. SPAIN INTERNET OF THINGS (IOT) IN BANKING MARKET, BY OFFERING, 2021-2031 ($MILLION)
    TABLE 61. SPAIN INTERNET OF THINGS (IOT) IN BANKING MARKET, BY DEPLOYMENT MODEL, 2021-2031 ($MILLION)
    TABLE 62. SPAIN INTERNET OF THINGS (IOT) IN BANKING MARKET, BY APPLICATION, 2021-2031 ($MILLION)
    TABLE 63. SPAIN INTERNET OF THINGS (IOT) IN BANKING MARKET, BY ENTERPRISE SIZE, 2021-2031 ($MILLION)
    TABLE 64. NETHERLANDS INTERNET OF THINGS (IOT) IN BANKING MARKET, BY OFFERING, 2021-2031 ($MILLION)
    TABLE 65. NETHERLANDS INTERNET OF THINGS (IOT) IN BANKING MARKET, BY DEPLOYMENT MODEL, 2021-2031 ($MILLION)
    TABLE 66. NETHERLANDS INTERNET OF THINGS (IOT) IN BANKING MARKET, BY APPLICATION, 2021-2031 ($MILLION)
    TABLE 67. NETHERLANDS INTERNET OF THINGS (IOT) IN BANKING MARKET, BY ENTERPRISE SIZE, 2021-2031 ($MILLION)
    TABLE 68. REST OF EUROPE INTERNET OF THINGS (IOT) IN BANKING MARKET, BY OFFERING, 2021-2031 ($MILLION)
    TABLE 69. REST OF EUROPE INTERNET OF THINGS (IOT) IN BANKING MARKET, BY DEPLOYMENT MODEL, 2021-2031 ($MILLION)
    TABLE 70. REST OF EUROPE INTERNET OF THINGS (IOT) IN BANKING MARKET, BY APPLICATION, 2021-2031 ($MILLION)
    TABLE 71. REST OF EUROPE INTERNET OF THINGS (IOT) IN BANKING MARKET, BY ENTERPRISE SIZE, 2021-2031 ($MILLION)
    TABLE 72. ASIA-PACIFIC INTERNET OF THINGS (IOT) IN BANKING MARKET, BY OFFERING, 2021-2031 ($MILLION)
    TABLE 73. ASIA-PACIFIC INTERNET OF THINGS (IOT) IN BANKING MARKET, BY DEPLOYMENT MODEL, 2021-2031 ($MILLION)
    TABLE 74. ASIA-PACIFIC INTERNET OF THINGS (IOT) IN BANKING MARKET, BY APPLICATION, 2021-2031 ($MILLION)
    TABLE 75. ASIA-PACIFIC INTERNET OF THINGS (IOT) IN BANKING MARKET, BY ENTERPRISE SIZE, 2021-2031 ($MILLION)
    TABLE 76. ASIA-PACIFIC INTERNET OF THINGS (IOT) IN BANKING MARKET, BY COUNTRY, 2021-2031 ($MILLION)
    TABLE 77. CHINA INTERNET OF THINGS (IOT) IN BANKING MARKET, BY OFFERING, 2021-2031 ($MILLION)
    TABLE 78. CHINA INTERNET OF THINGS (IOT) IN BANKING MARKET, BY DEPLOYMENT MODEL, 2021-2031 ($MILLION)
    TABLE 79. CHINA INTERNET OF THINGS (IOT) IN BANKING MARKET, BY APPLICATION, 2021-2031 ($MILLION)
    TABLE 80. CHINA INTERNET OF THINGS (IOT) IN BANKING MARKET, BY ENTERPRISE SIZE, 2021-2031 ($MILLION)
    TABLE 81. INDIA INTERNET OF THINGS (IOT) IN BANKING MARKET, BY OFFERING, 2021-2031 ($MILLION)
    TABLE 82. INDIA INTERNET OF THINGS (IOT) IN BANKING MARKET, BY DEPLOYMENT MODEL, 2021-2031 ($MILLION)
    TABLE 83. INDIA INTERNET OF THINGS (IOT) IN BANKING MARKET, BY APPLICATION, 2021-2031 ($MILLION)
    TABLE 84. INDIA INTERNET OF THINGS (IOT) IN BANKING MARKET, BY ENTERPRISE SIZE, 2021-2031 ($MILLION)
    TABLE 85. JAPAN INTERNET OF THINGS (IOT) IN BANKING MARKET, BY OFFERING, 2021-2031 ($MILLION)
    TABLE 86. JAPAN INTERNET OF THINGS (IOT) IN BANKING MARKET, BY DEPLOYMENT MODEL, 2021-2031 ($MILLION)
    TABLE 87. JAPAN INTERNET OF THINGS (IOT) IN BANKING MARKET, BY APPLICATION, 2021-2031 ($MILLION)
    TABLE 88. JAPAN INTERNET OF THINGS (IOT) IN BANKING MARKET, BY ENTERPRISE SIZE, 2021-2031 ($MILLION)
    TABLE 89. SOUTH KOREA INTERNET OF THINGS (IOT) IN BANKING MARKET, BY OFFERING, 2021-2031 ($MILLION)
    TABLE 90. SOUTH KOREA INTERNET OF THINGS (IOT) IN BANKING MARKET, BY DEPLOYMENT MODEL, 2021-2031 ($MILLION)
    TABLE 91. SOUTH KOREA INTERNET OF THINGS (IOT) IN BANKING MARKET, BY APPLICATION, 2021-2031 ($MILLION)
    TABLE 92. SOUTH KOREA INTERNET OF THINGS (IOT) IN BANKING MARKET, BY ENTERPRISE SIZE, 2021-2031 ($MILLION)
    TABLE 93. AUSTRALIA INTERNET OF THINGS (IOT) IN BANKING MARKET, BY OFFERING, 2021-2031 ($MILLION)
    TABLE 94. AUSTRALIA INTERNET OF THINGS (IOT) IN BANKING MARKET, BY DEPLOYMENT MODEL, 2021-2031 ($MILLION)
    TABLE 95. AUSTRALIA INTERNET OF THINGS (IOT) IN BANKING MARKET, BY APPLICATION, 2021-2031 ($MILLION)
    TABLE 96. AUSTRALIA INTERNET OF THINGS (IOT) IN BANKING MARKET, BY ENTERPRISE SIZE, 2021-2031 ($MILLION)
    TABLE 97. REST OF ASIA-PACIFIC INTERNET OF THINGS (IOT) IN BANKING MARKET, BY OFFERING, 2021-2031 ($MILLION)
    TABLE 98. REST OF ASIA-PACIFIC INTERNET OF THINGS (IOT) IN BANKING MARKET, BY DEPLOYMENT MODEL, 2021-2031 ($MILLION)
    TABLE 99. REST OF ASIA-PACIFIC INTERNET OF THINGS (IOT) IN BANKING MARKET, BY APPLICATION, 2021-2031 ($MILLION)
    TABLE 100. REST OF ASIA-PACIFIC INTERNET OF THINGS (IOT) IN BANKING MARKET, BY ENTERPRISE SIZE, 2021-2031 ($MILLION)
    TABLE 101. LAMEA INTERNET OF THINGS (IOT) IN BANKING MARKET, BY OFFERING, 2021-2031 ($MILLION)
    TABLE 102. LAMEA INTERNET OF THINGS (IOT) IN BANKING MARKET, BY DEPLOYMENT MODEL, 2021-2031 ($MILLION)
    TABLE 103. LAMEA INTERNET OF THINGS (IOT) IN BANKING MARKET, BY APPLICATION, 2021-2031 ($MILLION)
    TABLE 104. LAMEA INTERNET OF THINGS (IOT) IN BANKING MARKET, BY ENTERPRISE SIZE, 2021-2031 ($MILLION)
    TABLE 105. LAMEA INTERNET OF THINGS (IOT) IN BANKING MARKET, BY COUNTRY, 2021-2031 ($MILLION)
    TABLE 106. LATIN AMERICA INTERNET OF THINGS (IOT) IN BANKING MARKET, BY OFFERING, 2021-2031 ($MILLION)
    TABLE 107. LATIN AMERICA INTERNET OF THINGS (IOT) IN BANKING MARKET, BY DEPLOYMENT MODEL, 2021-2031 ($MILLION)
    TABLE 108. LATIN AMERICA INTERNET OF THINGS (IOT) IN BANKING MARKET, BY APPLICATION, 2021-2031 ($MILLION)
    TABLE 109. LATIN AMERICA INTERNET OF THINGS (IOT) IN BANKING MARKET, BY ENTERPRISE SIZE, 2021-2031 ($MILLION)
    TABLE 110. MIDDLE EAST INTERNET OF THINGS (IOT) IN BANKING MARKET, BY OFFERING, 2021-2031 ($MILLION)
    TABLE 111. MIDDLE EAST INTERNET OF THINGS (IOT) IN BANKING MARKET, BY DEPLOYMENT MODEL, 2021-2031 ($MILLION)
    TABLE 112. MIDDLE EAST INTERNET OF THINGS (IOT) IN BANKING MARKET, BY APPLICATION, 2021-2031 ($MILLION)
    TABLE 113. MIDDLE EAST INTERNET OF THINGS (IOT) IN BANKING MARKET, BY ENTERPRISE SIZE, 2021-2031 ($MILLION)
    TABLE 114. AFRICA INTERNET OF THINGS (IOT) IN BANKING MARKET, BY OFFERING, 2021-2031 ($MILLION)
    TABLE 115. AFRICA INTERNET OF THINGS (IOT) IN BANKING MARKET, BY DEPLOYMENT MODEL, 2021-2031 ($MILLION)
    TABLE 116. AFRICA INTERNET OF THINGS (IOT) IN BANKING MARKET, BY APPLICATION, 2021-2031 ($MILLION)
    TABLE 117. AFRICA INTERNET OF THINGS (IOT) IN BANKING MARKET, BY ENTERPRISE SIZE, 2021-2031 ($MILLION)
    TABLE 118.IBM CORPORATION: COMPANY SNAPSHOT
    TABLE 119.IBM CORPORATION: OPERATING SEGMENTS
    TABLE 120.IBM CORPORATION: PRODUCT PORTFOLIO
    TABLE 121.IBM CORPORATION: NET SALES,
    TABLE 122.IBM CORPORATION: KEY STRATERGIES
  • LIST OF FIGURES

  • FIGURE 1.INTERNET OF THINGS (IOT) IN BANKING MARKET SEGMENTATION
    FIGURE 2.INTERNET OF THINGS (IOT) IN BANKING MARKET,2021-2031
    FIGURE 3.INTERNET OF THINGS (IOT) IN BANKING MARKET,2021-2031
    FIGURE 4. TOP INVESTMENT POCKETS, BY REGION
    FIGURE 5.PORTER FIVE-1
    FIGURE 6.PORTER FIVE-2
    FIGURE 7.PORTER FIVE-3
    FIGURE 8.PORTER FIVE-4
    FIGURE 9.PORTER FIVE-5
    FIGURE 10.TOP PLAYER POSITIONING
    FIGURE 11.INTERNET OF THINGS (IOT) IN BANKING MARKET:DRIVERS, RESTRAINTS AND OPPORTUNITIES
    FIGURE 12.INTERNET OF THINGS (IOT) IN BANKING MARKET,BY OFFERING,2021(%)
    FIGURE 13.COMPARATIVE SHARE ANALYSIS OF SOLUTION INTERNET OF THINGS (IOT) IN BANKING MARKET,2021-2031(%)
    FIGURE 14.COMPARATIVE SHARE ANALYSIS OF SERVICES INTERNET OF THINGS (IOT) IN BANKING MARKET,2021-2031(%)
    FIGURE 15.INTERNET OF THINGS (IOT) IN BANKING MARKET,BY DEPLOYMENT MODEL,2021(%)
    FIGURE 16.COMPARATIVE SHARE ANALYSIS OF ON-PREMISE INTERNET OF THINGS (IOT) IN BANKING MARKET,2021-2031(%)
    FIGURE 17.COMPARATIVE SHARE ANALYSIS OF CLOUD INTERNET OF THINGS (IOT) IN BANKING MARKET,2021-2031(%)
    FIGURE 18.INTERNET OF THINGS (IOT) IN BANKING MARKET,BY APPLICATION,2021(%)
    FIGURE 19.COMPARATIVE SHARE ANALYSIS OF SMART ATMS INTERNET OF THINGS (IOT) IN BANKING MARKET,2021-2031(%)
    FIGURE 20.COMPARATIVE SHARE ANALYSIS OF CUSTOMER MANAGEMENT AND SUPPORT INTERNET OF THINGS (IOT) IN BANKING MARKET,2021-2031(%)
    FIGURE 21.COMPARATIVE SHARE ANALYSIS OF SECURITY AND AUTHENTICATION INTERNET OF THINGS (IOT) IN BANKING MARKET,2021-2031(%)
    FIGURE 22.COMPARATIVE SHARE ANALYSIS OF OTHERS INTERNET OF THINGS (IOT) IN BANKING MARKET,2021-2031(%)
    FIGURE 23.INTERNET OF THINGS (IOT) IN BANKING MARKET,BY ENTERPRISE SIZE,2021(%)
    FIGURE 24.COMPARATIVE SHARE ANALYSIS OF LARGE ENTERPRISES INTERNET OF THINGS (IOT) IN BANKING MARKET,2021-2031(%)
    FIGURE 25.COMPARATIVE SHARE ANALYSIS OF SMES INTERNET OF THINGS (IOT) IN BANKING MARKET,2021-2031(%)
    FIGURE 26.INTERNET OF THINGS (IOT) IN BANKING MARKET BY REGION,2021
    FIGURE 27.U.S. INTERNET OF THINGS (IOT) IN BANKING MARKET,2021-2031($MILLION)
    FIGURE 28.CANADA INTERNET OF THINGS (IOT) IN BANKING MARKET,2021-2031($MILLION)
    FIGURE 29.UNITED KINGDOM INTERNET OF THINGS (IOT) IN BANKING MARKET,2021-2031($MILLION)
    FIGURE 30.GERMANY INTERNET OF THINGS (IOT) IN BANKING MARKET,2021-2031($MILLION)
    FIGURE 31.FRANCE INTERNET OF THINGS (IOT) IN BANKING MARKET,2021-2031($MILLION)
    FIGURE 32.ITALY INTERNET OF THINGS (IOT) IN BANKING MARKET,2021-2031($MILLION)
    FIGURE 33.SPAIN INTERNET OF THINGS (IOT) IN BANKING MARKET,2021-2031($MILLION)
    FIGURE 34.NETHERLANDS INTERNET OF THINGS (IOT) IN BANKING MARKET,2021-2031($MILLION)
    FIGURE 35.REST OF EUROPE INTERNET OF THINGS (IOT) IN BANKING MARKET,2021-2031($MILLION)
    FIGURE 36.CHINA INTERNET OF THINGS (IOT) IN BANKING MARKET,2021-2031($MILLION)
    FIGURE 37.INDIA INTERNET OF THINGS (IOT) IN BANKING MARKET,2021-2031($MILLION)
    FIGURE 38.JAPAN INTERNET OF THINGS (IOT) IN BANKING MARKET,2021-2031($MILLION)
    FIGURE 39.SOUTH KOREA INTERNET OF THINGS (IOT) IN BANKING MARKET,2021-2031($MILLION)
    FIGURE 40.AUSTRALIA INTERNET OF THINGS (IOT) IN BANKING MARKET,2021-2031($MILLION)
    FIGURE 41.REST OF ASIA-PACIFIC INTERNET OF THINGS (IOT) IN BANKING MARKET,2021-2031($MILLION)
    FIGURE 42.LATIN AMERICA INTERNET OF THINGS (IOT) IN BANKING MARKET,2021-2031($MILLION)
    FIGURE 43.MIDDLE EAST INTERNET OF THINGS (IOT) IN BANKING MARKET,2021-2031($MILLION)
    FIGURE 44.AFRICA INTERNET OF THINGS (IOT) IN BANKING MARKET,2021-2031($MILLION)
    FIGURE 45. TOP WINNING STRATEGIES, BY YEAR
    FIGURE 46. TOP WINNING STRATEGIES, BY DEVELOPMENT
    FIGURE 47. TOP WINNING STRATEGIES, BY COMPANY
    FIGURE 48.PRODUCT MAPPING OF TOP 10 PLAYERS
    FIGURE 49.COMPETITIVE DASHBOARD
    FIGURE 50.COMPETITIVE HEATMAP OF TOP 10 KEY PLAYERS
    FIGURE 51.IBM CORPORATION.: NET SALES ,($MILLION)


Demand for IoT in banking systems has grown in past few years, and the market is expected to maintain this trend in the coming years as well, owing to increasing adoption of IoT in day-to-day life. Moreover, rise in penetration of smartphones and smart wearables is expected to further drive the demand for IoT solutions in the banking market. In addition, growth in the number of digital devices and rising internet penetration in many regions globally are promising new opportunities for growth of the IoT in banking market.

Key providers of the IoT in banking market, such as IBM Corporation, Cisco Systems, Inc., and Microsoft Corporation account for a significant share in the market. With larger requirement from IoT solutions in banking, various companies are establishing partnerships to increase their IoT in banking offerings. For instance, in July 2021, Mastercard Inc., an American multinational financial services corporation announced partnership with Verizon Business to drive transformational solutions for the global payments and commerce ecosystem. With this partnership, Verizon is expected to support Mastercard’s various services from contactless shopping and autonomous checkout technology to Cloud Point of Sale (POS) solutions.

In addition, with increase in demand for IoT in banking, various companies are expanding their current product portfolio with increasing diversification. For instance, in May 2022, Mastercard announced launch of Biometric Checkout Program. With this new program, Mastercard unleashes new era of biometric payments to enhance the checkout experience. The program was initiated as a trail in Brazil with Payface and St Marche. Moreover, market players are expanding their business operations and customers by increasing acquisitions.

For instance, in May 2022, HCL Technologies UK Limited, a wholly-owned subsidiary of the Indian multinational tech corporation, HCL Technologies (HCL) announced acquisition of Confinale AG, a Switzerland-based digital banking and wealth management consulting specialist. Through this strategic acquisition, HCL is expected to increase its footprint in the global wealth management market with emphasis on Avaloq consulting, implementation, and management capabilities.

PURCHASE OPTIONS

Call or Email us

U.S.-Canada Toll-free: +1-800-792-5285
Int'l : +1-503-894-6022
Europe : +44-845-528-1300
Email : help@alliedmarketresearch.com
 
FREQUENTLY ASKED QUESTIONS?

A. Rise in demands for IoT applications are propelling the growth of the global IoT in the banking market. Furthermore, increasing penetration of IoT-powered smartphones and smart wearables is also expected to aid in the growth of IoT solutions in the banking industry.

A. Region-wise, the IoT in banking market was dominated by North America in 2021, and is expected to retain its position during the forecast period, owing to high concentration of IoT in banking solution vendors in the region, which is expected to drive the market for IoT in banking technology during the forecast period.

A. The global IoT in banking market size was valued at $12.68 billion in 2021, and is projected to reach $237.36 billion by 2031, growing at a CAGR of 33.9% from 2022 to 2031.

A. The key players profiled in the IoT in banking market analysis are Accenture, Capgemini, Cisco Systems, Inc, Dynamics, Inc, GE Digital, IBM, Infosys Limited, Mastercard, Microsoft Corporation, Oracle Corporation, PTC, SAP SE, Software AG, Stripe, Temenos, Tibbo Systems, and Vodafone Group Plc. These players have adopted various strategies to increase their market penetration and strengthen their position in the industry.

Looking for Customization?

 Customization Request

Have a Question?

 Speak with Analyst

Any Confusion?

 Inquire Before Buying

Have a glance of the Report

  Request Sample
RELATED TAGS

Purchase Full Report of
Internet Of Things (iot) In Banking Market

Start reading instantly.
This Report and over 68,113+ more Reports, Available with Avenue Library. T&C*.

  • Online Only
  • $3,570
  • Online cloud access only
  • Restricted print, copy, paste & download
  • Read only
  • Free industry update
    (Within 180 days)
  • Free report update in next update cycle
    (Aug 2023 - Aug 2024)
  • Data Pack
  • $3,840
  • Restricted to one authorized user
  • One print only
  • Available in
    Excel
  • Free industry update
    (Within 180 days)
  •   Free report update in next update cycle
    (Aug 2023 - Aug 2024)
  • Single User
  • $5,730
  • Restricted to one authorized user
  • One print only
  • Available in
    PDF
  • Free industry update
    (Within 180 days)
  •   Free report update in next update cycle
    (Aug 2023 - Aug 2024)
  • Five Users
  • $6,450
  • Limited to five authorized users
  • Print upto five copies
  • Available in
    PDF
  • Free industry update
    (Within 180 days)
  •   Free report update in next update cycle
    (Aug 2023 - Aug 2024)
  • Enterprise
    License/PDF

  • $9,600
  • Unlimited
    within
    company/enterprise
  • Available in Excel & PDF
  • Free industry update
    (Within 180 days)
  •   Free report update in next update cycle
    (Aug 2023 - Aug 2024)
  • Library
    Membership

  • $999 $ 1,175
    Per User/ Per month/ Billed annually
  • Published Content
    E-access
  • Company Profiles
    E-access
  • Newly Added Content Access
  • 10 PDF
    Downloads
  • 5 Excel Data
    Pack Downloads
  • 250 Company Profiles PDF Downloads
  • Buy Now

*Taxes/Fees, if applicable will be added during checkout. All prices in USD

RELATED REPORTS
 

Why Allied Market Research?


Infallible Methodology

To ensure high-level data integrity, accurate analysis, and impeccable forecasts

Analyst Support

For complete satisfaction

Customization

On-demand customization of scope of the report to exactly meet your needs

TARGETED MARKET VIEW

Targeted market view to provide pertinent information and save time of readers

Get fresh content delivered

Get insights on topics that are crucial for your business. Stay abreast of your interest areas.

Get Industry Data Alerts

Why Allied Market Research?

Infallible Methodology

To ensure high-level data integrity, accurate analysis, and impeccable forecasts

Analyst Support

For complete satisfaction

Customization

On-demand customization of scope of the report to exactly meet your needs

TARGETED MARKET VIEW

Targeted market view to provide pertinent information and save time of readers