
IoT Medical Devices Market Research, 2033
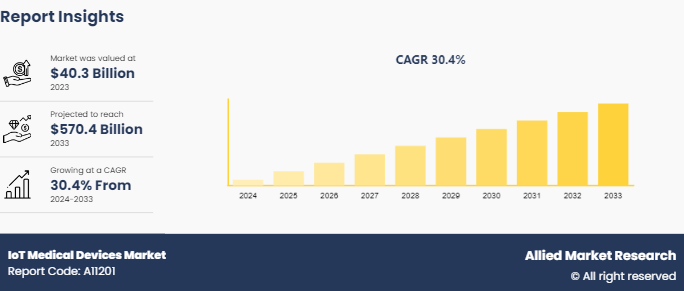
The global IoT medical devices market size was valued at $40.3 billion in 2023, and is projected to reach $570.4 billion by 2033, growing at a CAGR of 30.4% from 2024 to 2033. The growth of the IoT medical devices market is driven by advancements in healthcare technology, increased adoption of connected devices, and the rising prevalence of chronic diseases. Demand for remote patient monitoring, coupled with the integration of IoT in healthcare for improved patient care and data analytics, further boosts market expansion. Additionally, government initiatives to digitize healthcare and the growing need for cost-effective solutions in managing healthcare services are significant contributors to the IoT medical devices market growth.
Market Introduction and Definition
IoT medical devices are revolutionizing healthcare by enabling real-time monitoring, data collection, and communication between patients and healthcare providers. These devices, which include wearable sensors, connected implants, and smart monitoring systems, gather vital patient data such as heart rate, glucose levels, and blood pressure. This data is transmitted to healthcare professionals, allowing for timely interventions and personalized treatment plans. IoT devices improve patient outcomes, reduce hospital visits, and enhance chronic disease management. However, their adoption raises concerns about data security and privacy, emphasizing the need for robust cybersecurity measures in the healthcare industry.
Key Takeaways
- The IoT medical devices market share study covers 20 countries. The research includes a segment analysis of each country in terms of value for the projected period.
- More than 1, 500 product literatures, industry releases, annual reports, and other such documents of major IoT medical devices industry participants along with authentic industry journals, trade associations' releases, and government websites have been reviewed for generating high-value industry insights.
- The study integrated high-quality data, professional opinions and analysis, and critical independent perspectives. The research approach is intended to provide a balanced view of global markets and to assist stakeholders in making educated decisions in order to achieve their most ambitious growth objectives.
Key Market Dynamics
According to IoT medical devices market forecast analysis the key factors driving the growth of the market are increasing prevalence of chronic diseases, advancements in wireless technologies, and growing demand for remote patient monitoring. The increasing prevalence of chronic diseases, such as diabetes, cardiovascular conditions, and respiratory disorders, is a major driver for the growth of the IoT medical devices market. According to 2021 article by International Diabetes Federation, approximately 537 million people were living with diabetes globally. These conditions often require continuous monitoring and long-term management, making IoT-enabled devices essential for both patients and healthcare providers.
IoT medical devices, like wearable sensors and remote monitoring systems, allow real-time tracking of vital signs and health metrics, leading to timely interventions and improved patient outcomes. As chronic diseases become more widespread due to factors like aging populations and lifestyle changes, the demand for connected healthcare solutions is expected to rise, further boosting the IoT medical devices market growth.
In addition, according to IoT medical devices market opportunity analysis, advancements in wireless technologies play a pivotal role in driving the growth of the IoT medical devices market. These innovations have significantly enhanced connectivity, allowing for seamless data transmission between medical devices and healthcare systems. Improved wireless protocols, such as Bluetooth, Wi-Fi, and cellular networks, enable real-time monitoring of patients' health data, facilitating timely interventions and personalized care. Additionally, the integration of 5G technology offers higher data transfer rates and lower latency, which are crucial for applications requiring immediate response, such as remote surgeries and telemedicine consultations.
Furthermore, the miniaturization of sensors and the reduction in power consumption make it feasible to embed advanced wireless capabilities in smaller, portable devices, enhancing their usability and appeal. As a result, healthcare providers can leverage these technologies to improve patient outcomes, reduce hospital readmission rates, and optimize resource allocation, driving further investment and innovation in the IoT medical devices industry.
Furthermore, the growing demand for remote patient monitoring (RPM) is a significant driver of growth in the IoT medical devices market size. RPM enables healthcare providers to monitor patients' health data in real time from their homes, thereby improving patient outcomes and enhancing the efficiency of healthcare delivery. According to 2023 article by National Library of Medicine, in recent years, the internet-of-things (IoT) healthcare systems emerge as the recent trend and allow for remote monitoring, data collecting and analysis, automation of cardiology, telemedicine, remote surgeries, and general healthcare management to improve patient healthcare.
Growing 5G Coverage Globally
The growing global coverage of 5G networks is a major driver for the IoT medical devices market. With its high-speed connectivity and low latency, 5G enables real-time data transmission, enhancing the functionality and reliability of IoT medical devices. This improved connectivity facilitates remote patient monitoring, telemedicine, and the integration of wearable devices, allowing for timely interventions and better patient outcomes. As healthcare providers increasingly adopt IoT solutions, the demand for connected medical devices is expected to rise, driving innovation and improving healthcare delivery across various settings. The expansion of 5G infrastructure thus plays a crucial role in advancing this market.

Market Segmentation
The IoT medical devices market is segmented on the basis of product, connectivity, end user, and region. By product, the market is classified into wearable medical devices, implantable medical devices, stationary medical devices, and other IoT medical devices. By connectivity, the market is divided into Bluetooth and Wi-Fi. By end user, the market is divided into hospitals, nursing, homes, homecare, and other. Region wise, the market is analyzed across North America, Europe, Asia-Pacific, and LAMEA.
Regional/Country Market Outlook
North America has emerged as a major revenue generator in the IoT medical devices market share due to several factors. The region boasts a highly developed healthcare infrastructure, enabling the seamless integration of IoT technologies into medical devices. Additionally, the widespread adoption of advanced healthcare solutions, such as remote patient monitoring and telemedicine, is supported by strong investment in research and development. The presence of key market players, coupled with favorable regulatory policies promoting innovation, further accelerates market growth.
However, Asia-Pacific is expected to register the highest CAGR during the forecast period, driven by rapid technological advancements and growing healthcare investments in countries such as China, India, and Japan. The rising demand for improved healthcare services, fueled by a growing population and an increasing burden of chronic diseases, contributes to market expansion. Additionally, the adoption of digital health technologies and government initiatives to improve healthcare infrastructure are key growth factors.
- In 2021, Government of India launched the Ayushman Bharat Digital Mission in response to the emerging need for digitization of healthcare in India.
- Under Vision 2030, the Saudi Arabian Government plans to invest over $65 billion to develop the country’s healthcare infrastructure.
- According to the National Health Profile, India, in 2022, out of 99.1 million people screened under the National Program for Prevention & Control of Non-Communicable Diseases (NP-NCD) , around 7.5 million people were diagnosed with hypertension, 6.1 million people with diabetes, 2.9 million people with both hypertension & diabetes, 0.2 million people with CVDs, 0.1 million people with stroke, and 0.3 million people with common cancers.
Industry Trends
- In September 2023, Infosys announced the expansion of its strategic collaboration with NVIDIA Corporation. This collaboration aimed to generate technology and expertise needed to drive productivity with generative AI applications and solutions across various industries, including healthcare.
- In February 2023, Wipro Ltd partnered with Koninklijke Philips N.V. to offer Electronic Medical Record (EMR) enterprise solutions for the healthcare industry in Saudi Arabia. The integrated solution is in line with Saudi Arabia's Health Sector Transformation Program- Vision 2030.
- According to 2023 article by Agency for Healthcare Research and Quality, remote monitoring will continue to grow as an integral part of healthcare.
Competitive Landscape
IoT medical devices market report summarizes top key players overview as Medtronic Plc, GE Healthcare, Abbott Laboratories, Boston Scientific Corporation, Ormon Corporation, Baxter International Inc, BIoTronik, Johnson and Johnson, Nihon Kohden Corporation, and Koninklijke Philips N.V. Other players in the IoT medical devices market are Siemens Healthineers, IBM Watson Health, and Cisco Systems, Inc.
Key Benefits for Stakeholders
- This report provides a quantitative analysis of the market segments, current trends, estimations, and dynamics of the IoT medical devices market analysis from 2024 to 2033 to identify the prevailing IoT medical devices market opportunities.
- The market research is offered along with information related to key drivers, restraints, and opportunities.
- Porter's five forces analysis highlights the potency of buyers and suppliers to enable stakeholders make profit-oriented business decisions and strengthen their supplier-buyer network.
- In-depth analysis of the IoT medical devices market segmentation assists to determine the prevailing market opportunities.
- Major countries in each region are mapped according to their revenue contribution to the global market.
- Market player positioning facilitates benchmarking and provides a clear understanding of the present position of the market players.
- The report includes the analysis of the regional as well as global IoT medical devices market trends, key players, market segments, application areas, and market growth strategies.
IoT Medical Devices Market Report Highlights
| Aspects | Details |
| Market Size By 2033 | USD 570.4 Billion |
| Growth Rate | CAGR of 30.4% |
| Forecast period | 2024 - 2033 |
| Report Pages | 280 |
| By Product |
|
| By Connectivity |
|
| By End User |
|
| By Region |
|
| Key Market Players | Koninklijke Philips N.V., Nihon Kohden Corporation, Biotronik SE & Co. KG, Abbott Laboratories, Medtronic plc, Johnson and Johnson, Ormon Corporation, GE Healthcare, Baxter International Inc., Boston Scientific Corporation |
| Other Players | Siemens AG |
The global IoT medical devices market was valued at $40.3 billion in 2023
The market value of IoT Medical Devices market is projected to reach $570.4 billion by 2033
The forecast period for IoT Medical Devices market is 2024-2033.
The base year is 2023 in IoT Medical Devices market
Major key players that operate in the IoT Medical Devices market are Medtronic Plc, GE Healthcare, Abbott Laboratories, and Boston Scientific Corporation
Loading Table Of Content...

