0
2019
Japan Home Accessories Market

Japan Home Accessories Market

by Product (PC, Camera, Video Camera, Video Games, Recorder, and Other Home Accessories) and Distribution Channel (Supermarket, Specialty Store, Manufacturer Store, and E-commerce Company): Opportunity Analysis and Industry Forecast, 2018-2025

Report Code: A05021
Jul 2019 | Pages: 260
Tables: 29
Charts: 40
  • Formats*:

  • pdf

    Single User License, Five User
    License & Enterprise User License

  • xls

    Data Pack Excel License

  • ppt

    It comes with the additional cost
    of $2500.00 contact sales.


COVID-19

Pandemic disrupted the entire world and affected many industries.

Get detailed COVID-19 impact analysis on the Japan Home Accessories Market

Request Now !

Japan Home Accessories Market Outlook - 2025

The Japan home accessories market size was valued at $9,425.7 million in 2017 and is expected to reach $12,203.5 million by 2025, growing at a CAGR of 3.4% from 2018 to 2025. Home accessories are electronic (analog or digital) equipment intended for everyday use in homes. Home accessories can be categorized into small appliance or brown goods consumer electronics. These are generally equipped with special connections such as electrical or have an i50nbuilt battery and thus, helps in mobility of the appliances around the house. Small appliances are semi-portable or portable machines and are generally used on platforms such as counter-tops and table tops. Some of the small appliances are clocks, and speakers among others.  Consumer electronic devices are used for entertainment, communications, and home-office activities, such PCs, video game, recorder, and camera. 

Japan Home Accessories Market


Improvement in economic conditions and increase in disposable income are substantial factors that propel the Japan home accessories market growth. Improved lifestyle and rise in buying power of consumers are the major impacts of high disposable income. Home accessories have become an integral part of our daily chores. A substantial number of consumers with high disposable income have been spending on household accessories including premium & smart appliances. The overall demand for home accessories has increased among urban households, as they help save time, simplify the work, and fuel the comfort level. Thus, improved standard of living, rise in need to ease daily chores, and surge in disposable income are projected to boost the penetration of home accessories, thereby driving the Japan home accessories industry growth. In the past few years, lifestyle of populace has changed mainly due to tremendous rise in the number of working women. This has led to increase in household income and improvement in the living standards.

Developments in technology, rapid urbanization, increase in the construction sector, rise in per capita income, improvement in living standard, surge in need for comfort in homes, changes in consumer lifestyle, and escalation in number of smaller households are the key factors that drive the growth of the Japan home accessories market. In addition, inclination of consumers toward eco-friendly & energy-efficient appliances further boost the growth of the Japan home accessories market. Moreover, factors such as government initiatives for energy-efficient appliance undertaken across Japan are expected to facilitate the adoption of energy efficient appliances in the recent years.

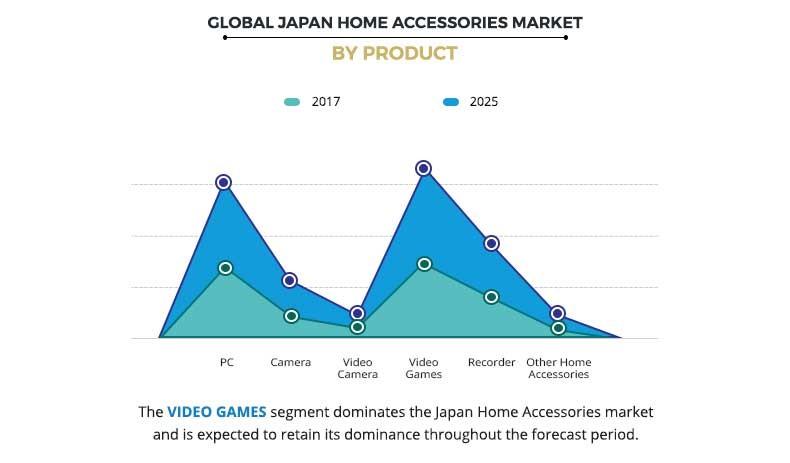
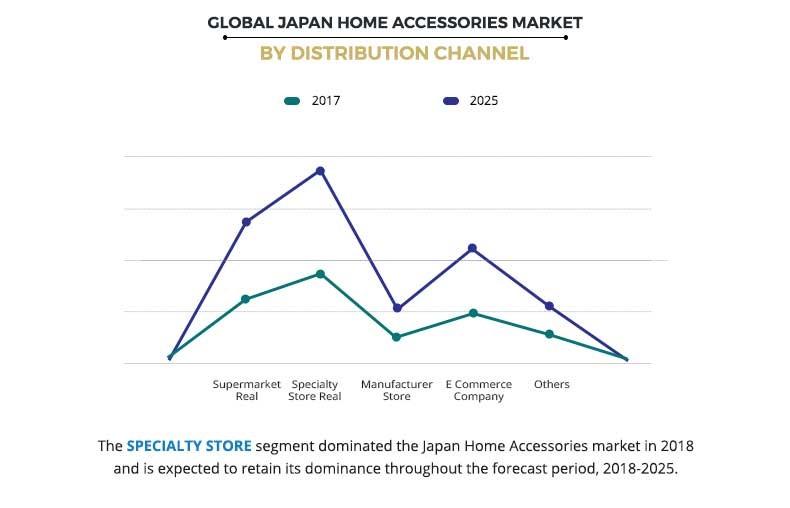
The Japan home accessories market is segmented based on product and distribution channel. Depending on product, the Japan home accessories market is classified into pc, camera, video camera, video games, recorder, and other home accessories. Based on distribution channel, the Japan home accessories market is classified into supermarket, specialty store, manufacturer store, and e-commerce company. 

Based on product, the Japan home accessories market is classified into pc, camera, video camera, video games, recorder, and other home accessories. The video game segment accounted for the largest japan home accessories market share in 2017. The video game segment has witnessed significant growth over the years mainly owing to high engagement of youth. Easy availability of video games on different devices such as personal computers, tablets, and laptops, are expected to drive the video game market. Decrease in cost of video game hardware coupled with easy availability of games are expected to fuel their demand. In addition, several consumers these days prefer cross-functional devices that offer integrated features and capabilities in the same device. This has encouraged the development of multifunctional devices. Computers are extensively used in numerous application areas, ranging from business and education to entertainment. In addition, wide spread of education for computer knowledge helps in creating more demand for PC in the Japan market.


 Japan Home Accessories Market by Product


Based on distribution channel, the Japan home accessories market is classified into supermarket, specialty store, manufacturer store, and e-commerce company. The specialty store segment accounted for the largest japan home accessories market share in 2017. Consumers usually prefer to analyze and evaluate the product before purchase, thereby boosting the retail sales of the home accessories market through specialty store. Customers check the working of appliances in the stores and the type of accessories compatible with them. Therefore, specialty stores are projected to gain demand in the near future. In addition, e-commerce sales is expected to increase an rise in number of online shoppers, owing to availability of varied product options and price comparison on online shopping sites. This is useful for retailers due to zero expenditure on physical outlets or stores. One of the major reasons behind consumers preferring online shopping is that consumers can read reviews provided by other users and compare various products as well as their prices by different sellers.
 

Japan Home Accessories Market by Distribution Channel


Some of the key strategies adopted by Japan home accessories industry players in this market are acquisition, business expansion, partnership, collaboration, product launch, merger, joint venture, and agreement. Key players profiled in the report include Hewlett-Packard (HP), Dell, Lenovo Group Limited (Lenovo), Sony Corporation (Sony), Canon Inc. (Sony), Nikon Corporation, Samsung Electronics Co, Sharp Corporation (Sharp), Panasonic Corporation (Panasonic), and Olympus Corporation.  


Key Benefits for Japan Home Accessories Market:

  • This report provides a quantitative analysis of the current Japan home accessories market trends, estimations, and dynamics of the market from 2018 to 2025 to identify the prevailing market opportunities.
  • An in-depth japan home accessories market analysis of the Japan home accessories market size helps determine the prevailing market opportunities.
  • Porter’s five forces analysis highlights the potency of buyers and suppliers to enable stakeholders to make profit-oriented business decisions and strengthen their supplier–buyer network.
  • The Japan home accessories market forecast is provided along with the information related to key drivers, restraints, and opportunities.
  • A detailed analysis of the Japan home accessories market segments measures the potential of the market. These segments outline the favorable conditions for the market forecast.

Japan Home Accessories Market Report Highlights

Aspects Details
By Distribution Channel
  • Market size and forecast
  • Supermarket
  • Specialty Store
  • Manufacturer Store
  • E-commerce
  • Others
Key Market Players SHARP CORPORATION, Olympus Corporation., SONY CORPORATION, HEWLETT-PACKARD, CANON INC., SAMSUNG ELECTRONICS CO, LENOVO GROUP LIMITED, DELL, NIKON CORPORATION, Panasonic Corporation
 

CHAPTER 1:INTRODUCTION

1.1.    Report Description
1.2.    Key Benefits for Stakeholders
1.3.    Key Market Segments
1.4.    Research Methodology

1.4.1.    Primary Research
1.4.2.    Secondary Research
1.4.3.    Analyst Tools and Models

CHAPTER 2:EXECUTIVE SUMMARY

2.1.    Key findings of the study
2.2.    CXO perspective

CHAPTER 3:MARKET OVERVIEW

3.1.    Market definition and scope
3.2.    Key findings

3.2.1.    Top investment pocket

3.3.    Porter's five forces analysis

3.3.1.    Bargaining power of suppliers
3.3.2.    Bargaining power of buyers
3.3.3.    Threat of substitution
3.3.4.    Threat of new entrants
3.3.5.    Intensity of competitive rivalry

3.4.    Market dynamics

3.4.1.    Drivers

3.4.1.1.    Rise in disposable income
3.4.1.2.    Growing infrastructure investment in residential sector
3.4.1.3.    Increase in urbanization

3.4.2.    Restraints

3.4.2.1.    Availability of counterfeit brands

3.4.3.    Opportunities

3.4.3.1.    Technological advancements
3.4.3.2.    Growth in e-commerce sales

3.5.    Overview
3.6.    PC
3.7.    Camera
3.8.    Video camera
3.9.    Video games
3.10.    Recorder
3.11.    Other home accessories

CHAPTER 4:JAPAN HOME ACCESSORIES  MARKET, BY DISTRIBUTION CHANNEL

4.1.    Overview

4.1.1.    Market size and forecast
4.1.2.    Supermarket
4.1.3.    Specialty Store
4.1.4.    Manufacturer Store
4.1.5.    E-commerce
4.1.6.    Others

CHAPTER 5:COMPANY PROFILES

5.1.    HEWLETT-PACKARD

5.1.1.    Company overview
5.1.2.    Company snapshot
5.1.3.    Operating business segments
5.1.4.    Product portfolio
5.1.5.    Business performance

5.2.    DELL

5.2.1.    Company overview
5.2.2.    Company snapshot
5.2.3.    Product portfolio

5.3.    LENOVO GROUP LIMITED

5.3.1.    Company overview
5.3.2.    Company snapshot
5.3.3.    Product portfolio
5.3.4.    Business performance

5.4.    SONY CORPORATION

5.4.1.    Company overview
5.4.2.    Company snapshot
5.4.3.    Product portfolio

5.5.    CANON INC.

5.5.1.    Company overview
5.5.2.    Company snapshot
5.5.3.    Operating business segments
5.5.4.    Product portfolio
5.5.5.    Business performance

5.6.    NIKON CORPORATION

5.6.1.    Company overview
5.6.2.    Company snapshot
5.6.3.    Operating business segments
5.6.4.    Product portfolio
1.1.1.    Business performance

5.7.    SAMSUNG ELECTRONICS CO

5.7.1.    Company overview
5.7.2.    Company snapshot
5.7.3.    Operating business segments
5.7.4.    Product portfolio
5.7.5.    Business performance

5.8.    SHARP CORPORATION

5.8.1.    Company overview
5.8.2.    Company snapshot
5.8.3.    Product portfolio

5.9.    Panasonic Corporation 

5.9.1.    Company overview
5.9.2.     Company snapshot
5.9.3.    Operating business segments
5.9.4.     Product portfolio
5.9.5.     Business performance
5.9.6.     Key strategic moves and developments

5.10.    Olympus Corporation.

5.10.1.    Company overview
5.10.2.  Company snapshot
5.10.3.    Operating business segments
5.10.4.     Product portfolio
5.10.5.     Business performance
5.10.6.    Key strategic moves and developments

LIST OF TABLES

TABLE 01.JAPAN HOME ACCESSORIES MARKET, BY PRODUCT, 2017–2025 ($MILLION)
TABLE 02.JAPAN HOME ACCESSORIES MARKET, BY DISTRIBUTION CHANNEL, 2017–2025 ($MILLION)
TABLE 03.JAPAN HOME ACCESSORIES MARKET THROUGH REAL SUPERMARKETS, 2017-2025 ($MILLION)
TABLE 04.JAPAN HOME ACCESSORIES MARKET THROUGH ECOMMERCE SUPERMARKETS, 2017-2025 ($MILLION)
TABLE 05.JAPAN HOME ACCESSORIES   MARKET THROUGH REAL SPECIALTY STORE, 2017-2025($MILLION)
TABLE 01.JAPAN HOME ACCESSORIES MARKET THROUGH REAL SPECIALTY STORES, 2017-2025 ($MILLION)
TABLE 01.JAPAN HOME ACCESSORIES MARKET THROUGH ECOMMERCE SPECIALTY STORES, 2017-2025 ($MILLION)
TABLE 01.JAPAN HOME ACCESSORIES MARKET THROUGH REAL MANUFACTURER STORE, 2017-2025 ($MILLION)
TABLE 02.JAPAN HOME ACCESSORIES MARKET THROUGH ECOMMERCE MANUFACTURERE STORE, 2017-2025 ($MILLION)
TABLE 01.JAPAN HOME ACCESSORIES MARKET THROUGH E-COMMERCE, 2017-2025 ($MILLION)
TABLE 01.JAPAN HOME ACCESSORIES MARKET THROUGH OTHER DISTRIBUTION CHANNELS, 2017-2025 ($MILLION)
TABLE 02.HEWLETT-PACKARD: COMPANY SNAPSHOT
TABLE 03.HEWLETT-PACKARD: OPERATING SEGMENTS
TABLE 04.HEWLETT-PACKARD: PRODUCT PORTFOLIO
TABLE 05.DELL: COMPANY SNAPSHOT
TABLE 06.DELL: PRODUCT PORTFOLIO
TABLE 07.LENOVO GROUP LIMITED: COMPANY SNAPSHOT
TABLE 08.LENOVO GROUP LIMITED: PRODUCT PORTFOLIO
TABLE 09.SONY CORPORATION: COMPANY SNAPSHOT
TABLE 10.SONY CORPORATION: PRODUCT PORTFOLIO
TABLE 11.CANON INC.: COMPANY SNAPSHOT
TABLE 12.CANON INC.: OPERATING SEGMENTS
TABLE 13.CANON INC.: PRODUCT PORTFOLIO
TABLE 14.NIKON CORPORATION: COMPANY SNAPSHOT
TABLE 15.NIKON CORPORATION: OPERATING SEGMENTS
TABLE 16.NIKON CORPORATION: PRODUCT PORTFOLIO
TABLE 17.SAMSUNG ELECTRONICS CO: COMPANY SNAPSHOT
TABLE 18.SAMSUNG ELECTRONICS CO: OPERATING SEGMENTS
TABLE 19.SAMSUNG ELECTRONICS CO: PRODUCT PORTFOLIO
TABLE 20. PANASONIC CORPORATION: COMPANY SNAPSHOT
TABLE 21. PANASONIC CORPORATION: PRODUCT PORTFOLIO
TABLE 22. PANASONIC CORPORATION: COMPANY SNAPSHOT
TABLE 23. PANASONIC CORPORATION: OPERATING SEGMENTS
TABLE 24. PANASONIC CORPORATION: PRODUCT PORTFOLIO
TABLE 25. PANASONIC CORPORATION: KEY STRATEGIC MOVES AND DEVELOPMENTS
TABLE 26. OLYMPUS CORPORATION: COMPANY SNAPSHOT
TABLE 27. OLYMPUS CORPORATION: OPERATING SEGMENTS
TABLE 28.OLYMPUS CORPORATION.: PRODUCT PORTFOLIO
TABLE 29. OLYMPUS CORPORATION.: KEY STRATEGIC MOVES AND DEVELOPMENTS

LIST OF FIGURES

FIGURE 01.KEY MARKET SEGMENTS
FIGURE 02.JAPAN HOME ACCESSORIES   MARKET SNAPSHOT
FIGURE 03.TOP INVESTMENT POCKETS
FIGURE 04.HIGH BARGAINING POWER OF SUPPLIERS
FIGURE 05.LOW BARGAINING POWER OF BUYERS
FIGURE 06.MODERATE THREAT OF SUBSTITUTION
FIGURE 07.MODERATE THREAT OF NEW ENTRANTS
FIGURE 08.HIGH INTENSITY OF COMPETITIVE RIVALRY
FIGURE 09.JAPAN HOME ACCESSORIES PC MARKET, 2017-2025($MILLION)
FIGURE 10.JAPAN HOME ACESSORIES CAMERA MARKET, 2017-2025($MILLION)
FIGURE 11.JAPAN HOME ACESSORIES VIDEO CAMERA MARKET, 2017-2025($MILLION)
FIGURE 12.JAPAN HOME ACESSORIES VIDEO GAMES MARKET, 2017-2025($MILLION)
FIGURE 13.JAPAN HOME ACESSORIES RECORDER MARKET, 2017-2025($MILLION)
FIGURE 14.JAPAN HOME ACESSORIES OTHER HOME ACCESSORIES MARKET, 2017-2025($MILLION)
FIGURE 15.JAPAN HOME ACCESSORIES MARKET SHARE, BY DISTRIBUTION CHANNEL, 2017(%)
FIGURE 16.JAPAN HOME ACCESSORIES MARKET THROUGH SUPERMARKET, 2017-2025($MILLION)
FIGURE 17.JAPAN HOME ACCESSORIES   MARKET THROUGH MANUFACTURER STORE, 2017-2025($MILLION)
FIGURE 18.JAPAN HOME ACCESSORIES   MARKET THROUGH E-COMMERCE CHANNELS, 2017-2025($MILLION)
FIGURE 19.    JAPAN HOME ACCESSORIES   MARKET THROUGH OTHER DISTRIBUTION CHANNEL, 2017-2025($MILLION)
FIGURE 20.HEWLETT-PACKARD: NET SALES, 2016–2018 ($MILLION)
FIGURE 21.HEWLETT-PACKARD: REVENUE SHARE BY SEGMENT, 2018 (%)
FIGURE 22.    HEWLETT-PACKARD: REVENUE SHARE BY REGION, 2018 (%)
FIGURE 23.LENOVO GROUP LIMITED: NET SALES, 2015–2017 ($MILLION)
FIGURE 24.LENOVO GROUP LIMITED: REVENUE SHARE BY COUNTRY, 2017 (%)
FIGURE 25.LENOVO GROUP LIMITED: REVENUE SHARE BY REGION, 2017 (%)
FIGURE 26.CANON INC.: NET SALES, 2016–2018 ($MILLION)
FIGURE 27.    CANON INC.: REVENUE SHARE BY SEGMENT, 2018 (%)
FIGURE 28.    CANON INC.: REVENUE SHARE BY REGION, 2018 (%)
FIGURE 29.NIKON CORPORATION: NET SALES, 2016–2018 ($MILLION)
FIGURE 30.NIKON CORPORATION: REVENUE SHARE BY SEGMENT, 2018 (%)
FIGURE 31.NIKON CORPORATION: REVENUE SHARE BY REGION, 2018 (%)
FIGURE 32.SAMSUNG ELECTRONICS CO: NET SALES, 2016–2018 ($MILLION)
FIGURE 33.SAMSUNG ELECTRONICS CO: REVENUE SHARE BY SEGMENT, 2018 (%)
FIGURE 34.SAMSUNG ELECTRONICS CO: REVENUE SHARE BY REGION, 2018 (%)
FIGURE 35. PANASONIC CORPORATION: REVENUE, 2016–2018 ($MILLION)
FIGURE 36. PANASONIC CORPORATION: REVENUE SHARE BY SEGMENT, 2018 (%)
FIGURE 37. PANASONIC CORPORATION: REVENUE SHARE BY REGION, 2018 (%)
FIGURE 38. OLYMPUS CORPORATION: NET SALES, 2016–2018 ($MILLION)
FIGURE 39. OLYMPUS CORPORATION: REVENUE SHARE BY SEGMENT, 2018 (%)
FIGURE 40. OLYMPUS CORPORATION.: REVENUE SHARE BY REGION, 2018 (%)


The Japan home accessories market is emerging at a considerable pace owing to several factors such as increase in compatibility of the appliances, enhanced internet penetration, changes in lifestyle patterns, and growth in concern about energy prices.

Moreover, videogames and camera segments are projected to register significant growth, due to rapid urbanization, increase in penetration of technology even in small cities, rise in disposable income, and improvement in standard of living.

Owing to increase in environmental concerns, consumers also prefer buying appliances that are eco-friendly and energy efficient. Therefore, manufacturers take steps to improve the product efficiency and reduce e-waste.

PURCHASE OPTIONS

Call or Email us

U.S.-Canada Toll-free: +1-800-792-5285
Int'l : +1-503-894-6022
Europe : +44-845-528-1300
Email : help@alliedmarketresearch.com

Looking for Customization?

 Customization Request

Have a Question?

 Speak with Analyst

Any Confusion?

 Inquire Before Buying

Have a glance of the Report

  Request Sample

Purchase Full Report of
Japan Home Accessories Market

Start reading instantly.
This Report and over 66,905+ more Reports, Available with Avenue Library. T&C*.

  • Online Only
  • $2,413
  • Online cloud access only
  • Restricted print, copy, paste & download
  • Read only
  • Free industry update
    (Within 180 days)
  • Free report update in next update cycle
    (Jul 2020 - Jul 2021)
  • Data Pack
  • $2,681
  • Restricted to one authorized user
  • One print only
  • Available in
    Excel
  • Free industry update
    (Within 180 days)
  •   Free report update in next update cycle
    (Jul 2020 - Jul 2021)
  • Single User
  • $3,750
  • Restricted to one authorized user
  • One print only
  • Available in
    PDF
  • Free industry update
    (Within 180 days)
  •   Free report update in next update cycle
    (Jul 2020 - Jul 2021)
  • Five Users
  • $4,504
  • Limited to five authorized users
  • Print upto five copies
  • Available in
    PDF
  • Free industry update
    (Within 180 days)
  •   Free report update in next update cycle
    (Jul 2020 - Jul 2021)
  • Enterprise
    License/PDF

  • $7,281
  • Unlimited
    within
    company/enterprise
  • Available in Excel & PDF
  • Free industry update
    (Within 180 days)
  •   Free report update in next update cycle
    (Jul 2020 - Jul 2021)
  • Library
    Membership

  • $999 $ 1,175
    Per User/ Per month/ Billed annually
  • Published Content
    E-access
  • Company Profiles
    E-access
  • Newly Added Content Access
  • 10 PDF
    Downloads
  • 5 Excel Data
    Pack Downloads
  • 250 Company Profiles PDF Downloads
  • Buy Now

*Taxes/Fees, if applicable will be added during checkout. All prices in USD

RELATED REPORTS
 

Why Allied Market Research?


Infallible Methodology

To ensure high-level data integrity, accurate analysis, and impeccable forecasts

Analyst Support

For complete satisfaction

Customization

On-demand customization of scope of the report to exactly meet your needs

TARGETED MARKET VIEW

Targeted market view to provide pertinent information and save time of readers

Get fresh content delivered

Get insights on topics that are crucial for your business. Stay abreast of your interest areas.

Get Industry Data Alerts

Why Allied Market Research?

Infallible Methodology

To ensure high-level data integrity, accurate analysis, and impeccable forecasts

Analyst Support

For complete satisfaction

Customization

On-demand customization of scope of the report to exactly meet your needs

TARGETED MARKET VIEW

Targeted market view to provide pertinent information and save time of readers