
Japan Household Appliance Market Outlook - 2025
The Japan household appliance market size was valued at $20,279.9 million in 2017, and is expected to reach $27,979.0 million by 2025, growing at a CAGR of 4.0% from 2018 to 2025. Household appliances can be categorized into major appliances or white goods, small appliances, and consumer electronics. Major appliances are large home appliances used for regular housekeeping tasks such as cooking, washing laundry, food preservation, and others. These are generally equipped with special connections such as electrical, gas, plumbing, and ventilation arrangements, and thus limits the mobility of the appliances around the house. Small appliances are semi-portable or portable machines and are generally used on platforms such as counter-tops and table tops. Some of the small appliances are air purifiers, humidifiers & de-humidifiers, blenders, clothes steamers & iron, electric kettle & coffee machines, and others. Consumer electronics include devices used for entertainment, communications, and home-office activities, such as TV, music system, and others.
Improvement in economic conditions and increase in disposable income are substantial factors that propel the Japan household appliance market growth. Improved lifestyle and rise in buying power of consumers are the major impacts of high disposable income. Household appliances have become an integral part of our daily chores. A substantial number of consumers with high disposable income have been spending on household appliances including premium & smart appliances. The overall demand for household appliances has increased among urban households, as household appliances help save time, simplify the work, and increase the comfort level. Thus, improved standard of living, rise in need to ease daily chores, and growth in disposable income are projected to boost the penetration of household appliances, thereby driving the Japan household appliance market growth. In the past few years, lifestyle of populace has changed mainly due to tremendous increase in the number of working women. This has led to increase in household income and improvement in the living standards. Since, both the family members (husband & wife) are busy with office work, they get less time to complete household chores. This has necessitated the use of various equipment that help carry out daily household chores. Usage of household appliances help households to save time for themselves as well as serve effectively in their work place.
Increase in a technologically advanced, rapid urbanization, growth of the housing sector, rise in per capita income, improvement in living standard, surge in need for comfort in household chores, changes in consumer lifestyle, and escalation in number of smaller households are the key factors that drive the growth of the Japan household appliance market. In addition, inclination of consumers toward eco-friendly & energy-efficient appliances further boost the growth of Japan household appliance market. Moreover, factors such as government initiatives for energy-efficient appliance undertaken across Japan are expected to facilitate the adoption of energy efficient appliances in the recent years.
The Japan household appliance market is segmented based on product and distribution channel. Depending on product, the market is classified into refrigerator, air conditioner & heater, entertainment & information appliances, washing machine, dish washer, wall oven, microwave, cooking appliances, coffee machine, blender, juicer, canister, deep cleaners, other vacuum cleaners, steam mop, and other appliances. Based on distribution channel, the Japan household appliance market is classified into supermarket, specialty store, manufacturer store, e-commerce company and others.
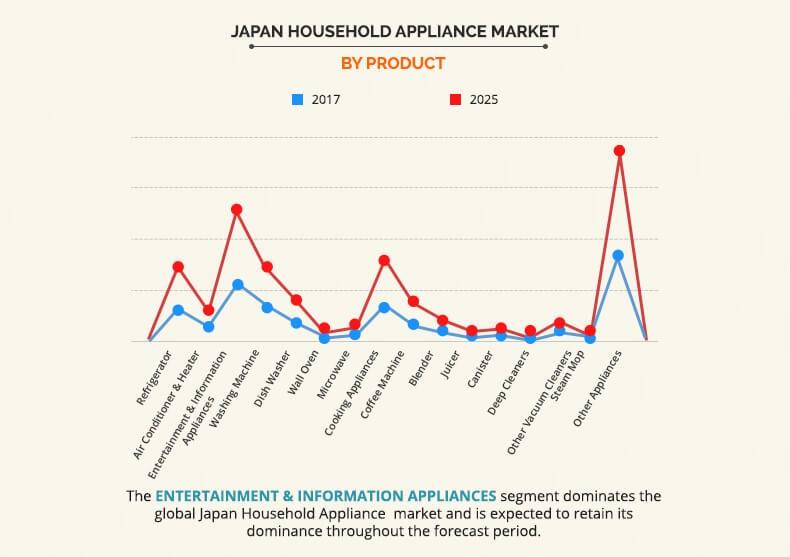
Based on product, the Japan household appliance market is classified into refrigerator, air conditioner & heater, entertainment & information appliances, washing machine, dish washer, wall oven, microwave, cooking appliances, coffee machine, blender, juicer, canister, deep cleaners, other vacuum cleaners, steam mop, and other appliances. In 2017, entertainment & information appliances market has witnessed significant growth over the years mainly due to technological improvements in television and other audio & video products and rise in disposable incomes of the consumers. Technological advancements and replacement play a vital role in the growth of the Japan household appliance market trends. Presently, the television market is in the fourth generation of connected TVs, with major manufacturers competing for TV models with the latest innovations in user interface, content aggregation, and application development. Smart TVs are equipped with an operating system to run apps and widgets, which can stream videos and music. It enables the user to access various new functions such as recording TV programs and surfing the Internet, by which user can access sites that include Google, Facebook, and others with the help of Wi-Fi connectivity.
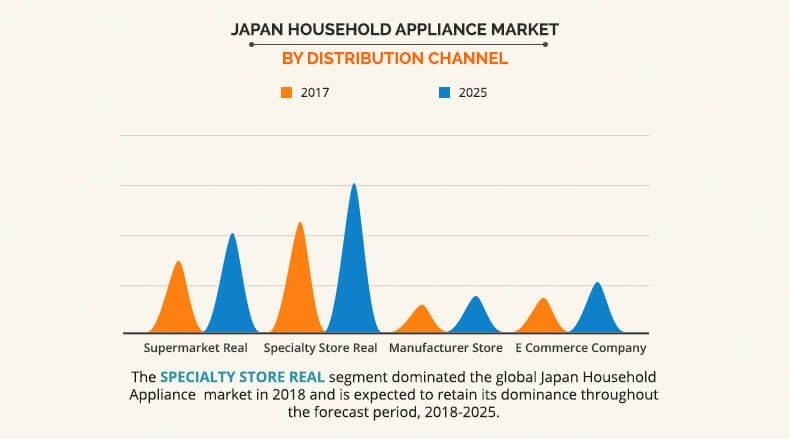
Based on distribution channel, the Japan household appliance market is classified into supermarket, specialty store, manufacturer store, e-commerce company and others. supermarket, specialty store, manufacturer store are further classified into real and e-commerce. In 2017, specialty store real held the largest Japan household appliance market share. Consumers usually prefer to analyze and evaluate the product before purchase, thereby boosting the retail sales of household appliances market through specialty store. Customers check the working of appliances in the stores and the type of accessories compatible with them. Therefore, specialty stores are projected to gain demand in the near future.
Some of the key strategies adopted by Japan Household Appliance Industry players in this market are acquisition, business expansion, partnership, collaboration, product launch, merger, joint venture, and agreement. Key players profiled in the report include AB Electrolux, Qingdao Haier Co., Ltd. (Haier), Hitachi, Ltd., LG Electronics Inc. (LG), Midea Group Co., Ltd. (Midea), Panasonic Corporation (Panasonic), Robert Bosch GmbH, Samsung Electronics Co., Ltd., Sharp Corporation (Sharp), and Whirlpool Corporation.
Key Benefits for Japan Household Appliance Market:
- This report provides a quantitative analysis of the current trends in Japan household appliance market, estimations, and dynamics of the market from 2018 to 2025 to identify the prevailing market opportunities.
- An in-depth Japan household appliance market analysis of the market size helps to determine the prevailing market opportunities.
- The key countries in all the major regions are mapped based on their market share.
- Porter’s five forces analysis highlights the potency of buyers and suppliers to enable stakeholders to make profit-oriented business decisions and strengthen their supplier–buyer network.
- The Japan household appliance market forecast are provided along with the information related to key drivers, restraints, and opportunities.
- A detailed analysis of the Japan household appliance market segments measures the potential of the market. These segments outline the favorable conditions for the market forecast.
Japan Household Appliance Market Report Highlights
| Aspects | Details |
| By Distribution Channel |
|
| Key Market Players | Olympus Corporation., HEWLETT-PACKARD, SAMSUNG ELECTRONICS CO, NIKON CORPORATION, SHARP CORPORATION, Panasonic Corporation, CANON INC., DELL, LENOVO GROUP LIMITED, SONY CORPORATION |
Analyst Review
The Japan household appliances market is emerging at a considerable pace owing several factors such as increase in compatibility of the appliances, enhanced internet penetration, changes in lifestyle patterns, and growth in concerns about energy prices. Over the years, there has been an increase in the women workforce; and therefore, families rely on different appliances for comfort. These appliances also help ease the chores and save time.
Moreover, Refrigerator and Canister are projected to register a significant growth, due to rapid urbanization, increase in penetration of technology even in small cities, growth in disposable income, and improvement in standard of living. In line with increase in environmental concerns, consumers also prefer to buy appliances that are eco-friendly and energy efficient. Therefore, manufacturers take steps to improve the product efficiency and reduce e-waste.
Loading Table Of Content...

