Report Code: A02375 | Nov 2019 | Pages: 270 | ||
Tables: 120 | Charts: 72 |
|
Pandemic disrupted the entire world and affected many industries.
Get detailed COVID-19 impact analysis on the Laboratory Automation Market
Request Now !The global laboratory automation market size was valued at $4,884 million in 2018, and is projected to reach $8,424 million by 2026, registering a CAGR of 6.9%. Laboratory automation is a multi-disciplinary innovative approach used in the laboratory to increase productivity, reduce times, and increase efficiency of the laboratory process. The laboratory automation market is anticipated to exhibit market growth during the forecast period due to technological advancements in laboratory equipment, and growth in adoption of automated laboratory equipment in pharmaceutical & R&D institutes. In addition, rise in demand for miniaturize process equipment further supports the market growth. However, higher initial investment impedes the market growth.
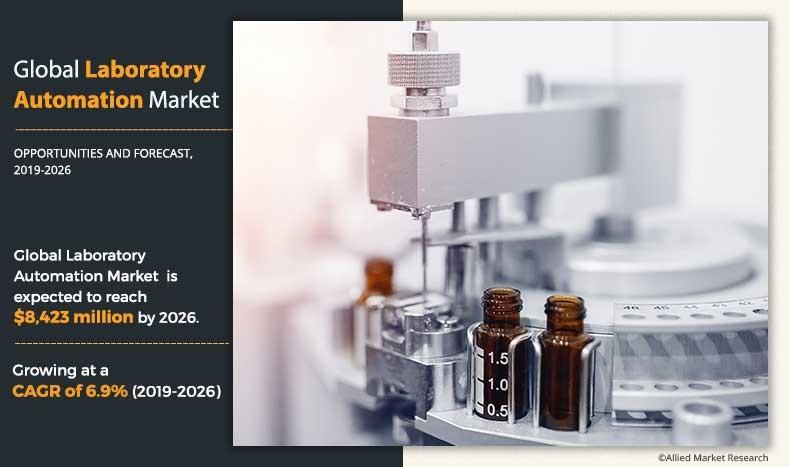
Laboratory Automation Market Size, Share, Growth & Segmentation By Product Type (Equipment and Software & Informatics), Application (Drug Discovery, Clinical Diagnostics, Genomics Solutions, and Proteomics Solutions), and End User (Biotechnology & Pharmaceutical Industries, Research Institutes, and Others): Global Opportunity Analysis and Industry Forecast, 2019–2026
By product, the market is categorized into equipment and software & informatics. At present, the equipment segment is the major revenue contributor and is estimated to grow significantly during the forecast period. Some key factors such as rise in demand for automated laboratory equipment, and technological advancements are majorly driving the market share.
By end user, the global laboratory automation market is categorized into biotechnology & pharmaceutical industries, research institutes, and others. Presently, the biotechnology & pharmaceutical industries segment is the major revenue contributor owing to large presence of pharmaceutical companies worldwide with increase in adoption of robotics & laboratory automation. In addition, laboratory automation has shifted from the support of products manufacturing & quality control in laboratory applications, to R&D within pharmaceutical companies; this factor further supports the market growth.
Snapshot of Asia-Pacific laboratory automation market
Asia-Pacific presents lucrative opportunities for the key players operating in the laboratory automation market. Surge in awareness about advanced laboratory automation systems, rise in number of pharmaceutical companies, and increase in demand for laboratory automation systems support the market growth. However, higher cost of laboratory automation systems hamper the market growth in Asia-Pacific. In addition, factors such as improvement in healthcare infrastructure, rise in number of hospitals equipped with advanced medical facilities, the developing R&D sector, and rise in healthcare reforms drive the market growth. Furthermore, surge in focus of leading manufacturers on expanding their geographic presence in emerging countries in Asia-Pacific further creates growth opportunities in this region.
The key players profiled in this report include Agilent Technologies, Inc., BioMerieux SA, Danaher Corporation, F. Hoffmann-La Roche AG, Hamilton Robotics, PerkinElmer, Inc., Qiagen N.V., Siemens AG, Tecan Group Ltd., and Thermo Fisher Scientific Inc.
Key Benefits for Laboratory Automation Market:
Laboratory Automation Key Market Segments:
End user
Laboratory Automation Market Report Highlights
Aspects | Details |
---|---|
By PRODUCT |
|
By APPLICATION |
|
By END-USER |
|
By Region |
|
Key Market Players | AGILENT TECHNOLOGIES, INC. (BIOTEK INSTRUMENTS, INC.), TECAN GROUP LTD., Hamilton Robotics, DANAHER CORPORATION (BECKMAN COULTER INC.,), PERKINELMER, INC., THERMO FISHER SCIENTIFIC, F. HOFFMANN-LA ROCHE AG, QIAGEN N.V., BIOMERIEUX SA, SIEMENS AG |
CHAPTER 1: INTRODUCTION
1.1. Report description
1.2. Key benefits for stakeholders
1.3. Key market segments
1.3.1. List of key players profiled in the report
1.4. Research methodology
1.4.1. Secondary research
1.4.2. Primary research
1.4.3. Analyst tools and models
CHAPTER 2: EXECUTIVE SUMMARY
2.1. Key findings of the study
2.2. Key findings
2.2.1. Top investment pockets
2.3. CXO perspective
CHAPTER 3: MARKET OVERVIEW
3.1. Market definition and scope
3.2. Key forces shaping laboratory automation market
3.2.1. Moderate power of suppliers
3.2.2. High threat of new entrants
3.2.3. High threat of substitution
3.2.4. Moderate competitive rivalry
3.2.5. Moderate bargaining power of buyers
3.3. Market dynamics
3.3.1. Drivers
3.3.1.1. Advantages offered by automated laboratories
3.3.1.2. Surge in adoption of laboratory automation systems
3.3.1.3. Increase in number of R&D activities
3.3.2. Restraint
3.3.2.1. High initial capital investments required for laboratory automation
3.3.3. Opportunities
3.3.3.1. Growth opportunities in emerging markets
3.3.4. Impact analysis
CHAPTER 4: LABORATORY AUTOMATION MARKET, BY PRODUCT
4.1. Overview
4.1.1. Market size and forecast
4.2. Equipment
4.2.1. Key market trends and opportunities
4.2.2. Market size and forecast, by type
4.2.3. Automated workstations
4.2.3.1. Market size and forecast, by type
4.2.3.2. Automated liquid handling
4.2.3.2.1. Market size and forecast, by type
4.2.3.2.2. Standalone
4.2.3.2.2.1. Market size and forecast
4.2.3.2.3. Individual benchtop workstations
4.2.3.2.3.1. Market size and forecast
4.2.3.2.4. Multi-purpose instruments
4.2.3.2.4.1. Market size and forecast
4.2.3.2.5. Others
4.2.3.2.5.1. Market size and forecast
4.2.3.3. Microplate readers
4.2.3.3.1. Market size and forecast, by type
4.2.3.3.2. Multi-mode microplate readers
4.2.3.3.2.1. Market size and forecast
4.2.3.3.3. Single-mode microplate readers
4.2.3.3.3.1. Market size and forecast
4.2.3.4. Automated ELISA systems
4.2.3.4.1. Market size and forecast
4.2.3.5. Automated nucleic acid purification systems
4.2.3.5.1. Market size and forecast
4.2.4. Robotic systems
4.2.4.1.1. Market size and forecast
4.2.5. Other equipment
4.2.5.1.1. Market size and forecast
4.2.6. Market size and forecast, by region
4.2.7. Market analysis, by country
4.3. Software & informatics
4.3.1. Key market trends and opportunities
4.3.1.1. Market size and forecast, by type
4.3.2. Workstation/ unit automation software
4.3.2.1. Market size and forecast
4.3.3. Laboratory information management system (LIMS)
4.3.3.1. Market size and forecast
4.3.4. Electronic laboratory notebook
4.3.4.1. Market size and forecast
4.3.5. Scientific data management system
4.3.5.1. Market size and forecast
4.3.6. Market size and forecast, by region
4.3.7. Market analysis, by country
CHAPTER 5: LABORATORY AUTOMATION MARKET, BY APPLICATION
5.1. Overview
5.1.1. Market size and forecast
5.2. Drug discovery
5.2.1. Market size and forecast, by region
5.2.2. Market analysis, by country
5.3. Clinical diagnostics
5.3.1. Market size and forecast, by region
5.3.2. Market analysis, by country
5.4. Genomics solutions
5.4.1. Market size and forecast, by region
5.4.2. Market analysis, by country
5.5. Proteomics solutions
5.5.1. Market size and forecast, by region
5.5.2. Market analysis, by country
CHAPTER 6: LABORATORY AUTOMATION MARKET, BY END-USER
6.1. Overview
6.1.1. Market size and forecast
6.2. Biotechnology & pharmaceutical industries
6.2.1. Market size and forecast, by region
6.2.2. Market analysis, by country
6.3. Research institutes
6.3.1. Market size and forecast, by region
6.3.2. Market analysis, by country
6.4. Others
6.4.1. Market size and forecast, by region
6.4.2. Market analysis, by country
CHAPTER 7: LABORATORY AUTOMATION MARKET, BY REGION
7.1. Overview
7.1.1. Market size and forecast
7.2. North America
7.2.1. Key market trends, growth factors, and opportunities
7.2.2. Market size and forecast, by country
7.2.2.1. U.S.
7.2.2.1.1. U.S. laboratory automation market, by product
7.2.2.1.2. U.S. laboratory automation market, by application
7.2.2.1.3. U.S. laboratory automation market, by end user
7.2.2.2. Canada
7.2.2.2.1. Canada laboratory automation market, by product
7.2.2.2.2. Canada laboratory automation market, by application
7.2.2.2.3. Canada laboratory automation market, by end user
7.2.2.3. Mexico
7.2.2.3.1. Mexico laboratory automation market, by product
7.2.2.3.2. Mexico laboratory automation market, by application
7.2.2.3.3. Mexico laboratory automation market, by end user
7.2.3. North America laboratory automation market, by product
7.2.4. North America laboratory automation market, by application
7.2.5. North America laboratory automation market, by end user
7.3. Europe
7.3.1. Key market trends, growth factors, and opportunities
7.3.2. Market size and forecast, by country
7.3.2.1. Germany
7.3.2.1.1. Germany laboratory automation market, by product
7.3.2.1.2. Germany laboratory automation market, by application
7.3.2.1.3. Germany laboratory automation market, by end user
7.3.2.2. France
7.3.2.2.1. France laboratory automation market, by product
7.3.2.2.2. France laboratory automation market, by application
7.3.2.2.3. France laboratory automation market, by end user
7.3.2.3. UK
7.3.2.3.1. UK laboratory automation market, by product
7.3.2.3.2. UK laboratory automation market, by application
7.3.2.3.3. UK laboratory automation market, by end user
7.3.2.4. Italy
7.3.2.4.1. Italy laboratory automation market, by product
7.3.2.4.2. Italy laboratory automation market, by application
7.3.2.4.3. Italy laboratory automation market, by end user
7.3.2.5. Spain
7.3.2.5.1. Spain laboratory automation market, by product
7.3.2.5.2. Spain laboratory automation market, by application
7.3.2.5.3. Spain laboratory automation market, by end user
7.3.2.6. Rest of Europe
7.3.2.6.1. Rest of Europe laboratory automation market, by product
7.3.2.6.2. Rest of Europe laboratory automation market, by application
7.3.2.6.3. Rest of Europe laboratory automation market, by end user
7.3.3. Europe laboratory automation market, by product
7.3.4. Europe laboratory automation market, by application
7.3.5. Europe laboratory automation market, by end user
7.4. Asia-Pacific
7.4.1. Key market trends, growth factors, and opportunities
7.4.2. Market size and forecast, by country
7.4.2.1. Japan
7.4.2.1.1. Japan laboratory automation market, by product
7.4.2.1.2. Japan laboratory automation market, by application
7.4.2.1.3. Japan laboratory automation market, by end user
7.4.2.2. China
7.4.2.2.1. China laboratory automation market, by product
7.4.2.2.2. China laboratory automation market, by application
7.4.2.2.3. China laboratory automation market, by end user
7.4.2.3. Australia
7.4.2.3.1. Australia laboratory automation market, by product
7.4.2.3.2. Australia laboratory automation market, by application
7.4.2.3.3. Australia laboratory automation market, by end user
7.4.2.4. India
7.4.2.4.1. India laboratory automation market, by product
7.4.2.4.2. India laboratory automation market, by application
7.4.2.4.3. India laboratory automation market, by end user
7.4.2.5. South Korea
7.4.2.5.1. South Korea laboratory automation market, by product
7.4.2.5.2. South Korea laboratory automation market, by application
7.4.2.5.3. South Korea laboratory automation market, by end user
7.4.2.6. Rest of Asia-Pacific
7.4.2.6.1. Rest of Asia-Pacific laboratory automation market, by product
7.4.2.6.2. Rest of Asia-Pacific laboratory automation market, by application
7.4.2.6.3. Rest of Asia-Pacific laboratory automation market, by end user
7.4.3. Asia-Pacific laboratory automation market, by product
7.4.4. Asia-Pacific laboratory automation market, by application
7.4.5. Asia-Pacific laboratory automation market, by end user
7.5. LAMEA
7.5.1. Key market trends, growth factors, and opportunities
7.5.2. Market size and forecast, by country
7.5.2.1. Brazil
7.5.2.1.1. Brazil laboratory automation market, by product
7.5.2.1.2. Brazil laboratory automation market, by application
7.5.2.1.3. Brazil laboratory automation market, by end user
7.5.2.2. Saudi Arabia
7.5.2.2.1. Saudi Arabia laboratory automation market, by product
7.5.2.2.2. Saudi Arabia laboratory automation market, by application
7.5.2.2.3. Saudi Arabia laboratory automation market, by end user
7.5.2.3. South Africa
7.5.2.3.1. South Africa laboratory automation market, by product
7.5.2.3.2. South Africa laboratory automation market, by application
7.5.2.3.3. South Africa laboratory automation market, by end user
7.5.2.4. Rest of LAMEA
7.5.2.4.1. Rest of LAMEA laboratory automation market, by product
7.5.2.4.2. Rest of LAMEA laboratory automation market, by application
7.5.2.4.3. Rest of LAMEA laboratory automation market, by end user
7.5.3. LAMEA laboratory automation market, by product
7.5.4. LAMEA laboratory automation market, by application
7.5.5. LAMEA laboratory automation market, by end user
CHAPTER 8: COMPANY PROFILES
8.1. AGILENT TECHNOLOGIES, INC. (BIOTEK INSTRUMENTS, INC.)
8.1.1. Company overview
8.1.2. Company snapshot
8.1.3. Operating business segments
8.1.4. Product portfolio
8.1.5. Business performance
8.1.6. Key strategic moves and developments
8.2. BIOMERIEUX SA
8.2.1. Company overview
8.2.2. Company snapshot
8.2.3. Operating business segments
8.2.4. Product portfolio
8.2.5. Business performance
8.3. DANAHER CORPORATION (BECKMAN COULTER INC.,)
8.3.1. Company overview
8.3.2. Company snapshot
8.3.3. Operating business segments
8.3.4. Product portfolio
8.3.5. Business performance
8.3.6. Key strategic moves and developments
8.4. F. HOFFMANN-LA ROCHE AG
8.4.1. Company overview
8.4.2. Company snapshot
8.4.3. Operating business segments
8.4.4. Product portfolio
8.4.5. Business performance
8.4.6. Key strategic moves and developments
8.5. Hamilton Robotics
8.5.1. Company overview
8.5.2. Company snapshot
8.5.3. Operating business segments
8.5.4. Product portfolio
8.5.5. Key strategic moves and developments
8.6. PERKINELMER, INC.
8.6.1. Company overview
8.6.2. Company snapshot
8.6.3. Operating business segments
8.6.4. Product portfolio
8.6.5. Business performance
8.7. QIAGEN N.V.
8.7.1. Company overview
8.7.2. Company snapshot
8.7.3. Operating business segments
8.7.4. Product portfolio
8.7.5. Business performance
8.7.6. Key strategic moves and developments
8.8. SIEMENS AG
8.8.1. Company overview
8.8.2. Company snapshot
8.8.3. Operating business segments
8.8.4. Product portfolio
8.8.5. Business performance
8.9. TECAN GROUP LTD.
8.9.1. Company overview
8.9.2. Company snapshot
8.9.3. Operating business segments
8.9.4. Product portfolio
8.9.5. Business performance
8.9.6. Key strategic moves and developments
8.10. THERMO FISHER SCIENTIFIC
8.10.1. Company overview
8.10.2. Company snapshot
8.10.3. Operating business segments
8.10.4. Product portfolio
8.10.5. Business performance
8.10.6. Key strategic moves and developments
LIST OF TABLES
TABLE 01. GLOBAL LABORATORY AUTOMATION MARKET, BY PRODUCT, 2018–2026 ($MILLION)
TABLE 02. LABORATORY AUTOMATION EQUIPMENT MARKET, BY TYPE, 2018–2026 ($MILLION)
TABLE 03. AUTOMATED WORKSTATIONS MARKET, 2018–2026 ($MILLION)
TABLE 04. AUTOMATED LIQUID HANDLING MARKET, 2018–2026 ($MILLION)
TABLE 05. MICROPLATE READERS MARKET, 2018–2026 ($MILLION)
TABLE 06. LABORATORY AUTOMATION EQUIPMENT MARKET, BY REGION, 2018–2026 ($MILLION)
TABLE 07. SOFTWARE & INFORMATICS MARKET, 2018–2026 ($MILLION)
TABLE 08. LABORATORY AUTOMATION SOFTWARE & INFORMATICS MARKET, BY REGION, 2018–2026 ($MILLION)
TABLE 09. GLOBAL LABORATORY AUTOMATION MARKET, BY APPLICATION, 2018–2026 ($MILLION)
TABLE 10. DRUG DISCOVERY MARKET, BY REGION, 2018–2026 ($MILLION)
TABLE 11. CLINICAL DIAGNOSTICS MARKET, BY REGION, 2018–2026 ($MILLION)
TABLE 12. GENOMICS SOLUTIONS MARKET, BY REGION, 2018–2026 ($MILLION)
TABLE 13. PROTEOMICS SOLUTIONS MARKET, BY REGION, 2018–2026 ($MILLION)
TABLE 14. GLOBAL LABORATORY AUTOMATION MARKET, BY END USER, 2018–2026 ($MILLION)
TABLE 15. BIOTECHNOLOGY & PHARMACEUTICAL INDUSTRIES MARKET, BY REGION, 2018–2026 ($MILLION)
TABLE 16. RESEARCH INSTITUTES MARKET, BY REGION, 2018–2026 ($MILLION)
TABLE 17. OTHERS MARKET, BY REGION, 2018–2026 ($MILLION)
TABLE 18. LABORATORY AUTOMATION MARKET REVENUE, BY REGION, 2018–2026 ($MILLION)
TABLE 19. NORTH AMERICA LABORATORY AUTOMATION MARKET, BY COUNTRY, 2018–2026 ($MILLION)
TABLE 20. U.S. LABORATORY AUTOMATION MARKET, BY PRODUCT, 2018–2026
TABLE 21. U.S. LABORATORY AUTOMATION MARKET, BY APPLICATION, 2018–2026
TABLE 22. U.S. LABORATORY AUTOMATION MARKET, BY END USER, 2018–2026
TABLE 23. CANADA LABORATORY AUTOMATION MARKET, BY PRODUCT, 2018–2026
TABLE 24. CANADA LABORATORY AUTOMATION MARKET, BY APPLICATION, 2018–2026
TABLE 25. CANADA LABORATORY AUTOMATION MARKET, BY END USER, 2018–2026
TABLE 26. MEXICO LABORATORY AUTOMATION MARKET, BY PRODUCT, 2018–2026
TABLE 27. MEXICO LABORATORY AUTOMATION MARKET, BY APPLICATION, 2018–2026
TABLE 28. MEXICO LABORATORY AUTOMATION MARKET, BY END USER, 2018–2026
TABLE 29. NORTH AMERICA LABORATORY AUTOMATION MARKET, BY PRODUCT, 2018–2026
TABLE 30. NORTH AMERICA LABORATORY AUTOMATION MARKET, BY APPLICATION, 2018–2026
TABLE 31. NORTH AMERICA LABORATORY AUTOMATION MARKET, BY END USER, 2018–2026
TABLE 32. EUROPE LABORATORY AUTOMATION MARKET, BY COUNTRY, 2018–2026 ($MILLION)
TABLE 33. GERMANY LABORATORY AUTOMATION MARKET, BY PRODUCT, 2018–2026
TABLE 34. GERMANY LABORATORY AUTOMATION MARKET, BY APPLICATION, 2018–2026
TABLE 35. GERMANY LABORATORY AUTOMATION MARKET, BY END USER, 2018–2026
TABLE 36. FRANCE LABORATORY AUTOMATION MARKET, BY PRODUCT, 2018–2026
TABLE 37. FRANCE LABORATORY AUTOMATION MARKET, BY APPLICATION, 2018–2026
TABLE 38. FRANCE LABORATORY AUTOMATION MARKET, BY END USER, 2018–2026
TABLE 39. UK LABORATORY AUTOMATION MARKET, BY PRODUCT, 2018–2026
TABLE 40. UK LABORATORY AUTOMATION MARKET, BY APPLICATION, 2018–2026
TABLE 41. UK LABORATORY AUTOMATION MARKET, BY END USER, 2018–2026
TABLE 42. ITALY LABORATORY AUTOMATION MARKET, BY PRODUCT, 2018–2026
TABLE 43. ITALY LABORATORY AUTOMATION MARKET, BY APPLICATION, 2018–2026
TABLE 44. ITALY LABORATORY AUTOMATION MARKET, BY END USER, 2018–2026
TABLE 45. SPAIN LABORATORY AUTOMATION MARKET, BY PRODUCT, 2018–2026
TABLE 46. SPAIN LABORATORY AUTOMATION MARKET, BY APPLICATION, 2018–2026
TABLE 47. SPAIN LABORATORY AUTOMATION MARKET, BY END USER, 2018–2026
TABLE 48. REST OF EUROPE LABORATORY AUTOMATION MARKET, BY PRODUCT, 2018–2026
TABLE 49. REST OF EUROPE LABORATORY AUTOMATION MARKET, BY APPLICATION, 2018–2026
TABLE 50. REST OF EUROPE LABORATORY AUTOMATION MARKET, BY END USER, 2018–2026
TABLE 51. EUROPE LABORATORY AUTOMATION MARKET, BY PRODUCT, 2018–2026
TABLE 52. EUROPE LABORATORY AUTOMATION MARKET, BY APPLICATION, 2018–2026
TABLE 53. EUROPE LABORATORY AUTOMATION MARKET, BY END USER, 2018–2026
TABLE 54. ASIA-PACIFIC LABORATORY AUTOMATION MARKET, BY COUNTRY, 2018–2026 ($MILLION)
TABLE 55. JAPAN LABORATORY AUTOMATION MARKET, BY PRODUCT, 2018–2026
TABLE 56. JAPAN LABORATORY AUTOMATION MARKET, BY APPLICATION, 2018–2026
TABLE 57. JAPAN LABORATORY AUTOMATION MARKET, BY END USER, 2018–2026
TABLE 58. CHINA LABORATORY AUTOMATION MARKET, BY PRODUCT, 2018–2026
TABLE 59. CHINA LABORATORY AUTOMATION MARKET, BY APPLICATION, 2018–2026
TABLE 60. CHINA LABORATORY AUTOMATION MARKET, BY END USER, 2018–2026
TABLE 61. AUSTRALIA LABORATORY AUTOMATION MARKET, BY PRODUCT, 2018–2026
TABLE 62. AUSTRALIA LABORATORY AUTOMATION MARKET, BY APPLICATION, 2018–2026
TABLE 63. AUSTRALIA LABORATORY AUTOMATION MARKET, BY END USER, 2018–2026
TABLE 64. INDIA LABORATORY AUTOMATION MARKET, BY PRODUCT, 2018–2026
TABLE 65. INDIA LABORATORY AUTOMATION MARKET, BY APPLICATION, 2018–2026
TABLE 66. INDIA LABORATORY AUTOMATION MARKET, BY END USER, 2018–2026
TABLE 67. SOUTH KOREA LABORATORY AUTOMATION MARKET, BY PRODUCT, 2018–2026
TABLE 68. SOUTH KOREA LABORATORY AUTOMATION MARKET, BY APPLICATION, 2018–2026
TABLE 69. SOUTH KOREA LABORATORY AUTOMATION MARKET, BY END USER, 2018–2026
TABLE 70. REST OF ASIA-PACIFIC LABORATORY AUTOMATION MARKET, BY PRODUCT, 2018–2026
TABLE 71. REST OF ASIA-PACIFIC LABORATORY AUTOMATION MARKET, BY APPLICATION, 2018–2026
TABLE 72. REST OF ASIA-PACIFIC LABORATORY AUTOMATION MARKET, BY END USER, 2018–2026
TABLE 73. ASIA-PACIFIC LABORATORY AUTOMATION MARKET, BY PRODUCT, 2018–2026
TABLE 74. ASIA-PACIFIC LABORATORY AUTOMATION MARKET, BY APPLICATION, 2018–2026
TABLE 75. ASIA-PACIFIC LABORATORY AUTOMATION MARKET, BY END USER, 2018–2026
TABLE 76. LAMEA LABORATORY AUTOMATION MARKET, BY COUNTRY, 2018–2026 ($MILLION)
TABLE 77. BRAZIL LABORATORY AUTOMATION MARKET, BY PRODUCT, 2018–2026
TABLE 78. BRAZIL LABORATORY AUTOMATION MARKET, BY APPLICATION, 2018–2026
TABLE 79. BRAZIL LABORATORY AUTOMATION MARKET, BY END USER, 2018–2026
TABLE 80. SAUDI ARABIA LABORATORY AUTOMATION MARKET, BY PRODUCT, 2018–2026
TABLE 81. SAUDI ARABIA LABORATORY AUTOMATION MARKET, BY APPLICATION, 2018–2026
TABLE 82. SAUDI ARABIA LABORATORY AUTOMATION MARKET, BY END USER, 2018–2026
TABLE 83. SOUTH AFRICA LABORATORY AUTOMATION MARKET, BY PRODUCT, 2018–2026
TABLE 84. SOUTH AFRICA LABORATORY AUTOMATION MARKET, BY APPLICATION, 2018–2026
TABLE 85. SOUTH AFRICA LABORATORY AUTOMATION MARKET, BY END USER, 2018–2026
TABLE 86. REST OF LAMEA LABORATORY AUTOMATION MARKET, BY PRODUCT, 2018–2026
TABLE 87. REST OF LAMEA LABORATORY AUTOMATION MARKET, BY APPLICATION, 2018–2026
TABLE 88. REST OF LAMEA LABORATORY AUTOMATION MARKET, BY END USER, 2018–2026
TABLE 89. LAMEA LABORATORY AUTOMATION MARKET, BY PRODUCT, 2018–2026
TABLE 90. LAMEA LABORATORY AUTOMATION MARKET, BY APPLICATION, 2018–2026
TABLE 91. LAMEA LABORATORY AUTOMATION MARKET, BY END USER, 2018–2026
TABLE 92. AGILENT: COMPANY SNAPSHOT
TABLE 93. AGILENT: OPERATING SEGMENTS
TABLE 94. AGILENT: PRODUCT PORTFOLIO
TABLE 95. BIOMERIEUX: COMPANY SNAPSHOT
TABLE 96. BIOMERIEUX: OPERATING SEGMENTS
TABLE 97. BIOMERIEUX: PRODUCT PORTFOLIO
TABLE 98. DANAHER: COMPANY SNAPSHOT
TABLE 99. DANAHER: OPERATING SEGMENTS
TABLE 100. DANAHER: PRODUCT PORTFOLIO
TABLE 101. ROCHE: COMPANY SNAPSHOT
TABLE 102. ROCHE: OPERATING SEGMENTS
TABLE 103. ROCHE: PRODUCT PORTFOLIO
TABLE 104. HAMILTON ROBOTICS: COMPANY SNAPSHOT
TABLE 105. HAMILTON ROBOTICS: PRODUCT PORTFOLIO
TABLE 106. PERKINELMER: COMPANY SNAPSHOT
TABLE 107. PERKINELMER: OPERATING SEGMENTS
TABLE 108. PERKINELMER: PRODUCT PORTFOLIO
TABLE 109. QIAGEN: COMPANY SNAPSHOT
TABLE 110. QIAGEN: OPERATING SEGMENTS
TABLE 111. QIAGEN: PRODUCT PORTFOLIO
TABLE 112. SIEMENS: COMPANY SNAPSHOT
TABLE 113. SIEMENS: OPERATING SEGMENTS
TABLE 114. SIEMENS: PRODUCT PORTFOLIO
TABLE 115. TECAN: COMPANY SNAPSHOT
TABLE 116. TECAN: OPERATING SEGMENTS
TABLE 117. TECAN: PRODUCT PORTFOLIO
TABLE 118. THERMO FISHER SCIENTIFIC: COMPANY SNAPSHOT
TABLE 119. THERMO FISHER SCIENTIFIC: OPERATING SEGMENTS
TABLE 120. THERMO FISHER SCIENTIFIC: PRODUCT PORTFOLIO
LIST OF FIGURES
FIGURE 01. TOP INVESTMENT POCKETS
FIGURE 02. GLOBAL LABORATORY AUTOMATION MARKET SEGMENTATION
FIGURE 03. IMPACT ANALYSIS
FIGURE 04. STANDALONE MARKET, 2018–2026 ($MILLION)
FIGURE 05. INDIVIDUAL BENCHTOP WORKSTATIONS MARKET, 2018–2026 ($MILLION)
FIGURE 06. MULTI-PURPOSE INSTRUMENTS MARKET, 2018–2026 ($MILLION)
FIGURE 07. OTHERS MARKET, 2018–2026 ($MILLION)
FIGURE 08. MULTI-MODE MICROPLATE READERS MARKET, 2018–2026 ($MILLION)
FIGURE 09. SINGLE-MODE MICROPLATE READERS MARKET, 2018–2026 ($MILLION)
FIGURE 10. AUTOMATED ELISA SYSTEMS MARKET, 2018–2026 ($MILLION)
FIGURE 11. AUTOMATED NUCLEIC ACID PURIFICATION SYSTEMS MARKET, 2018–2026 ($MILLION)
FIGURE 12. ROBOTIC SYSTEM MARKET, 2018–2026 ($MILLION)
FIGURE 13. OTHER EQUIPMENT MARKET, 2018–2026 ($MILLION)
FIGURE 14. COMPARATIVE ANALYSIS OF LABORATORY AUTOMATION EQUIPMENT MARKET, BY COUNTRY, 2018 & 2026 ($MILLION)
FIGURE 15. WORKSTATION/ UNIT AUTOMATION SOFTWARE MARKET, 2018–2026 ($MILLION)
FIGURE 16. LABORATORY INFORMATION MANAGEMENT SYSTEM LIMS MARKET, 2018–2026 ($MILLION)
FIGURE 17. ELECTRONIC LABORATORY NOTEBOOK MARKET, 2018–2026 ($MILLION)
FIGURE 18. SCIENTIFIC DATA MANAGEMENT SYSTEM MARKET, 2018–2026 ($MILLION)
FIGURE 19. COMPARATIVE ANALYSIS OF LABORATORY AUTOMATION SOFTWARE & INFORMATICS MARKET, BY COUNTRY, 2018 & 2026 ($MILLION)
FIGURE 20. COMPARATIVE ANALYSIS OF DRUG DISCOVERY MARKET, BY COUNTRY, 2018 & 2026 ($MILLION)
FIGURE 21. COMPARATIVE ANALYSIS OF CLINICAL DIAGNOSTICS MARKET, BY COUNTRY, 2018 & 2026 ($MILLION)
FIGURE 22. COMPARATIVE ANALYSIS OF GENOMICS SOLUTIONS MARKET, BY COUNTRY, 2018 & 2026 ($MILLION)
FIGURE 23. COMPARATIVE ANALYSIS OF PROTEOMICS SOLUTIONS MARKET, BY COUNTRY, 2018 & 2026 ($MILLION)
FIGURE 24. COMPARATIVE ANALYSIS OF BIOTECHNOLOGY & PHARMACEUTICAL INDUSTRIES MARKET, BY COUNTRY, 2018 & 2026 ($MILLION)
FIGURE 25. COMPARATIVE ANALYSIS OF RESEARCH INSTITUTES MARKET, BY COUNTRY, 2018 & 2026 ($MILLION)
FIGURE 26. COMPARATIVE ANALYSIS OF OTHERS MARKET, BY COUNTRY, 2018 & 2026 ($MILLION)
FIGURE 27. U.S. LABORATORY AUTOMATION MARKET, 2018–2026 ($MILLION)
FIGURE 28. CANADA LABORATORY AUTOMATION MARKET, 2018–2026 ($MILLION)
FIGURE 29. MEXICO LABORATORY AUTOMATION MARKET, 2018–2026 ($MILLION)
FIGURE 30. GERMANY LABORATORY AUTOMATION MARKET, 2018–2026 ($MILLION)
FIGURE 31. FRANCE LABORATORY AUTOMATION MARKET, 2018–2026 ($MILLION)
FIGURE 32. UK LABORATORY AUTOMATION MARKET, 2018–2026 ($MILLION)
FIGURE 33. ITALY LABORATORY AUTOMATION MARKET, 2018–2026 ($MILLION)
FIGURE 34. SPAIN LABORATORY AUTOMATION MARKET, 2018–2026 ($MILLION)
FIGURE 35. REST OF EUROPE LABORATORY AUTOMATION MARKET, 2018–2026 ($MILLION)
FIGURE 36. JAPAN LABORATORY AUTOMATION MARKET, 2018–2026 ($MILLION)
FIGURE 37. CHINA LABORATORY AUTOMATION MARKET, 2018–2026 ($MILLION)
FIGURE 38. AUSTRALIA LABORATORY AUTOMATION MARKET, 2018–2026 ($MILLION)
FIGURE 39. INDIA LABORATORY AUTOMATION MARKET, 2018–2026 ($MILLION)
FIGURE 40. SOUTH KOREA LABORATORY AUTOMATION MARKET, 2018–2026 ($MILLION)
FIGURE 41. REST OF ASIA-PACIFIC LABORATORY AUTOMATION MARKET, 2018–2026 ($MILLION)
FIGURE 42. BRAZIL LABORATORY AUTOMATION MARKET, 2018–2026 ($MILLION)
FIGURE 43. SAUDI ARABIA LABORATORY AUTOMATION MARKET, 2018–2026 ($MILLION)
FIGURE 44. SOUTH AFRICA LABORATORY AUTOMATION MARKET, 2018–2026 ($MILLION)
FIGURE 45. REST OF LAMEA LABORATORY AUTOMATION MARKET, 2018–2026 ($MILLION)
FIGURE 46. AGILENT: NET SALES, 2016–2018 ($MILLION)
FIGURE 47. AGILENT: REVENUE SHARE BY SEGMENT, 2018 (%)
FIGURE 48. AGILENT: REVENUE SHARE BY REGION, 2018 (%)
FIGURE 49. BIOMERIEUX: NET SALES, 2016–2018 ($MILLION)
FIGURE 50. BIOMERIEUX: REVENUE SHARE BY SEGMENT, 2018 (%)
FIGURE 51. BIOMERIEUX: REVENUE SHARE BY REGION, 2018 (%)
FIGURE 52. DANAHER: NET SALES, 2016–2018 ($MILLION)
FIGURE 53. DANAHER: REVENUE SHARE BY SEGMENT, 2018 (%)
FIGURE 54. DANAHER: REVENUE SHARE BY REGION, 2018 (%)
FIGURE 55. ROCHE: NET SALES, 2016–2018 ($MILLION)
FIGURE 56. ROCHE: REVENUE SHARE BY SEGMENT, 2018 (%)
FIGURE 57. ROCHE: REVENUE SHARE BY REGION, 2018 (%)
FIGURE 58. PERKINELMER: NET SALES, 2016–2018 ($MILLION)
FIGURE 59. PERKINELMER: REVENUE SHARE BY SEGMENT, 2018 (%)
FIGURE 60. PERKINELMER: REVENUE SHARE BY REGION, 2018 (%)
FIGURE 61. QIAGEN: NET SALES, 2016–2018 ($MILLION)
FIGURE 62. QIAGEN: REVENUE SHARE BY SEGMENT, 2018 (%)
FIGURE 63. QIAGEN: REVENUE SHARE BY REGION, 2018 (%)
FIGURE 64. SIEMENS: NET SALES, 2016–2018 ($MILLION)
FIGURE 65. SIEMENS: REVENUE SHARE BY SEGMENT, 2018 (%)
FIGURE 66. SIEMENS: REVENUE SHARE BY REGION, 2018 (%)
FIGURE 67. TECAN: NET SALES, 2016–2018 ($MILLION)
FIGURE 68. TECAN: REVENUE SHARE BY SEGMENT, 2018 (%)
FIGURE 69. TECAN: REVENUE SHARE BY REGION, 2018 (%)
FIGURE 70. THERMO FISHER SCIENTIFIC: NET SALES, 2016–2018 ($MILLION)
FIGURE 71. THERMO FISHER SCIENTIFIC: REVENUE SHARE BY SEGMENT, 2018 (%)
FIGURE 72. THERMO FISHER SCIENTIFIC: REVENUE SHARE BY REGION, 2018 (%)
Laboratory automation is a multi-disciplinary innovative approach use in the laboratory to perform scientific experiments, carry out research, and execute analysis of different scientific materials. Automated laboratory systems are widely use in biotechnology & pharmaceutical industries, research institutes, hospitals and academic institutes to enhance workflow in shorter time.
Growing in adoption of automated laboratory equipment in pharmaceutical & R&D institutes, technological advancement in lab automation systems, and increase in demand for miniaturize process equipment majorly driving the market growth. In addition, advantages offered by laboratory automation such as increase in productivity, improve efficiency, lower cost of operation, reduce fluctuation in the production further supports the market growth.
North America is expected to remain dominant during the forecast period due to higher adoption of laboratory automation system, large presence of pharmaceutical companies and R&D institutes, wide availability of advanced laboratory automation system with trained medical professionals, large presence of key players. In addition, Asia-Pacific and LAMEA are expected to offer lucrative opportunities to the key players during the forecast period due to increase in adoption of laboratory automation systems with developing infrastructure of pharmaceutical industries and improvement in R&D sectors.
Start reading instantly.
This Report and over 67,132+ more Reports, Available with Avenue Library. T&C*.
Enterprise
License/PDF
Library
Membership
*Taxes/Fees, if applicable will be added during checkout. All prices in USD
To ensure high-level data integrity, accurate analysis, and impeccable forecasts
For complete satisfaction
On-demand customization of scope of the report to exactly meet your needs
Targeted market view to provide pertinent information and save time of readers
Get insights on topics that are crucial for your business. Stay abreast of your interest areas.
Get Industry Data AlertsTo ensure high-level data integrity, accurate analysis, and impeccable forecasts
For complete satisfaction
On-demand customization of scope of the report to exactly meet your needs
Targeted market view to provide pertinent information and save time of readers