Report Code: A08423 | Nov 2021 | Pages: 237 | ||
Tables: 121 | Charts: 48 |
|
Pandemic disrupted the entire world and affected many industries.
Get detailed COVID-19 impact analysis on the Laboratory Filtration Market
Request Now !
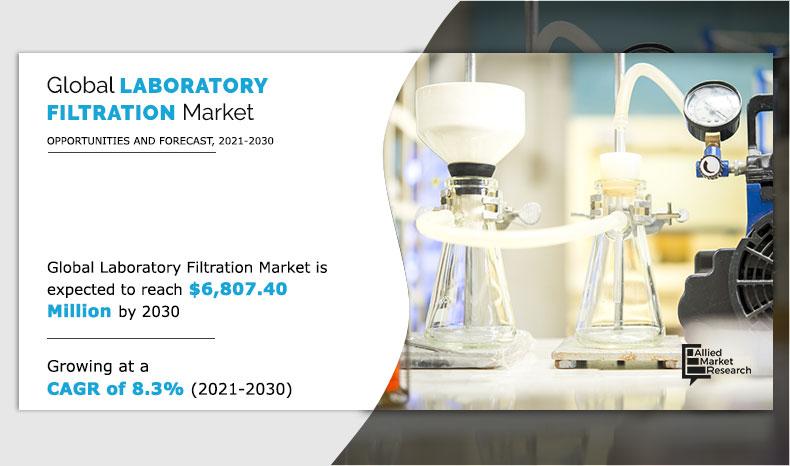
The global laboratory filtration market size was valued at $3,061.30 million in 2020, and is projected to reach $6,807.40 million by 2030, registering a CAGR of 8.3% from 2021 to 2030. Filtration is a sterilization method, which is used in laboratories. It is one of the most crucial step in almost all kinds of laboratory process related to environmental, chemistry, and life sciences applications. It is a technique involved to either purify or concentrate samples in the laboratory. Filtration depends on pore sizes, the smaller the pores the more particles it can screen out. Pore sizes can be as small as .01 μm (μm=micrometer), small enough to stop viruses from passing through, but smaller proteins can still get through. Nano-filters are capable of stopping viruses, proteins, and some toxins. Moreover, filtration is a great option for sterilizing heat-sensitive liquids, which cannot be autoclaved or sterilized by other sterilization methods.
The COVID-19 outbreak is anticipated to have a positive impact on the growth of the global laboratory filtration market. A majority of demand is for various food, healthcare, and wastewater treatment applications, which are key to the revenue streams in the laboratory filtration market.
The increase in demand for high production filtration products during the down streaming process, introduction of sophisticated filtration methods for ultra-purification, and the growing usage of analytical instruments are expected to propel the market growth. Companies, such as Macherey-Nagel, GE Healthcare, and Hahnemühle, offer ashless filter papers and qualitative filter papers, specifically designed for general laboratory filtration and quantitative routine analysis processes. In addition, the emergence of more advanced filtration technologies, such as such as microfiltration, nanofiltration, and ultrafiltration, is likely to anticipate the growth of the laboratory filtration market, as these techniques employ superior filtration equipment. Furthermore, the rapid advances in nanofiber technology as well as the rapid rise in the application of filtration technologies in biopharmaceutical and pharmaceutical and different laboratories are expected to offer significant growth opportunities for the market in the forecast period.
The uptake of analytical instruments and stringent regulations imposed by regulatory bodies regarding the standard of filtration is compelling manufacturers to adopt superior filtration techniques. Furthermore growing expenditure in cell-based research and developing economies across the globe also contribute to the substantial growth opportunities for the industry players. On the contrary, the membrane degradation or fouling results in the clogging of the membrane and over time this can be costly both in terms of purchasing replacement filters, as well as the downtime required to remove and replace used filters. In some laboratory processes, filter change must occur every few days. This is likely to act as an obstacle in the growth of the laboratory filter papers market.
The growth of the laboratory filtration market is anticipated to be driven by opportunities in untapped, emerging markets with high potential, due to increase in R & D expenditure in these regions and increase in demand for better laboratory filters. The rapid advances in nanofiber technology as well as the rapid rise in the application of filtration technologies in biopharmaceutical and pharmaceutical and different laboratories are expected to offer significant growth opportunities for the market in the forecast period. Growing expenditure in cell-based research and developing economies across the globe also contribute to the substantial growth opportunities for the industry players.
Coronavirus disease (COVID-19) was discovered in late December in the Hubei province of Wuhan city in China. The disease is caused by a virus, namely, severe acute respiratory syndrome coronavirus 2 (SARS-CoV-2), which is transmitted from humans to humans. After its discovery in Wuhan, the disease has rapidly spread to other parts of the globe. This virus causes various symptoms in a patient; for instance, common symptoms include fever, dry cough, and fatigue. However, serious symptoms include difficulty in breathing or shortness of breath, chest pain or pressure, and loss of speech or movement.
Furthermore, the virus has high potential of lethality in the geriatric population. On March 11, 2020, the World Health Organization assessed that COVID-19 can be characterized as a pandemic. In addition, no drugs are currently licensed for the treatment of COVID-19 treatment or prevention. Thus, social distancing is observed as the most important measure to stop the spread of this disease. Furthermore, to maintain social distancing, various countries across the world have adopted nationwide lockdown. Although the COVID-19 pandemic continues to impact the growth of various industries, and the immediate impact of the outbreak varies from industry to industry.
The COVID-19 outbreak is anticipated to have a positive impact on the growth of the global laboratory filtration market. Researchers are using various kinds of laboratory products including filters for carrying out various experiments enabling detection of the virus to development of a vaccine. For instance, Acrodisc sterile syringe filters by Pall laboratory ensures the sterility of media, kits and components used in research kits for COVID-19. Changes in consumer behavior with regards to health and hygiene products amid the global coronavirus outbreak is indirectly pushing adoption of membrane filtration process. A majority of demand is for various food, healthcare, and wastewater treatment applications, which are key to the revenue streams in the laboratory filtration market. An increasing number of organizations seeking solutions for health and safety standards in workplace settings is positively impacting the market growth.
Based on product, the global laboratory filtration market can be categorized into filtration media, filtration accessories and filtration assemblies. The filtration media segment dominates the laboratory filtration market, owing to increase in application of filtration in industrial biotechnology and associated research.
Based on technique, the laboratory filtration market includes nanofiltration, ultrafiltration, microfiltration, reverse osmosis and vacuum filtration. The Microfiltration segment dominates the laboratory filtration market, owing to the increasing application of microfiltration in industrial biotechnology and associated research.
Based on end user, the laboratory filtration market is segmented into pharmaceutical & biotechnology companies, hospitals & diagnostic laboratories, food and beverage industry and academic & research institutions. The pharmaceutical & biotechnology segment held the largest market share in 2020 and is expected to remain dominant during the forecast period.
North America is expected to maintain its dominance during the forecast period due to the three major countries of North America considered in the report include the U.S., Canada, and Mexico. North America is dominating the market of overall Laboratory Filtration and expected to dominate throughout the forecast period. This is majorly attributed to the presence of well-equipped laboratories for life science research, increasing investments in R&D, and the presence of government funding programs for laboratory filter membrane business owners.
Some of the major companies that operate in the global laboratory filtration market 3M Company, Agilent Technologies, Inc., Antylia Scientific, Danaher Corporation, Merck KGaA, Sartorius AG, Steris (Cantel Medical Corporation), Sterlitech Corporation, Thermo Fisher Scientific and Veolia Water Technologies.
Key Benefits For Stakeholders
Laboratory Filtration Market Report Highlights
Aspects | Details |
---|---|
By PRODUCT |
|
By TECHNIQUE |
|
By END USER |
|
By Region |
|
Key Market Players | ANTYLIA SCIENTIFIC, VEOLIA WATER TECHNOLOGIES, MERCK KGAA, STERIS PLC. (CANTEL MEDICAL CORPORATION), DANAHER CORPORATION, SARTORIUS AG, AGILENT TECHNOLOGIES INC., THE 3M COMPANY, THERMO FISHER SCIENTIFIC, INC., STERLITECH CORPORATION |
CHAPTER 1:INTRODUCTION
1.1.Report description
1.2.Key benefits for stakeholders
1.3.Key market segments
1.3.1.List of key players profile in the report
1.4.Research methodology
1.4.1.Secondary research
1.4.2.Primary research
1.4.3.Analyst tools and models
CHAPTER 2:EXECUTIVE SUMMARY
2.1.Key findings of the study
CHAPTER 3:MARKET LANDSCAPE
3.1.Market definition and scope
3.2.Porters five forces analysis
3.3.Top investment pockets
3.4.Top player positioning, 2020
3.5.Top winning strategies, 2020
3.6.Market dynamics
3.6.1.Drivers
3.6.1.1.Rise in R&D investments in the pharmaceutical & biopharmaceutical industry
3.6.1.2.Growth in demand for membrane filtration technology
3.6.1.3.Increase in purity requirements among end users
3.6.1.4.Increase in technological innovations
3.6.2.Restraint
3.6.2.1.Membrane fouling degrading filtration efficiency
3.6.3.Opportunity
3.6.3.1.Untapped market potential of emerging regions
3.6.4.Impact analysis
3.7.Analysis of COVID-19-Impact on the Market
CHAPTER 4:LABORATORY FILTRATION MARKET, BY PRODUCT
4.1.Overview
4.1.1.Market size and forecast
4.2.Filtration media
4.2.1.Key market trends, growth factors, and opportunities
4.2.2.Market size and forecast, by region
4.2.3.Market share analysis, by country
4.3.Filtration accessories
4.3.1.Key market trends, growth factors, and opportunities
4.3.2.Market size and forecast, by region
4.3.3.Market analysis, by country
4.4.Filtration assemblies
4.4.1.Key market trends, growth factors, and opportunities
4.4.2.Market size and forecast, by region
4.4.3.Market analysis, by country
CHAPTER 5:LABORATORY FILTRATION MARKET, BY TECHNIQUE
5.1.Overview
5.1.1.Market size and forecast
5.2.Nanofiltration
5.2.1.Market size and forecast, by region
5.2.2.Market share analysis, by country
5.3.Ultrafiltration
5.3.1.Market size and forecast, by region
5.3.2.Market analysis, by country
5.4.Microfiltration
5.4.1.Market size and forecast, by region
5.4.2.Market analysis, by country
5.5.Reverse osmosis
5.5.1.Market size and forecast, by region
5.5.2.Market analysis, by country
5.6.Vacuum filtration
5.6.1.Market size and forecast, by region
5.6.2.Market analysis, by country
CHAPTER 6:LABORATORY FILTRATION MARKET, BY END USER
6.1.Overview
6.1.1.Market size and forecast
6.2.Pharmaceutical & biotechnology companies
6.2.1.Market size and forecast, by region
6.2.2.Market analysis, by country
6.3.Hospitals & diagnostic laboratories
6.3.1.Market size and forecast, by region
6.3.2.Market analysis, by country
6.4.Foods & beverages Industry
6.4.1.Market size and forecast, by region
6.4.2.Market analysis, by country
6.5.Academic & research Institutions
6.5.1.Market size and forecast, by region
6.5.2.Market analysis, by country
CHAPTER 7:LABORATORY FILTRATION MARKET, BY REGION
7.1.Overview
7.1.1.Market size and forecast
7.2.North America
7.2.1.Key market trends, growth factors, and opportunities
7.2.2.North America market size and forecast, by Product
7.2.3.North America market size and forecast, by Technique
7.2.4.North America market size and forecast, by end user
7.2.5.Market size and forecast, by country
7.2.5.1.U.S.
7.2.5.1.1.U.S. Laboratory filtration market, by product
7.2.5.1.2.U.S. Laboratory filtration market, by technique
7.2.5.1.3.U.S. Laboratory filtration market, by end user
7.2.5.2.Canada
7.2.5.2.1.Canada Laboratory filtration market, by Product
7.2.5.2.2.Canada Laboratory filtration market, by Technique
7.2.5.2.3.Canada Laboratory filtration market, by end user
7.2.5.3.Mexico
7.2.5.3.1.Mexico Laboratory filtration market, by Product
7.2.5.3.2.Mexico Laboratory filtration market, by Technique
7.2.5.3.3.Mexico Laboratory filtration market, by end user
7.3.Europe
7.3.1.Key market trends, growth factors, and opportunities
7.3.2.Europe market size and forecast, by Product
7.3.3.Europe market size and forecast, by Technique
7.3.4.Europe market size and forecast, by end user
7.3.5.Market size and forecast, by country
7.3.5.1.Germany
7.3.5.1.1.Germany Laboratory filtration market, by Product
7.3.5.1.2.Germany Laboratory filtration market, by Technique
7.3.5.1.3.Germany Laboratory filtration market, by end user
7.3.5.2.UK
7.3.5.2.1.UK Laboratory filtration market, by Product
7.3.5.2.2.UK Laboratory filtration market, by Technique
7.3.5.2.3.UK Laboratory filtration market, by end user
7.3.5.3.France
7.3.5.3.1.France Laboratory filtration market, by Product
7.3.5.3.2.France Laboratory filtration market, by Technique
7.3.5.3.3.France Laboratory filtration market, by end user
7.3.5.4.Italy
7.3.5.4.1.Italy Laboratory filtration market, by Product
7.3.5.4.2.Italy Laboratory filtration market, by Technique
7.3.5.4.3.Italy Laboratory filtration market, by end user
7.3.5.5.Spain
7.3.5.5.1.Spain Laboratory filtration market, by Product
7.3.5.5.2.Spain Laboratory filtration market, by Technique
7.3.5.5.3.Spain Laboratory filtration market, by end user
7.3.5.6.Rest of Europe
7.3.5.6.1.Rest of Europe Laboratory filtration market, by Product
7.3.5.6.2.Rest of Europe Laboratory filtration market, by Technique
7.3.5.6.3.Rest of Europe Laboratory filtration market, by end user
7.4.Asia-Pacific
7.4.1.Key market trends, growth factors, and opportunities
7.4.2.Asia-Pacific market size and forecast, by Product
7.4.3.Asia-Pacific market size and forecast, by Technique
7.4.4.Asia-Pacific market size and forecast, by end user
7.4.5.Market size and forecast, by country
7.4.5.1.Japan
7.4.5.1.1.Japan Laboratory filtration market, by Product
7.4.5.1.2.Japan Laboratory filtration market, by Technique
7.4.5.1.3.Japan Laboratory filtration market, by end user
7.4.5.2.China
7.4.5.2.1.China Laboratory filtration market, by Product
7.4.5.2.2.China Laboratory filtration market, by Technique
7.4.5.2.3.China Laboratory filtration market, by end user
7.4.5.3.Australia
7.4.5.3.1.Australia Laboratory filtration market, by Product
7.4.5.3.2.Australia Laboratory filtration market, by Technique
7.4.5.3.3.Australia Laboratory filtration market, by end user
7.4.5.4.India
7.4.5.4.1.India Laboratory filtration market, by Product
7.4.5.4.2.India Laboratory filtration market, by Technique
7.4.5.4.3.India Laboratory filtration market, by end user
7.4.5.5.Rest of Asia-Pacific
7.4.5.5.1.Rest of Asia-Pacific Laboratory filtration market, by Product
7.4.5.5.2.Rest of Asia-Pacific Laboratory filtration market, by Technique
7.4.5.5.3.Rest of Asia-Pacific Laboratory filtration market, by end user
7.5.LAMEA
7.5.1.Key market trends, growth factors, and opportunities
7.5.2.LAMEA market size and forecast, by Product
7.5.3.LAMEA market size and forecast, by Technique
7.5.4.LAMEA market size and forecast, by end user
7.5.5.Market size and forecast, by country
7.5.5.1.Brazil
7.5.5.1.1.Brazil Laboratory filtration market, by Product
7.5.5.1.2.Brazil Laboratory filtration market, by Technique
7.5.5.1.3.Brazil Laboratory filtration market, by end user
7.5.5.2.Saudi Arabia
7.5.5.2.1.Saudi Arabia Laboratory filtration market, by Product
7.5.5.2.2.Saudi Arabia Laboratory filtration market, by Technique
7.5.5.2.3.Saudi Arabia Laboratory filtration market, by end user
7.5.5.3.South Africa
7.5.5.3.1.South Africa Laboratory filtration market, by Product
7.5.5.3.2.South Africa Laboratory filtration market, by Technique
7.5.5.3.3.South Africa Laboratory filtration market, by end user
7.5.5.4.Rest of LAMEA
7.5.5.4.1.Rest of LAMEA Laboratory filtration market, by Product
7.5.5.4.2.Rest of LAMEA Laboratory filtration market, by Technique
7.5.5.4.3.Rest of LAMEA Laboratory filtration market, by end user
CHAPTER 8:COMPANY PROFILES
8.1.AGILENT TECHNOLOGIES INC.
8.1.1.Company overview
8.1.2.Operating business segments
8.1.3.Product portfolio
8.1.4.Business performance
8.2.THE 3M COMPANY
8.2.1.Company overview
8.2.2.Operating business segments
8.2.3.Product portfolio
8.2.4.Business performance
8.3.DANAHER CORPORATION
8.3.1.Company overview
8.3.2.Company snapshot
8.3.3.Operating business segments
8.3.4.Product portfolio
8.3.5.Business performance
8.3.6.Key strategic moves and developments
8.4.STERLITECH CORPORATION
8.4.1.Company overview
8.4.2.Operating business segments
8.4.3.Product portfolio
8.4.4.Key strategic moves and developments
8.5.MERCK KGAA
8.5.1.Company overview
8.5.2.Operating business segments
8.5.3.Product portfolio
8.5.4.Business performance
8.5.5.Key strategic moves and developments
8.6.SARTORIUS AG
8.6.1.Company overview
8.6.2.Company snapshot
8.6.3.Operating business segments
8.6.4.Product portfolio
8.6.5.Business performance
8.6.6.Key strategic moves and developments
8.7.ANTYLIA SCIENTIFIC
8.7.1.Company overview
8.7.2.Operating business segments
8.7.3.Product portfolio
8.8.STERIS PLC. (CANTEL MEDICAL CORPORATION)
8.8.1.Company overview
8.8.2.Operating business segments
8.8.3.Product portfolio
8.8.4.Business performance
8.8.5.Key strategic moves and developments
8.9.THERMO FISHER SCIENTIFIC, INC.
8.9.1.Company overview
8.9.2.Operating business segments
8.9.3.Product portfolio
8.9.4.Business performance
8.10.VEOLIA WATER TECHNOLOGIES
8.10.1.Company overview
8.10.2.Operating business segments
8.10.3.Product portfolio
8.10.4.Business performance
LIST OF TABLES
TABLE 01.LABORATORY FILTRATION MARKET, BY PRODUCT, 2020-2030 ($MILLION)
TABLE 02.LABORATORY FILTRATION MARKET FOR FILTRATION MEDIA, BY REGION, 2020-2030 ($MILLION)
TABLE 03.LABORATORY FILTRATION MARKET FOR IN VITRO DIAGNOSTIC TEST, BY REGION, 2020-2030 ($MILLION)
TABLE 04.LABORATORY FILTRATION MARKET FOR FILTRATION ASSEMBLIES, BY REGION, 2020-2030 ($MILLION)
TABLE 05.LABORATORY FILTRATION MARKET, BY TECHNIQUE, 2020-2030 ($MILLION)
TABLE 06.LABORATORY FILTRATION MARKET FOR NANOFILTRATION, BY REGION, 2020-2030 ($MILLION)
TABLE 07.LABORATORY FILTRATION MARKET FOR ULTRAFILTRATION, BY REGION, 2020-2030 ($MILLION)
TABLE 08.LABORATORY FILTRATION MARKET FOR MICROFILTRATION, BY REGION, 2020-2030 ($MILLION)
TABLE 09.LABORATORY FILTRATION MARKET FOR REVERSE OSMOSIS, BY REGION, 2020-2030 ($MILLION)
TABLE 10.LABORATORY FILTRATION MARKET FOR VACUUM FILTRATION, BY REGION, 2020-2030 ($MILLION)
TABLE 11.LABORATORY FILTRATION MARKET, BY END USER, 2020-2030 ($MILLION)
TABLE 12.LABORATORY FILTRATION MARKET FOR PHARMACEUTICAL & BIOTECHNOLOGY COMPANIES, BY REGION, 2020-2030 ($MILLION)
TABLE 13.LABORATORY FILTRATION MARKET FOR HOSPITALS & DIAGNOSTIC LABORATORIES, BY REGION, 2020-2030 ($MILLION)
TABLE 14.LABORATORY FILTRATION MARKET FOR FOODS & BEVERAGES INDUSTRY, BY REGION, 2020-2030 ($MILLION)
TABLE 15.LABORATORY FILTRATION MARKET FOR ACADEMIC & RESEARCH INSTITUTIONS, BY REGION, 2020-2030 ($MILLION)
TABLE 16.LABORATORY FILTRATION MARKET, BY REGION, 2020–2030 ($MILLION)
TABLE 17.NORTH AMERICA LABORATORY FILTRATION MARKET, BY PRODUCT, 2020–2030 ($MILLION)
TABLE 18.NORTH AMERICA LABORATORY FILTRATION MARKET, BY TECHNIQUE, 2020–2030 ($MILLION)
TABLE 19.NORTH AMERICA LABORATORY FILTRATION MARKET, BY END USER, 2020–2030 ($MILLION)
TABLE 20.NORTH AMERICA LABORATORY FILTRATION MARKET, BY COUNTRY, 2020–2030 ($MILLION)
TABLE 21.U.S. LABORATORY FILTRATION MARKET, BY PRODUCT, 2020–2030 ($MILLION)
TABLE 22.U.S. LABORATORY FILTRATION MARKET, BY TECHNIQUE, 2020–2030 ($MILLION)
TABLE 23.U.S. LABORATORY FILTRATION MARKET, BY END USER, 2020–2030 ($MILLION)
TABLE 24.CANADA LABORATORY FILTRATION MARKET, BY PRODUCT, 2020–2030 ($MILLION)
TABLE 25.CANADA LABORATORY FILTRATION MARKET, BY TECHNIQUE, 2020–2030 ($MILLION)
TABLE 26.CANADA LABORATORY FILTRATION MARKET, BY END USER, 2020–2030 ($MILLION)
TABLE 27.MEXICO LABORATORY FILTRATION MARKET, BY PRODUCT, 2020–2030 ($MILLION)
TABLE 28.MEXICO LABORATORY FILTRATION MARKET, BY TECHNIQUE, 2020–2030 ($MILLION)
TABLE 29.MEXICO LABORATORY FILTRATION MARKET, BY END USER, 2020–2030 ($MILLION)
TABLE 30.EUROPE LABORATORY FILTRATION MARKET, BY PRODUCT, 2020–2030 ($MILLION)
TABLE 31.EUROPE LABORATORY FILTRATION MARKET, BY TECHNIQUE, 2020–2030 ($MILLION)
TABLE 32.EUROPE LABORATORY FILTRATION MARKET, BY END USER, 2020–2030 ($MILLION)
TABLE 33.EUROPE LABORATORY FILTRATION MARKET, BY COUNTRY, 2020–2030 ($MILLION)
TABLE 34.GERMANY LABORATORY FILTRATION MARKET, BY PRODUCT, 2020–2030 ($MILLION)
TABLE 35.GERMANY LABORATORY FILTRATION MARKET, BY TECHNIQUE, 2020–2030 ($MILLION)
TABLE 36.GERMANY LABORATORY FILTRATION MARKET, BY END USER, 2020–2030 ($MILLION)
TABLE 37.UK LABORATORY FILTRATION MARKET, BY PRODUCT, 2020–2030 ($MILLION)
TABLE 38.UK LABORATORY FILTRATION MARKET, BY TECHNIQUE, 2020–2030 ($MILLION)
TABLE 39.UK LABORATORY FILTRATION MARKET, BY END USER, 2020–2030 ($MILLION)
TABLE 40.FRANCE LABORATORY FILTRATION MARKET, BY PRODUCT, 2020–2030 ($MILLION)
TABLE 41.FRANCE LABORATORY FILTRATION MARKET, BY TECHNIQUE, 2020–2030 ($MILLION)
TABLE 42.FRANCE LABORATORY FILTRATION MARKET, BY END USER, 2020–2030 ($MILLION)
TABLE 43.ITALY LABORATORY FILTRATION MARKET, BY PRODUCT, 2020–2030 ($MILLION)
TABLE 44.ITALY LABORATORY FILTRATION MARKET, BY TECHNIQUE, 2020–2030 ($MILLION)
TABLE 45.ITALY LABORATORY FILTRATION MARKET, BY END USER, 2020–2030 ($MILLION)
TABLE 46.SPAIN LABORATORY FILTRATION MARKET, BY PRODUCT, 2020–2030 ($MILLION)
TABLE 47.SPAIN LABORATORY FILTRATION MARKET, BY TECHNIQUE, 2020–2030 ($MILLION)
TABLE 48.SPAIN LABORATORY FILTRATION MARKET, BY END USER, 2020–2030 ($MILLION)
TABLE 49.REST OF EUROPE LABORATORY FILTRATION MARKET, BY PRODUCT, 2020–2030 ($MILLION)
TABLE 50.REST OF EUROPE LABORATORY FILTRATION MARKET, BY TECHNIQUE, 2020–2030 ($MILLION)
TABLE 51.REST OF EUROPE LABORATORY FILTRATION MARKET, BY END USER, 2020–2030 ($MILLION)
TABLE 52.ASIA-PACIFIC LABORATORY FILTRATION MARKET, BY PRODUCT, 2020–2030 ($MILLION)
TABLE 53.ASIA-PACIFIC LABORATORY FILTRATION MARKET, BY TECHNIQUE, 2020–2030 ($MILLION)
TABLE 54.ASIA-PACIFIC LABORATORY FILTRATION MARKET, BY END USER, 2020–2030 ($MILLION)
TABLE 55.ASIA-PACIFIC LABORATORY FILTRATION MARKET, BY COUNTRY, 2020–2030 ($MILLION)
TABLE 56.JAPAN LABORATORY FILTRATION MARKET, BY PRODUCT, 2020–2030 ($MILLION)
TABLE 57.JAPAN LABORATORY FILTRATION MARKET, BY TECHNIQUE, 2020–2030 ($MILLION)
TABLE 58.JAPAN LABORATORY FILTRATION MARKET, BY END USER, 2020–2030 ($MILLION)
TABLE 59.CHINA LABORATORY FILTRATION MARKET, BY PRODUCT, 2020–2030 ($MILLION)
TABLE 60.CHINA LABORATORY FILTRATION MARKET, BY TECHNIQUE, 2020–2030 ($MILLION)
TABLE 61.CHINA LABORATORY FILTRATION MARKET, BY END USER, 2020–2030 ($MILLION)
TABLE 62.AUSTRALIA LABORATORY FILTRATION MARKET, BY PRODUCT, 2020–2030 ($MILLION)
TABLE 63.AUSTRALIA LABORATORY FILTRATION MARKET, BY TECHNIQUE, 2020–2030 ($MILLION)
TABLE 64.AUSTRALIA LABORATORY FILTRATION MARKET, BY END USER, 2020–2030 ($MILLION)
TABLE 65.INDIA LABORATORY FILTRATION MARKET, BY PRODUCT, 2020–2030 ($MILLION)
TABLE 66.INDIA LABORATORY FILTRATION MARKET, BY TECHNIQUE, 2020–2030 ($MILLION)
TABLE 67.INDIA LABORATORY FILTRATION MARKET, BY END USER, 2020–2030 ($MILLION)
TABLE 68.REST OF ASIA-PACIFIC LABORATORY FILTRATION MARKET, BY PRODUCT, 2020–2030 ($MILLION)
TABLE 69.REST OF ASIA-PACIFIC LABORATORY FILTRATION MARKET, BY TECHNIQUE, 2020–2030 ($MILLION)
TABLE 70.REST OF ASIA-PACIFIC LABORATORY FILTRATION MARKET, BY END USER, 2020–2030 ($MILLION)
TABLE 71.LAMEA LABORATORY FILTRATION MARKET, BY PRODUCT, 2020–2030 ($MILLION)
TABLE 72.LAMEA LABORATORY FILTRATION MARKET, BY TECHNIQUE, 2020–2030 ($MILLION)
TABLE 73.LAMEA LABORATORY FILTRATION MARKET, BY END USER, 2020–2030 ($MILLION)
TABLE 74.LAMEA LABORATORY FILTRATION MARKET, BY COUNTRY, 2020–2030 ($MILLION)
TABLE 75.BRAZIL LABORATORY FILTRATION MARKET, BY PRODUCT, 2020–2030 ($MILLION)
TABLE 76.BRAZIL LABORATORY FILTRATION MARKET, BY TECHNIQUE, 2020–2030 ($MILLION)
TABLE 77.BRAZIL LABORATORY FILTRATION MARKET, BY END USER, 2020–2030 ($MILLION)
TABLE 78.SAUDI ARABIA LABORATORY FILTRATION MARKET, BY PRODUCT, 2020–2030 ($MILLION)
TABLE 79.SAUDI ARABIA LABORATORY FILTRATION MARKET, BY TECHNIQUE, 2020–2030 ($MILLION)
TABLE 80.SAUDI ARABIA LABORATORY FILTRATION MARKET, BY END USER, 2020–2030 ($MILLION)
TABLE 81.SOUTH AFRICA LABORATORY FILTRATION MARKET, BY PRODUCT, 2020–2030 ($MILLION)
TABLE 82.SOUTH AFRICA LABORATORY FILTRATION MARKET, BY TECHNIQUE, 2020–2030 ($MILLION)
TABLE 83.SOUTH AFRICA LABORATORY FILTRATION MARKET, BY END USER, 2020–2030 ($MILLION)
TABLE 84.REST OF LAMEA LABORATORY FILTRATION MARKET, BY PRODUCT, 2020–2030 ($MILLION)
TABLE 85.REST OF LAMEA LABORATORY FILTRATION MARKET, BY TECHNIQUE, 2020–2030 ($MILLION)
TABLE 86.REST OF LAMEA LABORATORY FILTRATION MARKET, BY END USER, 2020–2030 ($MILLION)
TABLE 87.AGILENT: COMPANY SNAPSHOT
TABLE 88.AGILENT: OPERATING SEGMENTS
TABLE 89.AGILENT: PRODUCT PORTFOLIO
TABLE 90.3M: COMPANY SNAPSHOT
TABLE 91.3M: OPERATING SEGMENTS
TABLE 92.3M: PRODUCT PORTFOLIO
TABLE 93.DANAHER: SNAPSHOT
TABLE 94.DANAHER: OPERATING SEGMENTS
TABLE 95.DANAHER: PRODUCT PORTFOLIO
TABLE 96.DANAHER: KEY DEVELOPMENTS
TABLE 97.STERLITECH: COMPANY SNAPSHOT
TABLE 98.DANAHER: OPERATING SEGMENTS
TABLE 99.HITACHI: PRODUCT PORTFOLIO
TABLE 100.SHIMADZU: KEY DEVELOPMENTS
TABLE 101.MERCK: COMPANY SNAPSHOT
TABLE 102.MERCK: OPERATING SEGMENTS
TABLE 103.MERCK: PRODUCT PORTFOLIO
TABLE 104.MERCK: KEY DEVELOPMENTS
TABLE 105.SARTORIUS: COMPANY SNAPSHOT
TABLE 106.SARTORIUS: PRODUCT SEGMENTS
TABLE 107.SARTORIUS: PRODUCT PORTFOLIO
TABLE 108.SARTORIUS: KEY DEVELOPMENTS
TABLE 109.ANTYLIA: COMPANY SNAPSHOT
TABLE 110.ANTYLIA: OPERATING SEGMENTS
TABLE 111.MERCK: PRODUCT PORTFOLIO
TABLE 112.STERIS: COMPANY SNAPSHOT
TABLE 113.STERIS: OPERATING SEGMENTS
TABLE 114.STERIS: PRODUCT PORTFOLIO
TABLE 115.STERIS: KEY DEVELOPMENTS
TABLE 116.THERMO FISCHER: COMPANY SNAPSHOT
TABLE 117.THERMO FISCHER: OPERATING SEGMENTS
TABLE 118.THERMO FISCHER: PRODUCT PORTFOLIO
TABLE 119.VEOLIA: COMPANY SNAPSHOT
TABLE 120.VEOLIA: OPERATING SEGMENTS
TABLE 121.VEOLIA: PRODUCT PORTFOLIO
LIST OF FIGURES
FIGURE 01.LABORATORY FILTRATION MARKET SEGMENTATION
FIGURE 02.MODERATE BARGAINING POWER OF BUYERS
FIGURE 03.MODERATE BARGAINING POWER OF SUPPLIERS
FIGURE 04.MODERATE THREAT OF SUBSTITUTION
FIGURE 05.MODERATE THREAT OF NEW ENTRANTS
FIGURE 06.MODERATE COMPETITVE RIVARLY
FIGURE 07.TOP INVESTMENT POCKETS, 2020
FIGURE 08.TOP PLAYER POSITIONING, 2020
FIGURE 09.TOP WINNING STRATEGIES, BY DEVELOPMENTS, 2018–2021
FIGURE 10.TOP WINNING STRATEGIES, BY YEAR, 2018–2021
FIGURE 11.TOP WINNING STRATEGIES: COMPANY , 2018–2021
FIGURE 12.IMPACT ANALYSIS
FIGURE 13.COMPARATIVE ANALYSIS OF LABORATORY FILTRATION MARKET FOR FILTRATION MEDIA, BY COUNTRY, 2020 & 2030 ($MILLION)
FIGURE 14.COMPARATIVE ANALYSIS OF LABORATORY FILTRATION MARKET FOR FILTRATION ACCESSORIES, BY COUNTRY, 2020 & 2030 ($MILLION)
FIGURE 15.COMPARATIVE ANALYSIS OF LABORATORY FILTRATION MARKET FOR FILTRATION ASSEMBLIES, BY COUNTRY, 2020 & 2030 ($MILLION)
FIGURE 16.COMPARATIVE ANALYSIS OF LABORATORY FILTRATION MARKET FOR NANOFILTRATION, BY COUNTRY, 2020 & 2030 ($MILLION)
FIGURE 17.COMPARATIVE ANALYSIS OF LABORATORY FILTRATION MARKET FOR ULTRAFILTRATION, BY COUNTRY, 2020 & 2030 ($MILLION)
FIGURE 18.COMPARATIVE ANALYSIS OF LABORATORY FILTRATION MARKET FOR MICROFILTRATION, BY COUNTRY, 2020 & 2030 ($MILLION)
FIGURE 19.COMPARATIVE ANALYSIS OF LABORATORY FILTRATION MARKET FOR REVERSE OSMOSIS, BY COUNTRY, 2020 & 2030 ($MILLION)
FIGURE 20.COMPARATIVE ANALYSIS OF LABORATORY FILTRATION MARKET FOR VACUUM FILTRATION, BY COUNTRY, 2020 & 2030 ($MILLION)
FIGURE 21.COMPARATIVE ANALYSIS OF LABORATORY FILTRATION MARKET FOR PHARMACEUTICAL & BIOTECHNOLOGY COMPANIES, BY COUNTRY, 2020 & 2030 ($MILLION)
FIGURE 22.COMPARATIVE ANALYSIS OF LABORATORY FILTRATION MARKET FOR HOSPITALS & DIAGNOSTIC LABORATORIES, BY COUNTRY, 2020 & 2030 ($MILLION)
FIGURE 23.COMPARATIVE ANALYSIS OF LABORATORY FILTRATION MARKET FOR FOODS & BEVERAGES INDUSTRY , BY COUNTRY, 2020 & 2030 ($MILLION)
FIGURE 24.COMPARATIVE ANALYSIS OF LABORATORY FILTRATION MARKET FOR ACADEMIC & RESEARCH INSTITUTIONS, BY COUNTRY, 2020 & 2030 ($MILLION)
FIGURE 25.AGILENT: NET SALES, 2018–2020 ($MILLION)
FIGURE 26.AGILENT: REVENUE SHARE BY SEGMENT, 2020 (%)
FIGURE 27.AGILENT: REVENUE SHARE BY REGION, 2020 (%)
FIGURE 28.3M: NET SALES, 2018–2020 ($MILLION)
FIGURE 29.3M: REVENUE SHARE BY SEGMENT, 2020 (%)
FIGURE 30.3M: REVENUE SHARE BY REGION, 2020 (%)
FIGURE 31.DANAHER: NET SALES, 2018–2020 ($MILLION)
FIGURE 32.DANAHER: REVENUE SHARE BY SEGMENT, 2020 (%)
FIGURE 33.DANAHER: REVENUE SHARE BY REGION, 2020 (%)
FIGURE 34.MERCK: NET SALES, 2018–2020 ($MILLION)
FIGURE 35.MERCK: REVENUE SHARE BY SEGMENT, 2020 (%)
FIGURE 36.MERCK: REVENUE SHARE BY REGION, 2020 (%)
FIGURE 37.SARTORIUS: NET SALES, 2018–2020 ($MILLION)
FIGURE 38.SARTORIUS: REVENUE SHARE BY SEGMENT, 2020 (%)
FIGURE 39.SARTORIUS: REVENUE SHARE BY REGION, 2020 (%)
FIGURE 40.STERIS: NET SALES, 2018–2020 ($MILLION)
FIGURE 41.STERIS: REVENUE SHARE BY SEGMENT, 2020 (%)
FIGURE 42.STERIS: REVENUE SHARE BY REGION, 2020 (%)
FIGURE 43.THERMO FISCHER: NET SALES, 2018–2020 ($MILLION)
FIGURE 44.THERMO FISCHER: REVENUE SHARE BY SEGMENT, 2020 (%)
FIGURE 45.THERMO FISCHER: REVENUE SHARE BY REGION, 2020 (%)
FIGURE 46.VEOLIA: NET SALES, 2018–2020 ($MILLION)
FIGURE 47.VEOLIA: REVENUE SHARE BY SEGMENT, 2020 (%)
FIGURE 48.VEOLIA: REVENUE SHARE BY REGION, 2020 (%)
This section provides the opinions of the top level CXOs in the cardiovascular diagnostic testing market. According to the insights of CXOs, increase in prevalence of cardiovascular diseases, rise in diagnostic tests, and development of new technologies for the prognosis of cardiac events, attributed for the growth of the cardiovascular diagnostic testing market.
The CXOs further added that rise in prevalence of unhealthy lifestyle, poor eating habits, and exposure to air high in pollutants, such as the ones that come out of the automobile exhaust pipe, is a severe heart health hazard and is responsible for increasing rates of cardiovascular events as a result, medical practitioners, clinicians and researchers have recognized the significance of early or timely diagnosis of cardiovascular diseases using routine diagnostic tests such as serum based tests as well as tests carried out with the aid of machines such as electrocardiogram test. The results of these tests can help them diagnose heart disease and develop a treatment plan accordingly. For instance, lipid profile tests such as C-reactive protein can show the risk of heart diseases results of which can be used as a preventive measure for any future cardiac events.
North America is expected to witness highest growth, in terms of revenue, owing to rise in prevalence of cardiovascular diseases, presence of key players, and advancements in healthcare investments. Asia-Pacific was the second largest contributor to the market in 2020, and is expected to register the fastest CAGR during the forecast period. However, high cost of the implementation and stringent government policies may restrain the market growth during the forecast period.
A. The total market value of Laboratory Filtration Market is $3,061.30 million in 2020
A. The forecast period in the report is from 2021 to 2030
A. The market value of Laboratory Filtration Market in 2030 is $6,807.40 Million
A. The base year for the report is 2020
A. Yes, Laboratory Filtration companies are profiled in the report
A. The top companies that hold the market share in Laboratory Filtration Market are 3M Company, Agilent Technologies Inc., Antylia Scientific, Danaher Corporation, Merck Millipore, Sartorius AG, Steris (Cantel Medical Corporation), Sterlitech Corporation, Thermo Fisher Scientific, Veolia Water Technologies
A. No, there is no value chain analysis provided in the Laboratory Filtration Market report
A. The key trends in the Laboratory Filtration Market are empowers manufacturers in the medical sector to produce customized filtration products.
Start reading instantly.
This Report and over 66,905+ more Reports, Available with Avenue Library. T&C*.
Enterprise
License/PDF
Library
Membership
*Taxes/Fees, if applicable will be added during checkout. All prices in USD
To ensure high-level data integrity, accurate analysis, and impeccable forecasts
For complete satisfaction
On-demand customization of scope of the report to exactly meet your needs
Targeted market view to provide pertinent information and save time of readers
Get insights on topics that are crucial for your business. Stay abreast of your interest areas.
Get Industry Data AlertsTo ensure high-level data integrity, accurate analysis, and impeccable forecasts
For complete satisfaction
On-demand customization of scope of the report to exactly meet your needs
Targeted market view to provide pertinent information and save time of readers