0
2022
Last Mile Delivery Market

Last Mile Delivery Market

by Service Type (Business-To-Business (B2B), Business-To-Consumer (B2C), Customer-To-Customer (C2C)), by Vehicle Type (Motorcycle, LCV, HCV, Drones), by Mode of Operation (Non-Autonomous, Autonomous), by Delivery Mode (Regular Delivery, Same-Day Delivery or Express Delivery), by Application (E Commerce, Retail and FMCG, Healthcare, Mails and Packages, Others), by Destination (Domestic, International): Global Opportunity Analysis and Industry Forecast, 2021-2031

Report Code: A04801
Jun 2022 | Pages: 336
Tables: 317
Charts: 87
  • Formats*:

  • pdf

    Single User License, Five User
    License & Enterprise User License

  • xls

    Data Pack Excel License

  • ppt

    It comes with the additional cost
    of $2500.00 contact sales.

 
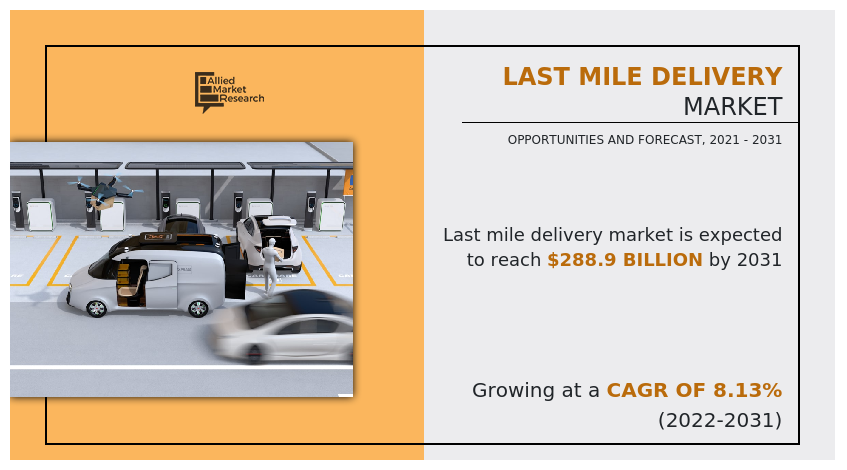
The global last mile delivery market was valued at $131.5 billion in 2021, and is projected to reach $288.9 billion by 2031, growing at a CAGR of 8.13% from 2022 to 2031.

Last mile delivery, also known as last mile logistics, is the last leg of a journey comprising movement of goods from a transportation hub or warehouse to the final delivery destination. Last mile delivery aims to deliver items to customers as quickly as possible while minimizing company costs. Last mile delivery accounts for more than 50% of the total shipping cost. It is mostly used in food, e-commerce, retail, or pharmaceutical industries. Present, increased use of internet along with the expansion of the e-commerce industry fuel the adoption of online shopping, which in turn requires better and efficient means to deliver the product to the customer. Thus, various product delivery services have been adopted by companies such as use of drones and ground delivery vehicles.

COVID-19 has created a short-term disruption and long-term structural changes due to which the e-commerce sector is experiencing a sluggish growth in new online categories such as groceries and home care. Due to COVID-19 pandemic, the overall sales of e-commerce business in the U.S. have increased by over 30%. As per the industry experts, with the increased urbanization, approximately 60% people will be living in cities in the near future and among those, 2.1 billion customers are expected to buy goods online by the year 2021. Also, in March 2021, the AIN pharmacy in town began autonomous delivery of medication to patients' homes. In 2020, Starship Technologies started delivering food during the pandemic. Factors such as rise in demand for contactless delivery from customers, growth of the e-commerce sector during pandemics, and partnership and collaboration between various companies and autonomous vehicle and ground delivery bots manufacturers, are expected to boost the market growth during pandemic.

Last Mile Delivery Market, Last Mile Delivery Industry

In addition, last mile delivery has gained more popularity during the COVID-19 pandemic, owing to growth in demand for contactless and home-based delivery service. For instance, in March 2020, Matternet, developer of world's leading urban drone logistics platform, unveiled its new Matternet Station to support peer-to-peer drone logistics networks for urban environments. Autonomous M2 drone and Cloud Platform provide an intuitive user interface for sending & receiving medical payloads and a safe & secure drone portal for hospital campuses.
Last Mile Delivery Market

Furthermore, innovations & investments by top market players boost growth of the last mile delivery industry. For instance, Amazon launched its delivery robot called Scout, which is of the size of a small cooler and can roll along sidewalks and deliver packages at the doorstep of customers. This has encouraged Amazon to introduce a new concept in the field of autonomous last mile delivery service. The automotive last mile delivery market forecast is expected to witness various developments carried out by top companies, which leads to growth of the market.
Factors such as development of e-commerce industry and increase in trading activities, owing to globalization, technological advancements in delivery vehicles, and increase in demand for fast delivery of packages drive the last mile delivery market growth. However, poor infrastructure & higher logistics costs, lack of control of manufacturers and retailers on logistics services, and imprecise postal address system are expected to hamper the growth of the market.

Last Mile Delivery Market

Further, adoption autonomous delivery to reinforce demand, cost cutting, and lead time reduction, owing to adoption of multi-modal system and growth in e-commerce industry, coupled with rise in B2C deliveries are expected to create numerous opportunities for growth and expansion of the last mile delivery market.

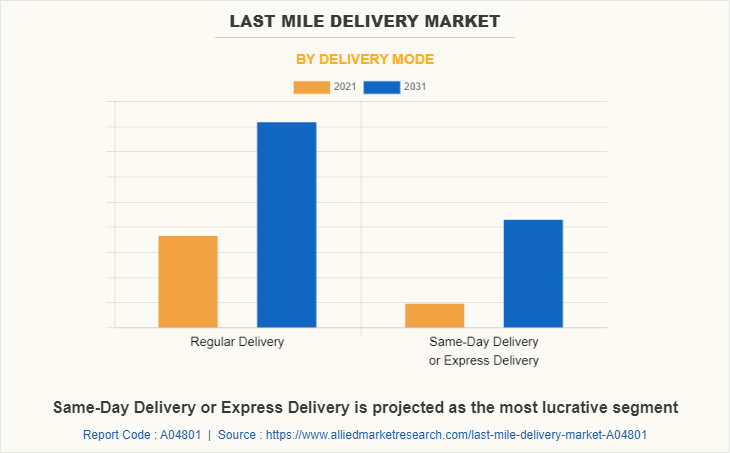
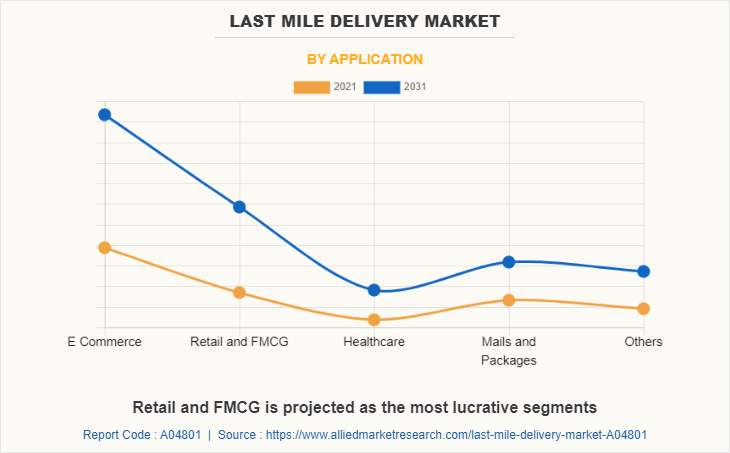
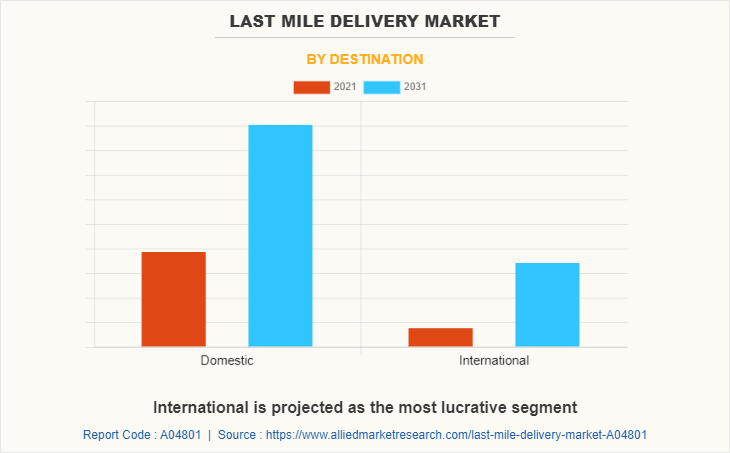
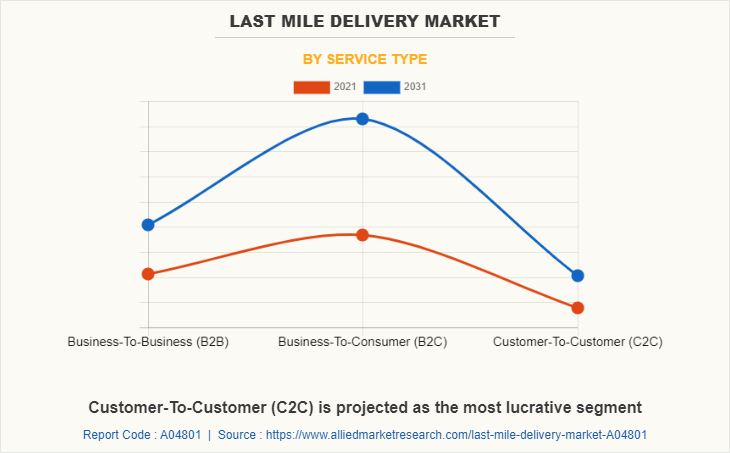
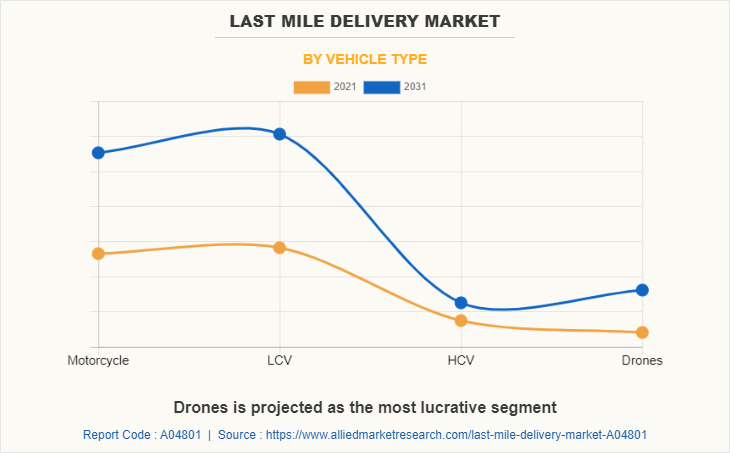
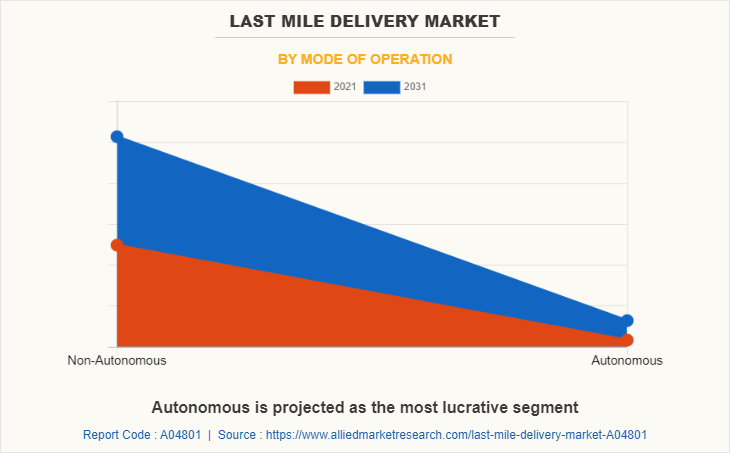
The last mile delivery market is segmented into delivery mode, application, destination, service type, vehicle type, mode of operation and region. By service, the market is categorized into business-to-business (B2B), business-to-consumer (B2C), and customer-to-customer (C2C). By vehicle type, it is fragmented into motorcycles, light commercial vehicles (LCV), heavy commercial vehicles (HCV), and drones. Depending on the mode of operation, it is classified into non-autonomous and autonomous. By delivery mode, it is fragmented into regular delivery and same-day delivery or express delivery. By application, it classified into e-commerce, retail & FMCG, healthcare, mails & packages, and others. By region, the market has been studied across North America, Europe, Asia-Pacific and LAMEA.
Last Mile Delivery Market

Global key players profiled in the last mile delivery market report include A1 Express Services Inc., Amazon.com, Aramex, BEST Inc., DB Schenker, Deutsche Post AG (DHL GROUP), DPD, Drone Delivery Canada, Dropoff, Inc., DSV (DSV PANALPINA), FedEx, Flirtey, Flytrex, Geodis, Jet Delivery, Inc., Kerry Logistics Network Limited, Marble Robot, Matternet, Power Link Expedite, Savioke, SF Express, United Parcel Service, Inc. (UPS), USA Couriers, XPO Logistics, Inc. and YTO Express Group Co. The key innovators operating in the industry includes companies such as Care to Beauty, Desertcart, Fetchr, JAZP and Jeebly LLC.
Last Mile Delivery Market

Development of the e-commerce industry

Demand for better and efficient delivery services for products has increased with the advent in online shopping along with inclination of customers toward buying products through an online source. Over past few years, the e-commerce industry has witnessed astonishing growth in various regions around the world. Factors such as access to multiple products, availability of a wide range of options for a single product, expected delivery time, and a variety of shipping options including tracking options and easy returns drive growth of the e-commerce industry. For instance, in January 2022, DPD Group collaborated with Asendia USA to provide quick and cost-effective e-commerce package delivery services to Europe from the U.S., enabling exceptional growth potential in the region. In addition, online grocery stores and retailers, such as Big Basket, Flipkart, and Amazon, are developing delivery robots to perform last-mile delivery of goods. For instance, both Amazon and FedEx are developing delivery robots, where FedEx’s bot Roxo, which looks like a small refrigerator, has completed on-road tests in four cities.
Last Mile Delivery Market

Increase in trading activities

Dynamic market conditions and global economy movement are the key factors driving globalization. Various activities related to trade have been witnessed to increase, owing to rise in globalization from last several years. In addition, development of the overseas market is a significant factor that fuels growth of the industry. Trade activities within cities & nearby countries are anticipated to support growth of the last mile delivery market in the coming years.

Manufacturers or retailers find it difficult to keep a track of transportation activities in an effective manner; hence, freight transportation companies support these manufacturers to keep a track and control transportation and supply chain activities, including warehousing, distribution, and fulfillment services. Growth in trade activities and increase in concern toward seamless transportation activities, owing to globalization are expected to drive growth of the last mile delivery market across the globe.   
Last Mile Delivery Market

Poor infrastructure and higher logistics costs

Logistics needs good infrastructure, supply chain, and trade facilitation. Without these, firms have to build up more stock reserves and working capital, which can strongly affect national and regional competitiveness, owing to high financial costs. Moreover, lack of infrastructure hinders the logistics market as it increases costs and reduces supply chain reliability, including significant inefficiencies in transport, poor condition of storage infrastructure, complex tax structure, low rate of technology adoption, and poor skills of logistics professionals. Furthermore, lack of skilled workers, IT standard, and equipment and poor system integration have been among the key reasons for under development of the overall supply chain. Infrastructure directly influences transport costs and indirectly affects the level of inventories and consequently financial costs. Therefore, owing to poor transport infrastructure, firms need to have high levels of inventories to account for contingencies, which can result in higher overall logistics cost. Therefore, poor infrastructure along with high inventory prices and insufficient warehousing space are expected to hamper growth of last mile delivery market.

Adoption of autonomous delivery to reinforce the demand

Technological advancements in autonomous vehicles play a vital role in adoption of autonomous last-mile delivery services in the e-commerce industry. For instance, major players in the e-commerce industry such as Amazon and Alibaba have invested billions of dollars in their respective supply chains, aimed at promising faster deliveries. In 2019, Amazon invested $1billion in its one-day delivery initiative for Prime customers. Walmart and Target Corporation also offer same-day delivery programs in several locations.

Further, during the height of the pandemic, consumers gravitated toward online shopping for their domestic products, such as groceries, appliances, and other items. For instance, according to a CNBC report, total e-commerce sales in the U.S. in 2020 increased by more than 30% from 2019, before the pandemic, and in Germany, DHL saw parcel shipments increase from 5.3 million parcels to 9.0 million parcels per day, similar to Christmas peak times. Hence, to meet the demand, it has collaborated with different companies to introduce autonomous vehicles for package delivery. Such collaborations and developments carried out by several other players is anticipated to provide lucrative growth opportunities for the market during the COVID-19 pandemic situation globally.
Last Mile Delivery Market

Key Benefits For Stakeholders

  • This study presents analytical depiction of the global last mile delivery market analysis along with current trends and future estimations to depict imminent investment pockets.
  • The overall last mile delivery market opportunity is determined by understanding profitable trends to gain a stronger foothold.
  • The report presents information related to the key drivers, restraints, and opportunities of the global last mile delivery market with a detailed impact analysis.
  • The current last mile delivery market is quantitatively analyzed from 2021 to 2031 to benchmark the financial competency.
  • Porter’s five forces analysis illustrates the potency of the buyers and suppliers in the industry.

Last Mile Delivery Market Report Highlights

Aspects Details
By Delivery Mode
  • Regular Delivery
  • Same-Day Delivery or Express Delivery
By Application
  • E Commerce
  • Retail and FMCG
  • Healthcare
  • Mails and Packages
  • Others
By Destination
  • Domestic
  • International
By Service Type
  • Business-To-Business (B2B)
  • Business-To-Consumer (B2C)
  • Customer-To-Customer (C2C)
By Vehicle Type
  • Motorcycle
  • LCV
  • HCV
  • Drones
By Mode of Operation
  • Non-Autonomous
  • Autonomous
By Region
  • North America  (U.S., Canada, Mexico)
  • Europe  (U.K., Germany, France, Russia, Spain, Italy, Rest of Europe)
  • Asia-Pacific  (China, Japan, India, South Korea, Australia, Vietnam, Rest of Asia-Pacific)
  • LAMEA  (Latin America, Middle East, Africa)
Key Market Players Drone Delivery Canada, Aramex, DB Schenker, FedEx, Flirtey, Amazon.com, XPO Logistics, Inc., Jet Delivery, Inc., SF Express, Power Link Expedite, Geodis, A1 Express Services Inc., Kerry Logistics Network Limited, Flytrex, YTO Express Group Co., Dropoff, Inc., DPD, DSV (DSV PANALPINA), Deutsche Post AG (DHL GROUP), BEST Inc, United Parcel Service, Inc. (UPS), Savioke, Matternet, USA Couriers, Marble Robot
 
  • CHAPTER 1:INTRODUCTION

    • 1.1.Report description

    • 1.2.Key market segments

    • 1.3.Key benefits to the stakeholders

    • 1.4.Research Methodology

      • 1.4.1.Secondary research

      • 1.4.2.Primary research

      • 1.4.3.Analyst tools and models

  • CHAPTER 2:EXECUTIVE SUMMARY

    • 2.1.Key findings of the study

    • 2.2.CXO Perspective

  • CHAPTER 3:MARKET OVERVIEW

    • 3.1.Market definition and scope

    • 3.2.Key findings

      • 3.2.1.Top investment pockets

    • 3.3.Porter’s five forces analysis

    • 3.4.Top player positioning

    • 3.5.Market dynamics

      • 3.5.1.Drivers

      • 3.5.2.Restraints

      • 3.5.3.Opportunities

    • 3.6.COVID-19 Impact Analysis on the market

  • CHAPTER 4: LAST MILE DELIVERY MARKET, BY SERVICE TYPE

    • 4.1 Overview

      • 4.1.1 Market size and forecast

    • 4.2 Business-To-Business (B2B)

      • 4.2.1 Key market trends, growth factors and opportunities

      • 4.2.2 Market size and forecast, by region

      • 4.2.3 Market analysis by country

    • 4.3 Business-To-Consumer (B2C)

      • 4.3.1 Key market trends, growth factors and opportunities

      • 4.3.2 Market size and forecast, by region

      • 4.3.3 Market analysis by country

    • 4.4 Customer-To-Customer (C2C)

      • 4.4.1 Key market trends, growth factors and opportunities

      • 4.4.2 Market size and forecast, by region

      • 4.4.3 Market analysis by country

  • CHAPTER 5: LAST MILE DELIVERY MARKET, BY VEHICLE TYPE

    • 5.1 Overview

      • 5.1.1 Market size and forecast

    • 5.2 Motorcycle

      • 5.2.1 Key market trends, growth factors and opportunities

      • 5.2.2 Market size and forecast, by region

      • 5.2.3 Market analysis by country

    • 5.3 LCV

      • 5.3.1 Key market trends, growth factors and opportunities

      • 5.3.2 Market size and forecast, by region

      • 5.3.3 Market analysis by country

    • 5.4 HCV

      • 5.4.1 Key market trends, growth factors and opportunities

      • 5.4.2 Market size and forecast, by region

      • 5.4.3 Market analysis by country

    • 5.5 Drones

      • 5.5.1 Key market trends, growth factors and opportunities

      • 5.5.2 Market size and forecast, by region

      • 5.5.3 Market analysis by country

  • CHAPTER 6: LAST MILE DELIVERY MARKET, BY MODE OF OPERATION

    • 6.1 Overview

      • 6.1.1 Market size and forecast

    • 6.2 Non-Autonomous

      • 6.2.1 Key market trends, growth factors and opportunities

      • 6.2.2 Market size and forecast, by region

      • 6.2.3 Market analysis by country

    • 6.3 Autonomous

      • 6.3.1 Key market trends, growth factors and opportunities

      • 6.3.2 Market size and forecast, by region

      • 6.3.3 Market analysis by country

  • CHAPTER 7: LAST MILE DELIVERY MARKET, BY DELIVERY MODE

    • 7.1 Overview

      • 7.1.1 Market size and forecast

    • 7.2 Regular Delivery

      • 7.2.1 Key market trends, growth factors and opportunities

      • 7.2.2 Market size and forecast, by region

      • 7.2.3 Market analysis by country

    • 7.3 Same-Day Delivery or Express Delivery

      • 7.3.1 Key market trends, growth factors and opportunities

      • 7.3.2 Market size and forecast, by region

      • 7.3.3 Market analysis by country

  • CHAPTER 8: LAST MILE DELIVERY MARKET, BY APPLICATION

    • 8.1 Overview

      • 8.1.1 Market size and forecast

    • 8.2 E Commerce

      • 8.2.1 Key market trends, growth factors and opportunities

      • 8.2.2 Market size and forecast, by region

      • 8.2.3 Market analysis by country

    • 8.3 Retail and FMCG

      • 8.3.1 Key market trends, growth factors and opportunities

      • 8.3.2 Market size and forecast, by region

      • 8.3.3 Market analysis by country

    • 8.4 Healthcare

      • 8.4.1 Key market trends, growth factors and opportunities

      • 8.4.2 Market size and forecast, by region

      • 8.4.3 Market analysis by country

    • 8.5 Mails and Packages

      • 8.5.1 Key market trends, growth factors and opportunities

      • 8.5.2 Market size and forecast, by region

      • 8.5.3 Market analysis by country

    • 8.6 Others

      • 8.6.1 Key market trends, growth factors and opportunities

      • 8.6.2 Market size and forecast, by region

      • 8.6.3 Market analysis by country

  • CHAPTER 9: LAST MILE DELIVERY MARKET, BY DESTINATION

    • 9.1 Overview

      • 9.1.1 Market size and forecast

    • 9.2 Domestic

      • 9.2.1 Key market trends, growth factors and opportunities

      • 9.2.2 Market size and forecast, by region

      • 9.2.3 Market analysis by country

    • 9.3 International

      • 9.3.1 Key market trends, growth factors and opportunities

      • 9.3.2 Market size and forecast, by region

      • 9.3.3 Market analysis by country

  • CHAPTER 10: LAST MILE DELIVERY MARKET, BY REGION

    • 10.1 Overview

      • 10.1.1 Market size and forecast

    • 10.2 North America

      • 10.2.1 Key trends and opportunities

      • 10.2.2 North America Market size and forecast, by Service Type

      • 10.2.3 North America Market size and forecast, by Vehicle Type

      • 10.2.4 North America Market size and forecast, by Mode of Operation

      • 10.2.5 North America Market size and forecast, by Delivery Mode

      • 10.2.6 North America Market size and forecast, by Application

      • 10.2.7 North America Market size and forecast, by Destination

      • 10.2.8 North America Market size and forecast, by country

        • 10.2.8.1 U.S.
          • 10.2.8.1.1 Market size and forecast, by Service Type
          • 10.2.8.1.2 Market size and forecast, by Vehicle Type
          • 10.2.8.1.3 Market size and forecast, by Mode of Operation
          • 10.2.8.1.4 Market size and forecast, by Delivery Mode
          • 10.2.8.1.5 Market size and forecast, by Application
          • 10.2.8.1.6 Market size and forecast, by Destination
        • 10.2.8.2 Canada
          • 10.2.8.2.1 Market size and forecast, by Service Type
          • 10.2.8.2.2 Market size and forecast, by Vehicle Type
          • 10.2.8.2.3 Market size and forecast, by Mode of Operation
          • 10.2.8.2.4 Market size and forecast, by Delivery Mode
          • 10.2.8.2.5 Market size and forecast, by Application
          • 10.2.8.2.6 Market size and forecast, by Destination
        • 10.2.8.3 Mexico
          • 10.2.8.3.1 Market size and forecast, by Service Type
          • 10.2.8.3.2 Market size and forecast, by Vehicle Type
          • 10.2.8.3.3 Market size and forecast, by Mode of Operation
          • 10.2.8.3.4 Market size and forecast, by Delivery Mode
          • 10.2.8.3.5 Market size and forecast, by Application
          • 10.2.8.3.6 Market size and forecast, by Destination
    • 10.3 Europe

      • 10.3.1 Key trends and opportunities

      • 10.3.2 Europe Market size and forecast, by Service Type

      • 10.3.3 Europe Market size and forecast, by Vehicle Type

      • 10.3.4 Europe Market size and forecast, by Mode of Operation

      • 10.3.5 Europe Market size and forecast, by Delivery Mode

      • 10.3.6 Europe Market size and forecast, by Application

      • 10.3.7 Europe Market size and forecast, by Destination

      • 10.3.8 Europe Market size and forecast, by country

        • 10.3.8.1 U.K.
          • 10.3.8.1.1 Market size and forecast, by Service Type
          • 10.3.8.1.2 Market size and forecast, by Vehicle Type
          • 10.3.8.1.3 Market size and forecast, by Mode of Operation
          • 10.3.8.1.4 Market size and forecast, by Delivery Mode
          • 10.3.8.1.5 Market size and forecast, by Application
          • 10.3.8.1.6 Market size and forecast, by Destination
        • 10.3.8.2 Germany
          • 10.3.8.2.1 Market size and forecast, by Service Type
          • 10.3.8.2.2 Market size and forecast, by Vehicle Type
          • 10.3.8.2.3 Market size and forecast, by Mode of Operation
          • 10.3.8.2.4 Market size and forecast, by Delivery Mode
          • 10.3.8.2.5 Market size and forecast, by Application
          • 10.3.8.2.6 Market size and forecast, by Destination
        • 10.3.8.3 France
          • 10.3.8.3.1 Market size and forecast, by Service Type
          • 10.3.8.3.2 Market size and forecast, by Vehicle Type
          • 10.3.8.3.3 Market size and forecast, by Mode of Operation
          • 10.3.8.3.4 Market size and forecast, by Delivery Mode
          • 10.3.8.3.5 Market size and forecast, by Application
          • 10.3.8.3.6 Market size and forecast, by Destination
        • 10.3.8.4 Russia
          • 10.3.8.4.1 Market size and forecast, by Service Type
          • 10.3.8.4.2 Market size and forecast, by Vehicle Type
          • 10.3.8.4.3 Market size and forecast, by Mode of Operation
          • 10.3.8.4.4 Market size and forecast, by Delivery Mode
          • 10.3.8.4.5 Market size and forecast, by Application
          • 10.3.8.4.6 Market size and forecast, by Destination
        • 10.3.8.5 Spain
          • 10.3.8.5.1 Market size and forecast, by Service Type
          • 10.3.8.5.2 Market size and forecast, by Vehicle Type
          • 10.3.8.5.3 Market size and forecast, by Mode of Operation
          • 10.3.8.5.4 Market size and forecast, by Delivery Mode
          • 10.3.8.5.5 Market size and forecast, by Application
          • 10.3.8.5.6 Market size and forecast, by Destination
        • 10.3.8.6 Italy
          • 10.3.8.6.1 Market size and forecast, by Service Type
          • 10.3.8.6.2 Market size and forecast, by Vehicle Type
          • 10.3.8.6.3 Market size and forecast, by Mode of Operation
          • 10.3.8.6.4 Market size and forecast, by Delivery Mode
          • 10.3.8.6.5 Market size and forecast, by Application
          • 10.3.8.6.6 Market size and forecast, by Destination
        • 10.3.8.7 Rest of Europe
          • 10.3.8.7.1 Market size and forecast, by Service Type
          • 10.3.8.7.2 Market size and forecast, by Vehicle Type
          • 10.3.8.7.3 Market size and forecast, by Mode of Operation
          • 10.3.8.7.4 Market size and forecast, by Delivery Mode
          • 10.3.8.7.5 Market size and forecast, by Application
          • 10.3.8.7.6 Market size and forecast, by Destination
    • 10.4 Asia-Pacific

      • 10.4.1 Key trends and opportunities

      • 10.4.2 Asia-Pacific Market size and forecast, by Service Type

      • 10.4.3 Asia-Pacific Market size and forecast, by Vehicle Type

      • 10.4.4 Asia-Pacific Market size and forecast, by Mode of Operation

      • 10.4.5 Asia-Pacific Market size and forecast, by Delivery Mode

      • 10.4.6 Asia-Pacific Market size and forecast, by Application

      • 10.4.7 Asia-Pacific Market size and forecast, by Destination

      • 10.4.8 Asia-Pacific Market size and forecast, by country

        • 10.4.8.1 China
          • 10.4.8.1.1 Market size and forecast, by Service Type
          • 10.4.8.1.2 Market size and forecast, by Vehicle Type
          • 10.4.8.1.3 Market size and forecast, by Mode of Operation
          • 10.4.8.1.4 Market size and forecast, by Delivery Mode
          • 10.4.8.1.5 Market size and forecast, by Application
          • 10.4.8.1.6 Market size and forecast, by Destination
        • 10.4.8.2 Japan
          • 10.4.8.2.1 Market size and forecast, by Service Type
          • 10.4.8.2.2 Market size and forecast, by Vehicle Type
          • 10.4.8.2.3 Market size and forecast, by Mode of Operation
          • 10.4.8.2.4 Market size and forecast, by Delivery Mode
          • 10.4.8.2.5 Market size and forecast, by Application
          • 10.4.8.2.6 Market size and forecast, by Destination
        • 10.4.8.3 India
          • 10.4.8.3.1 Market size and forecast, by Service Type
          • 10.4.8.3.2 Market size and forecast, by Vehicle Type
          • 10.4.8.3.3 Market size and forecast, by Mode of Operation
          • 10.4.8.3.4 Market size and forecast, by Delivery Mode
          • 10.4.8.3.5 Market size and forecast, by Application
          • 10.4.8.3.6 Market size and forecast, by Destination
        • 10.4.8.4 South Korea
          • 10.4.8.4.1 Market size and forecast, by Service Type
          • 10.4.8.4.2 Market size and forecast, by Vehicle Type
          • 10.4.8.4.3 Market size and forecast, by Mode of Operation
          • 10.4.8.4.4 Market size and forecast, by Delivery Mode
          • 10.4.8.4.5 Market size and forecast, by Application
          • 10.4.8.4.6 Market size and forecast, by Destination
        • 10.4.8.5 Australia
          • 10.4.8.5.1 Market size and forecast, by Service Type
          • 10.4.8.5.2 Market size and forecast, by Vehicle Type
          • 10.4.8.5.3 Market size and forecast, by Mode of Operation
          • 10.4.8.5.4 Market size and forecast, by Delivery Mode
          • 10.4.8.5.5 Market size and forecast, by Application
          • 10.4.8.5.6 Market size and forecast, by Destination
        • 10.4.8.6 Vietnam
          • 10.4.8.6.1 Market size and forecast, by Service Type
          • 10.4.8.6.2 Market size and forecast, by Vehicle Type
          • 10.4.8.6.3 Market size and forecast, by Mode of Operation
          • 10.4.8.6.4 Market size and forecast, by Delivery Mode
          • 10.4.8.6.5 Market size and forecast, by Application
          • 10.4.8.6.6 Market size and forecast, by Destination
        • 10.4.8.7 Rest of Asia-Pacific
          • 10.4.8.7.1 Market size and forecast, by Service Type
          • 10.4.8.7.2 Market size and forecast, by Vehicle Type
          • 10.4.8.7.3 Market size and forecast, by Mode of Operation
          • 10.4.8.7.4 Market size and forecast, by Delivery Mode
          • 10.4.8.7.5 Market size and forecast, by Application
          • 10.4.8.7.6 Market size and forecast, by Destination
    • 10.5 LAMEA

      • 10.5.1 Key trends and opportunities

      • 10.5.2 LAMEA Market size and forecast, by Service Type

      • 10.5.3 LAMEA Market size and forecast, by Vehicle Type

      • 10.5.4 LAMEA Market size and forecast, by Mode of Operation

      • 10.5.5 LAMEA Market size and forecast, by Delivery Mode

      • 10.5.6 LAMEA Market size and forecast, by Application

      • 10.5.7 LAMEA Market size and forecast, by Destination

      • 10.5.8 LAMEA Market size and forecast, by country

        • 10.5.8.1 Latin America
          • 10.5.8.1.1 Market size and forecast, by Service Type
          • 10.5.8.1.2 Market size and forecast, by Vehicle Type
          • 10.5.8.1.3 Market size and forecast, by Mode of Operation
          • 10.5.8.1.4 Market size and forecast, by Delivery Mode
          • 10.5.8.1.5 Market size and forecast, by Application
          • 10.5.8.1.6 Market size and forecast, by Destination
        • 10.5.8.2 Middle East
          • 10.5.8.2.1 Market size and forecast, by Service Type
          • 10.5.8.2.2 Market size and forecast, by Vehicle Type
          • 10.5.8.2.3 Market size and forecast, by Mode of Operation
          • 10.5.8.2.4 Market size and forecast, by Delivery Mode
          • 10.5.8.2.5 Market size and forecast, by Application
          • 10.5.8.2.6 Market size and forecast, by Destination
        • 10.5.8.3 Africa
          • 10.5.8.3.1 Market size and forecast, by Service Type
          • 10.5.8.3.2 Market size and forecast, by Vehicle Type
          • 10.5.8.3.3 Market size and forecast, by Mode of Operation
          • 10.5.8.3.4 Market size and forecast, by Delivery Mode
          • 10.5.8.3.5 Market size and forecast, by Application
          • 10.5.8.3.6 Market size and forecast, by Destination
  • CHAPTER 11: COMPANY LANDSCAPE

    • 11.1. Introduction

    • 11.2. Top winning strategies

    • 11.3. Product Mapping of Top 10 Player

    • 11.4. Competitive Dashboard

    • 11.5. Competitive Heatmap

    • 11.6. Key developments

  • CHAPTER 12: COMPANY PROFILES

    • 12.1 A1 Express Services Inc.

      • 12.1.1 Company overview

      • 12.1.2 Company snapshot

      • 12.1.3 Operating business segments

      • 12.1.4 Product portfolio

      • 12.1.5 Business performance

      • 12.1.6 Key strategic moves and developments

    • 12.2 Amazon.com

      • 12.2.1 Company overview

      • 12.2.2 Company snapshot

      • 12.2.3 Operating business segments

      • 12.2.4 Product portfolio

      • 12.2.5 Business performance

      • 12.2.6 Key strategic moves and developments

    • 12.3 Aramex

      • 12.3.1 Company overview

      • 12.3.2 Company snapshot

      • 12.3.3 Operating business segments

      • 12.3.4 Product portfolio

      • 12.3.5 Business performance

      • 12.3.6 Key strategic moves and developments

    • 12.4 BEST Inc

      • 12.4.1 Company overview

      • 12.4.2 Company snapshot

      • 12.4.3 Operating business segments

      • 12.4.4 Product portfolio

      • 12.4.5 Business performance

      • 12.4.6 Key strategic moves and developments

    • 12.5 DB Schenker

      • 12.5.1 Company overview

      • 12.5.2 Company snapshot

      • 12.5.3 Operating business segments

      • 12.5.4 Product portfolio

      • 12.5.5 Business performance

      • 12.5.6 Key strategic moves and developments

    • 12.6 Deutsche Post AG (DHL GROUP)

      • 12.6.1 Company overview

      • 12.6.2 Company snapshot

      • 12.6.3 Operating business segments

      • 12.6.4 Product portfolio

      • 12.6.5 Business performance

      • 12.6.6 Key strategic moves and developments

    • 12.7 DPD

      • 12.7.1 Company overview

      • 12.7.2 Company snapshot

      • 12.7.3 Operating business segments

      • 12.7.4 Product portfolio

      • 12.7.5 Business performance

      • 12.7.6 Key strategic moves and developments

    • 12.8 Drone Delivery Canada

      • 12.8.1 Company overview

      • 12.8.2 Company snapshot

      • 12.8.3 Operating business segments

      • 12.8.4 Product portfolio

      • 12.8.5 Business performance

      • 12.8.6 Key strategic moves and developments

    • 12.9 Dropoff, Inc.

      • 12.9.1 Company overview

      • 12.9.2 Company snapshot

      • 12.9.3 Operating business segments

      • 12.9.4 Product portfolio

      • 12.9.5 Business performance

      • 12.9.6 Key strategic moves and developments

    • 12.10 DSV (DSV PANALPINA)

      • 12.10.1 Company overview

      • 12.10.2 Company snapshot

      • 12.10.3 Operating business segments

      • 12.10.4 Product portfolio

      • 12.10.5 Business performance

      • 12.10.6 Key strategic moves and developments

    • 12.11 FedEx

      • 12.11.1 Company overview

      • 12.11.2 Company snapshot

      • 12.11.3 Operating business segments

      • 12.11.4 Product portfolio

      • 12.11.5 Business performance

      • 12.11.6 Key strategic moves and developments

    • 12.12 Flirtey

      • 12.12.1 Company overview

      • 12.12.2 Company snapshot

      • 12.12.3 Operating business segments

      • 12.12.4 Product portfolio

      • 12.12.5 Business performance

      • 12.12.6 Key strategic moves and developments

    • 12.13 Flytrex

      • 12.13.1 Company overview

      • 12.13.2 Company snapshot

      • 12.13.3 Operating business segments

      • 12.13.4 Product portfolio

      • 12.13.5 Business performance

      • 12.13.6 Key strategic moves and developments

    • 12.14 Geodis

      • 12.14.1 Company overview

      • 12.14.2 Company snapshot

      • 12.14.3 Operating business segments

      • 12.14.4 Product portfolio

      • 12.14.5 Business performance

      • 12.14.6 Key strategic moves and developments

    • 12.15 Jet Delivery, Inc.

      • 12.15.1 Company overview

      • 12.15.2 Company snapshot

      • 12.15.3 Operating business segments

      • 12.15.4 Product portfolio

      • 12.15.5 Business performance

      • 12.15.6 Key strategic moves and developments

    • 12.16 Kerry Logistics Network Limited

      • 12.16.1 Company overview

      • 12.16.2 Company snapshot

      • 12.16.3 Operating business segments

      • 12.16.4 Product portfolio

      • 12.16.5 Business performance

      • 12.16.6 Key strategic moves and developments

    • 12.17 Marble Robot

      • 12.17.1 Company overview

      • 12.17.2 Company snapshot

      • 12.17.3 Operating business segments

      • 12.17.4 Product portfolio

      • 12.17.5 Business performance

      • 12.17.6 Key strategic moves and developments

    • 12.18 Matternet

      • 12.18.1 Company overview

      • 12.18.2 Company snapshot

      • 12.18.3 Operating business segments

      • 12.18.4 Product portfolio

      • 12.18.5 Business performance

      • 12.18.6 Key strategic moves and developments

    • 12.19 Power Link Expedite

      • 12.19.1 Company overview

      • 12.19.2 Company snapshot

      • 12.19.3 Operating business segments

      • 12.19.4 Product portfolio

      • 12.19.5 Business performance

      • 12.19.6 Key strategic moves and developments

    • 12.20 Savioke

      • 12.20.1 Company overview

      • 12.20.2 Company snapshot

      • 12.20.3 Operating business segments

      • 12.20.4 Product portfolio

      • 12.20.5 Business performance

      • 12.20.6 Key strategic moves and developments

    • 12.21 SF Express

      • 12.21.1 Company overview

      • 12.21.2 Company snapshot

      • 12.21.3 Operating business segments

      • 12.21.4 Product portfolio

      • 12.21.5 Business performance

      • 12.21.6 Key strategic moves and developments

    • 12.22 United Parcel Service, Inc. (UPS)

      • 12.22.1 Company overview

      • 12.22.2 Company snapshot

      • 12.22.3 Operating business segments

      • 12.22.4 Product portfolio

      • 12.22.5 Business performance

      • 12.22.6 Key strategic moves and developments

    • 12.23 USA Couriers

      • 12.23.1 Company overview

      • 12.23.2 Company snapshot

      • 12.23.3 Operating business segments

      • 12.23.4 Product portfolio

      • 12.23.5 Business performance

      • 12.23.6 Key strategic moves and developments

    • 12.24 XPO Logistics, Inc.

      • 12.24.1 Company overview

      • 12.24.2 Company snapshot

      • 12.24.3 Operating business segments

      • 12.24.4 Product portfolio

      • 12.24.5 Business performance

      • 12.24.6 Key strategic moves and developments

    • 12.25 YTO Express Group Co.

      • 12.25.1 Company overview

      • 12.25.2 Company snapshot

      • 12.25.3 Operating business segments

      • 12.25.4 Product portfolio

      • 12.25.5 Business performance

      • 12.25.6 Key strategic moves and developments

  • LIST OF TABLES

  • TABLE 01. LAST MILE DELIVERY MARKET, BY SERVICE, 2021-2031 ($MILLION)
    TABLE 02. LAST MILE DELIVERY MARKET FOR BUSINESS-TO-BUSINESS, BY REGION, 2021-2031 ($MILLION)
    TABLE 03. LAST MILE DELIVERY MARKET FOR BUSINESS-TO-CONSUMER (B2C), BY REGION, 2021-2031 ($MILLION)
    TABLE 04. LAST MILE DELIVERY MARKET FOR CUSTOMER-TO-CUSTOMER (C2C), BY REGION, 2021-2031 ($MILLION)
    TABLE 05. LAST MILE DELIVERY MARKET, BY VEHICLE TYPE, 2021-2031 ($MILLION)
    TABLE 06. LAST MILE DELIVERY MARKET FOR MOTORCYCLE, BY REGION 2021-2031 ($MILLION)
    TABLE 07. LAST MILE DELIVERY MARKET FOR LIGHT COMMERCIAL VEHICLE (LCV), BY REGION 2021-2031 ($MILLION)
    TABLE 08. LAST MILE DELIVERY MARKET FOR HEAVY COMMERCIAL VEHICLE (HCV), BY REGION 2021-2031 ($MILLION)
    TABLE 09. LAST MILE DELIVERY MARKET FOR DRONES, BY REGION 2021-2031 ($MILLION)
    TABLE 10. LAST MILE DELIVERY MARKET, BY MODE OF OPERATION, 2021-2031 ($MILLION)
    TABLE 11. LAST MILE DELIVERY MARKET FOR NON-AUTONOMOUS, BY REGION 2021-2031 ($MILLION)
    TABLE 12. LAST MILE DELIVERY MARKET FOR AUTONOMOUS, BY REGION 2021-2031 ($MILLION)
    TABLE 13. LAST MILE DELIVERY MARKET, BY DELIVERY MODE, 2021-2031 ($MILLION)
    TABLE 14. LAST MILE DELIVERY MARKET FOR REGULAR DELIVERY, BY REGION 2021-2031 ($MILLION)
    TABLE 15. LAST MILE DELIVERY MARKET FOR SAME-DAY DELIVERY OR EXPRESS DELIVERY, BY REGION 2021-2031 ($MILLION)
    TABLE 16. LAST MILE DELIVERY MARKET, BY APPLICATION, 2021-2031 ($MILLION)
    TABLE 17. LAST MILE DELIVERY MARKET FOR E-COMMERCE, BY REGION 2021-2031 ($MILLION)
    TABLE 18. LAST MILE DELIVERY MARKET FOR E-COMMERCE, BY DELIVERY MODE 2021-2031 ($MILLION)
    TABLE 19. LAST MILE DELIVERY MARKET FOR RETAIL & FMCG, BY REGION 2021-2031 ($MILLION)
    TABLE 20. LAST MILE DELIVERY MARKET FOR RETAIL & FMCG, BY DELIVERY MODE 2021-2031 ($MILLION)
    TABLE 21. LAST MILE DELIVERY MARKET FOR HEALTHCARE, BY REGION 2021-2031 ($MILLION)
    TABLE 22. LAST MILE DELIVERY MARKET FOR HEALTHCARE, BY DELIVERY MODE 2021-2031 ($MILLION)
    TABLE 23. LAST MILE DELIVERY MARKET FOR MAILS AND PACKAGES, BY REGION 2021-2031 ($MILLION)
    TABLE 24. LAST MILE DELIVERY MARKET FOR MAILS AND PACKAGES, BY DELIVERY MODE 2021-2031 ($MILLION)
    TABLE 25. LAST MILE DELIVERY MARKET FOR OTHERS, BY REGION 2021-2031 ($MILLION)
    TABLE 26. LAST MILE DELIVERY MARKET FOR OTHERS, BY DELIVERY MODE 2021-2031 ($MILLION)
    TABLE 27. LAST MILE DELIVERY MARKET, BY DESTINATION, 2021-2031 ($MILLION)
    TABLE 28. LAST MILE DELIVERY MARKET FOR DOMESTICS, BY REGION 2021-2031 ($MILLION)
    TABLE 29. LAST MILE DELIVERY MARKET FOR INTERNATIONAL, BY REGION 2021-2031 ($MILLION)
    TABLE 30. LAST MILE DELIVERY MARKET, BY REGION, 2021-2031 ($MILLION)
    TABLE 31. NORTH AMERICA LAST MILE DELIVERY MARKET, BY COUNTRY, 2021-2031 ($MILLION)
    TABLE 32. NORTH AMERICA LAST MILE DELIVERY MARKET, BY SERVICE, 2021-2031 ($MILLION)
    TABLE 33. NORTH AMERICA LAST MILE DELIVERY MARKET, BY VEHICLE TYPE, 2021-2031 ($MILLION)
    TABLE 34. NORTH AMERICA LAST MILE DELIVERY MARKET, BY MODE OF OPERATION, 2021-2031 ($MILLION)
    TABLE 35. NORTH AMERICA LAST MILE DELIVERY MARKET, BY DELIVERY MODE, 2021-2031 ($MILLION)
    TABLE 36. NORTH AMERICA LAST MILE DELIVERY MARKET, BY APPLICATION, 2021-2031 ($MILLION)
    TABLE 37. NORTH AMERICA E-COMMERCE LAST MILE DELIVERY MARKET, BY DELIVERY MODE, 2021-2031 ($MILLION)
    TABLE 38. NORTH AMERICA RETAIL & FMCG LAST MILE DELIVERY MARKET, BY DELIVERY MODE, 2021-2031 ($MILLION)
    TABLE 39. NORTH AMERICA HEALTHCARE LAST MILE DELIVERY MARKET, BY DELIVERY MODE, 2021-2031 ($MILLION)
    TABLE 40. NORTH AMERICA MAILS & PACKAGES LAST MILE DELIVERY MARKET, BY DELIVERY MODE, 2021-2031 ($MILLION)
    TABLE 41. NORTH AMERICA OTHERS LAST MILE DELIVERY MARKET, BY DELIVERY MODE, 2021-2031 ($MILLION)
    TABLE 42. NORTH AMERICA LAST MILE DELIVERY MARKET, BY DESTINATION, 2021-2031 ($MILLION)
    TABLE 43. U.S. LAST MILE DELIVERY MARKET, BY SERVICE, 2021-2031 ($MILLION)
    TABLE 44. U.S. LAST MILE DELIVERY MARKET, BY VEHICLE TYPE, 2021-2031 ($MILLION)
    TABLE 45. U.S. LAST MILE DELIVERY MARKET, BY MODE OF OPERATION, 2021-2031 ($MILLION)
    TABLE 46. U.S. LAST MILE DELIVERY MARKET, BY DELIVERY MODE, 2021-2031 ($MILLION)
    TABLE 47. U.S. LAST MILE DELIVERY MARKET, BY APPLICATION, 2021-2031 ($MILLION)
    TABLE 48. U.S. LAST MILE DELIVERY MARKET, BY DESTINATION, 2021-2031 ($MILLION)
    TABLE 49. CANADA LAST MILE DELIVERY MARKET, BY SERVICE, 2021-2031 ($MILLION)
    TABLE 50. CANADA LAST MILE DELIVERY MARKET, BY VEHICLE TYPE, 2021-2031 ($MILLION)
    TABLE 51. CANADA LAST MILE DELIVERY MARKET, BY MODE OF OPERATION, 2021-2031 ($MILLION)
    TABLE 52. CANADA LAST MILE DELIVERY MARKET, BY DELIVERY MODE, 2021-2031 ($MILLION)
    TABLE 53. CANADA LAST MILE DELIVERY MARKET, BY APPLICATION, 2021-2031 ($MILLION)
    TABLE 54. CANADA LAST MILE DELIVERY MARKET, BY DESTINATION, 2021-2031 ($MILLION)
    TABLE 55. MEXICO LAST MILE DELIVERY MARKET, BY SERVICE, 2021-2031 ($MILLION)
    TABLE 56. MEXICO LAST MILE DELIVERY MARKET, BY VEHICLE TYPE, 2021-2031 ($MILLION)
    TABLE 57. MEXICO LAST MILE DELIVERY MARKET, BY MODE OF OPERATION, 2021-2031 ($MILLION)
    TABLE 58. MEXICO LAST MILE DELIVERY MARKET, BY DELIVERY MODE, 2021-2031 ($MILLION)
    TABLE 59. MEXICO LAST MILE DELIVERY MARKET, BY APPLICATION, 2021-2031 ($MILLION)
    TABLE 60. MEXICO LAST MILE DELIVERY MARKET, BY DESTINATION, 2021-2031 ($MILLION)
    TABLE 61. EUROPE LAST MILE DELIVERY MARKET, BY COUNTRY, 2021-2031 ($MILLION)
    TABLE 62. EUROPE LAST MILE DELIVERY MARKET, BY SERVICE, 2021-2031 ($MILLION)
    TABLE 63. EUROPE LAST MILE DELIVERY MARKET, BY VEHICLE TYPE, 2021-2031 ($MILLION)
    TABLE 64. EUROPE LAST MILE DELIVERY MARKET, BY MODE OF OPERATION, 2021-2031 ($MILLION)
    TABLE 65. EUROPE LAST MILE DELIVERY MARKET, BY DELIVERY MODE, 2021-2031 ($MILLION)
    TABLE 66. EUROPE LAST MILE DELIVERY MARKET, BY APPLICATION, 2021-2031 ($MILLION)
    TABLE 67. EUROPE E-COMMERCE LAST MILE DELIVERY MARKET, BY DELIVERY MODE, 2021-2031 ($MILLION)
    TABLE 68. EUROPE RETAIL & FMCG LAST MILE DELIVERY MARKET, BY DELIVERY MODE, 2021-2031 ($MILLION)
    TABLE 69. EUROPE HEALTHCARE LAST MILE DELIVERY MARKET, BY DELIVERY MODE, 2021-2031 ($MILLION)
    TABLE 70. EUROPE MAILS & PACKAGES LAST MILE DELIVERY MARKET, BY DELIVERY MODE, 2021-2031 ($MILLION)
    TABLE 71. EUROPE OTHERS LAST MILE DELIVERY MARKET, BY DELIVERY MODE, 2021-2031 ($MILLION)
    TABLE 72. EUROPE LAST MILE DELIVERY MARKET, BY DESTINATION, 2021-2031 ($MILLION)
    TABLE 73. UK LAST MILE DELIVERY MARKET, BY SERVICE, 2021-2031 ($MILLION)
    TABLE 74. UK LAST MILE DELIVERY MARKET, BY VEHICLE TYPE, 2021-2031 ($MILLION)
    TABLE 75. UK LAST MILE DELIVERY MARKET, BY MODE OF OPERATION, 2021-2031 ($MILLION)
    TABLE 76. UK LAST MILE DELIVERY MARKET, BY DELIVERY MODE, 2021-2031 ($MILLION)
    TABLE 77. UK LAST MILE DELIVERY MARKET, BY APPLICATION, 2021-2031 ($MILLION)
    TABLE 78. UK LAST MILE DELIVERY MARKET, BY DESTINATION, 2021-2031 ($MILLION)
    TABLE 79. GERMANY LAST MILE DELIVERY MARKET, BY SERVICE, 2021-2031 ($MILLION)
    TABLE 80. GERMANY LAST MILE DELIVERY MARKET, BY VEHICLE TYPE, 2021-2031 ($MILLION)
    TABLE 81. GERMANY LAST MILE DELIVERY MARKET, BY MODE OF OPERATION, 2021-2031 ($MILLION)
    TABLE 82. GERMANY LAST MILE DELIVERY MARKET, BY DELIVERY MODE, 2021-2031 ($MILLION)
    TABLE 83. GERMANY LAST MILE DELIVERY MARKET, BY APPLICATION, 2021-2031 ($MILLION)
    TABLE 84. GERMANY LAST MILE DELIVERY MARKET, BY DESTINATION, 2021-2031 ($MILLION)
    TABLE 85. FRANCE LAST MILE DELIVERY MARKET, BY SERVICE, 2021-2031 ($MILLION)
    TABLE 86. FRANCE LAST MILE DELIVERY MARKET, BY VEHICLE TYPE, 2021-2031 ($MILLION)
    TABLE 87. FRANCE LAST MILE DELIVERY MARKET, BY MODE OF OPERATION, 2021-2031 ($MILLION)
    TABLE 88. FRANCE LAST MILE DELIVERY MARKET, BY DELIVERY MODE, 2021-2031 ($MILLION)
    TABLE 89. FRANCE LAST MILE DELIVERY MARKET, BY APPLICATION, 2021-2031 ($MILLION)
    TABLE 90. FRANCE LAST MILE DELIVERY MARKET, BY DESTINATION, 2021-2031 ($MILLION)
    TABLE 91. ITALY LAST MILE DELIVERY MARKET, BY SERVICE, 2021-2031 ($MILLION)
    TABLE 92. ITALY LAST MILE DELIVERY MARKET, BY VEHICLE TYPE, 2021-2031 ($MILLION)
    TABLE 93. ITALY LAST MILE DELIVERY MARKET, BY MODE OF OPERATION, 2021-2031 ($MILLION)
    TABLE 94. ITALY LAST MILE DELIVERY MARKET, BY DELIVERY MODE, 2021-2031 ($MILLION)
    TABLE 95. ITALY LAST MILE DELIVERY MARKET, BY APPLICATION, 2021-2031 ($MILLION)
    TABLE 96. ITALY LAST MILE DELIVERY MARKET, BY DESTINATION, 2021-2031 ($MILLION)
    TABLE 97. SPAIN LAST MILE DELIVERY MARKET, BY SERVICE, 2021-2031 ($MILLION)
    TABLE 98. SPAIN LAST MILE DELIVERY MARKET, BY VEHICLE TYPE, 2021-2031 ($MILLION)
    TABLE 99. SPAIN LAST MILE DELIVERY MARKET, BY MODE OF OPERATION, 2021-2031 ($MILLION)
    TABLE 100. SPAIN LAST MILE DELIVERY MARKET, BY DELIVERY MODE, 2021-2031 ($MILLION)
    TABLE 101. SPAIN LAST MILE DELIVERY MARKET, BY APPLICATION, 2021-2031 ($MILLION)
    TABLE 102. SPAIN LAST MILE DELIVERY MARKET, BY DESTINATION, 2021-2031 ($MILLION)
    TABLE 103. RUSSIA LAST MILE DELIVERY MARKET, BY SERVICE, 2021-2031 ($MILLION)
    TABLE 104. RUSSIA LAST MILE DELIVERY MARKET, BY VEHICLE TYPE, 2021-2031 ($MILLION)
    TABLE 105. RUSSIA LAST MILE DELIVERY MARKET, BY MODE OF OPERATION, 2021-2031 ($MILLION)
    TABLE 106. RUSSIA LAST MILE DELIVERY MARKET, BY DELIVERY MODE, 2021-2031 ($MILLION)
    TABLE 107. RUSSIA LAST MILE DELIVERY MARKET, BY APPLICATION, 2021-2031 ($MILLION)
    TABLE 108. RUSSIA LAST MILE DELIVERY MARKET, BY DESTINATION, 2021-2031 ($MILLION)
    TABLE 109. REST OF EUROPE LAST MILE DELIVERY MARKET, BY SERVICE, 2021-2031 ($MILLION)
    TABLE 110. REST OF EUROPE LAST MILE DELIVERY MARKET, BY VEHICLE TYPE, 2021-2031 ($MILLION)
    TABLE 111. REST OF EUROPE LAST MILE DELIVERY MARKET, BY MODE OF OPERATION, 2021-2031 ($MILLION)
    TABLE 112. REST OF EUROPE LAST MILE DELIVERY MARKET, BY DELIVERY MODE, 2021-2031 ($MILLION)
    TABLE 113. REST OF EUROPE LAST MILE DELIVERY MARKET, BY APPLICATION, 2021-2031 ($MILLION)
    TABLE 114. REST OF EUROPE LAST MILE DELIVERY MARKET, BY DESTINATION, 2021-2031 ($MILLION)
    TABLE 115. ASIA-PACIFIC LAST MILE DELIVERY MARKET, BY COUNTRY, 2021-2031 ($MILLION)
    TABLE 116. ASIA-PACIFIC LAST MILE DELIVERY MARKET, BY SERVICE, 2021-2031 ($MILLION)
    TABLE 117. ASIA-PACIFIC LAST MILE DELIVERY MARKET, BY VEHICLE TYPE, 2021-2031 ($MILLION)
    TABLE 118. ASIA-PACIFIC LAST MILE DELIVERY MARKET, BY MODE OF OPERATION, 2021-2031 ($MILLION)
    TABLE 119. ASIA-PACIFIC LAST MILE DELIVERY MARKET, BY DELIVERY MODE, 2021-2031 ($MILLION)
    TABLE 120. ASIA-PACIFIC LAST MILE DELIVERY MARKET, BY APPLICATION, 2021-2031 ($MILLION)
    TABLE 121. ASIA-PACIFIC E-COMMERCE LAST MILE DELIVERY MARKET, BY DELIVERY MODE, 2021-2031 ($MILLION)
    TABLE 122. ASIA-PACIFIC RETAIL & FMCG LAST MILE DELIVERY MARKET, BY DELIVERY MODE, 2021-2031 ($MILLION)
    TABLE 123. ASIA-PACIFIC HEALTHCARE LAST MILE DELIVERY MARKET, BY DELIVERY MODE, 2021-2031 ($MILLION)
    TABLE 124. ASIA-PACIFIC MAILS & PACKAGES LAST MILE DELIVERY MARKET, BY DELIVERY MODE, 2021-2031 ($MILLION)
    TABLE 125. ASIA-PACIFIC OTHERS LAST MILE DELIVERY MARKET, BY DELIVERY MODE, 2021-2031 ($MILLION)
    TABLE 126. ASIA-PACIFIC LAST MILE DELIVERY MARKET, BY DESTINATION, 2021-2031 ($MILLION)
    TABLE 127. CHINA LAST MILE DELIVERY MARKET, BY SERVICE, 2021-2031 ($MILLION)
    TABLE 128. CHINA LAST MILE DELIVERY MARKET, BY VEHICLE TYPE, 2021-2031 ($MILLION)
    TABLE 129. CHINA LAST MILE DELIVERY MARKET, BY MODE OF OPERATION, 2021-2031 ($MILLION)
    TABLE 130. CHINA LAST MILE DELIVERY MARKET, BY DELIVERY MODE, 2021-2031 ($MILLION)
    TABLE 131. CHINA LAST MILE DELIVERY MARKET, BY APPLICATION, 2021-2031 ($MILLION)
    TABLE 132. CHINA LAST MILE DELIVERY MARKET, BY DESTINATION, 2021-2031 ($MILLION)
    TABLE 133. JAPAN LAST MILE DELIVERY MARKET, BY SERVICE, 2021-2031 ($MILLION)
    TABLE 134. JAPAN LAST MILE DELIVERY MARKET, BY VEHICLE TYPE, 2021-2031 ($MILLION)
    TABLE 135. JAPAN LAST MILE DELIVERY MARKET, BY MODE OF OPERATION, 2021-2031 ($MILLION)
    TABLE 136. JAPAN LAST MILE DELIVERY MARKET, BY DELIVERY MODE, 2021-2031 ($MILLION)
    TABLE 137. JAPAN LAST MILE DELIVERY MARKET, BY APPLICATION, 2021-2031 ($MILLION)
    TABLE 138. JAPAN LAST MILE DELIVERY MARKET, BY DESTINATION, 2021-2031 ($MILLION)
    TABLE 139. INDIA LAST MILE DELIVERY MARKET, BY SERVICE, 2021-2031 ($MILLION)
    TABLE 140. INDIA LAST MILE DELIVERY MARKET, BY VEHICLE TYPE, 2021-2031 ($MILLION)
    TABLE 141. INDIA LAST MILE DELIVERY MARKET, BY MODE OF OPERATION, 2021-2031 ($MILLION)
    TABLE 142. INDIA LAST MILE DELIVERY MARKET, BY DELIVERY MODE, 2021-2031 ($MILLION)
    TABLE 143. INDIA LAST MILE DELIVERY MARKET, BY APPLICATION, 2021-2031 ($MILLION)
    TABLE 144. INDIA LAST MILE DELIVERY MARKET, BY DESTINATION, 2021-2031 ($MILLION)
    TABLE 145. AUSTRALIA LAST MILE DELIVERY MARKET, BY SERVICE, 2021-2031 ($MILLION)
    TABLE 146. AUSTRALIA LAST MILE DELIVERY MARKET, BY VEHICLE TYPE, 2021-2031 ($MILLION)
    TABLE 147. AUSTRALIA LAST MILE DELIVERY MARKET, BY MODE OF OPERATION, 2021-2031 ($MILLION)
    TABLE 148. AUSTRALIA LAST MILE DELIVERY MARKET, BY DELIVERY MODE, 2021-2031 ($MILLION)
    TABLE 149. AUSTRALIA LAST MILE DELIVERY MARKET, BY APPLICATION, 2021-2031 ($MILLION)
    TABLE 150. AUSTRALIA LAST MILE DELIVERY MARKET, BY DESTINATION, 2021-2031 ($MILLION)
    TABLE 151. SOUTH KOREA LAST MILE DELIVERY MARKET, BY SERVICE, 2021-2031 ($MILLION)
    TABLE 152. SOUTH KOREA LAST MILE DELIVERY MARKET, BY VEHICLE TYPE, 2021-2031 ($MILLION)
    TABLE 153. SOUTH KOREA LAST MILE DELIVERY MARKET, BY MODE OF OPERATION, 2021-2031 ($MILLION)
    TABLE 154. SOUTH KOREA LAST MILE DELIVERY MARKET, BY DELIVERY MODE, 2021-2031 ($MILLION)
    TABLE 155. SOUTH KOREA LAST MILE DELIVERY MARKET, BY APPLICATION, 2021-2031 ($MILLION)
    TABLE 156. SOUTH KOREA LAST MILE DELIVERY MARKET, BY DESTINATION, 2021-2031 ($MILLION)
    TABLE 157. VIETNAM LAST MILE DELIVERY MARKET, BY SERVICE, 2021-2031 ($MILLION)
    TABLE 158. VIETNAM LAST MILE DELIVERY MARKET, BY VEHICLE TYPE, 2021-2031 ($MILLION)
    TABLE 159. VIETNAM LAST MILE DELIVERY MARKET, BY MODE OF OPERATION, 2021-2031 ($MILLION)
    TABLE 160. VIETNAM LAST MILE DELIVERY MARKET, BY DELIVERY MODE, 2021-2031 ($MILLION)
    TABLE 161. VIETNAM LAST MILE DELIVERY MARKET, BY APPLICATION, 2021-2031 ($MILLION)
    TABLE 162. VIETNAM LAST MILE DELIVERY MARKET, BY DESTINATION, 2021-2031 ($MILLION)
    TABLE 163. REST OF ASIA-PACIFIC LAST MILE DELIVERY MARKET, BY SERVICE, 2021-2031 ($MILLION)
    TABLE 164. REST OF ASIA-PACIFIC LAST MILE DELIVERY MARKET, BY VEHICLE TYPE, 2021-2031 ($MILLION)
    TABLE 165. REST OF ASIA-PACIFIC LAST MILE DELIVERY MARKET, BY MODE OF OPERATION, 2021-2031 ($MILLION)
    TABLE 166. REST OF ASIA-PACIFIC LAST MILE DELIVERY MARKET, BY DELIVERY MODE, 2021-2031 ($MILLION)
    TABLE 167. REST OF ASIA-PACIFIC LAST MILE DELIVERY MARKET, BY APPLICATION, 2021-2031 ($MILLION)
    TABLE 168. REST OF ASIA-PACIFIC LAST MILE DELIVERY MARKET, BY DESTINATION, 2021-2031 ($MILLION)
    TABLE 169. LAMEA LAST MILE DELIVERY MARKET, BY COUNTRY, 2021-2031 ($MILLION)
    TABLE 170. LAMEA LAST MILE DELIVERY MARKET, BY SERVICE, 2021-2031 ($MILLION)
    TABLE 171. LAMEA LAST MILE DELIVERY MARKET, BY VEHICLE TYPE, 2021-2031 ($MILLION)
    TABLE 172. LAMEA LAST MILE DELIVERY MARKET, BY MODE OF OPERATION, 2021-2031 ($MILLION)
    TABLE 173. LAMEA LAST MILE DELIVERY MARKET, BY DELIVERY MODE, 2021-2031 ($MILLION)
    TABLE 174. LAMEA LAST MILE DELIVERY MARKET, BY APPLICATION, 2021-2031 ($MILLION)
    TABLE 175. LAMEA E-COMMERCE LAST MILE DELIVERY MARKET, BY DELIVERY MODE, 2021-2031 ($MILLION)
    TABLE 176. LAMEA RETAIL & FMCG LAST MILE DELIVERY MARKET, BY DELIVERY MODE, 2021-2031 ($MILLION)
    TABLE 177. LAMEA HEALTHCARE LAST MILE DELIVERY MARKET, BY DELIVERY MODE, 2021-2031 ($MILLION)
    TABLE 178. LAMEA MAILS & PACKAGES LAST MILE DELIVERY MARKET, BY DELIVERY MODE, 2021-2031 ($MILLION)
    TABLE 179. LAMEA OTHERS LAST MILE DELIVERY MARKET, BY DELIVERY MODE, 2021-2031 ($MILLION)
    TABLE 180. LAMEA LAST MILE DELIVERY MARKET, BY DESTINATION, 2021-2031 ($MILLION)
    TABLE 181. LATIN AMERICA LAST MILE DELIVERY MARKET, BY SERVICE, 2021-2031 ($MILLION)
    TABLE 182. LATIN AMERICA LAST MILE DELIVERY MARKET, BY VEHICLE TYPE, 2021-2031 ($MILLION)
    TABLE 183. LATIN AMERICA LAST MILE DELIVERY MARKET, BY MODE OF OPERATION, 2021-2031 ($MILLION)
    TABLE 184. LATIN AMERICA LAST MILE DELIVERY MARKET, BY DELIVERY MODE, 2021-2031 ($MILLION)
    TABLE 185. LATIN AMERICA LAST MILE DELIVERY MARKET, BY APPLICATION, 2021-2031 ($MILLION)
    TABLE 186. LATIN AMERICA LAST MILE DELIVERY MARKET, BY DESTINATION, 2021-2031 ($MILLION)
    TABLE 187. MIDDLE EAST LAST MILE DELIVERY MARKET, BY SERVICE, 2021-2031 ($MILLION)
    TABLE 188. MIDDLE EAST LAST MILE DELIVERY MARKET, BY VEHICLE TYPE, 2021-2031 ($MILLION)
    TABLE 189. MIDDLE EAST LAST MILE DELIVERY MARKET, BY MODE OF OPERATION, 2021-2031 ($MILLION)
    TABLE 190. MIDDLE EAST LAST MILE DELIVERY MARKET, BY DELIVERY MODE, 2021-2031 ($MILLION)
    TABLE 191. MIDDLE EAST LAST MILE DELIVERY MARKET, BY APPLICATION, 2021-2031 ($MILLION)
    TABLE 192. MIDDLE EAST LAST MILE DELIVERY MARKET, BY DESTINATION, 2021-2031 ($MILLION)
    TABLE 193. AFRICA LAST MILE DELIVERY MARKET, BY SERVICE, 2021-2031 ($MILLION)
    TABLE 194. AFRICA LAST MILE DELIVERY MARKET, BY VEHICLE TYPE, 2021-2031 ($MILLION)
    TABLE 195. AFRICA LAST MILE DELIVERY MARKET, BY MODE OF OPERATION, 2021-2031 ($MILLION)
    TABLE 196. AFRICA LAST MILE DELIVERY MARKET, BY DELIVERY MODE, 2021-2031 ($MILLION)
    TABLE 197. AFRICA LAST MILE DELIVERY MARKET, BY APPLICATION, 2021-2031 ($MILLION)
    TABLE 198. AFRICA LAST MILE DELIVERY MARKET, BY DESTINATION, 2021-2031 ($MILLION)
    TABLE 199. A1 SAMEDAY DELIVERY SERVICE, INC.: KEY EXECUTIVES
    TABLE 200. A1 SAMEDAY DELIVERY SERVICE, INC.: COMPANY SNAPSHOT
    TABLE 201. A1 SAMEDAY DELIVERY SERVICE, INC.: PRODUCT PORTFOLIO
    TABLE 202. AMAZON.COM, INC.: KEY EXECUTIVES
    TABLE 203. AMAZON.COM, INC.: COMPANY SNAPSHOT
    TABLE 204. AMAZON.COM, INC.: OPERATING SEGMENTS
    TABLE 205. AMAZON.COM, INC.: PRODUCT PORTFOLIO
    TABLE 206. AMAZON.COM, INC.: NET SALES, 2019–2021 ($MILLION)
    TABLE 207. AMAZON.COM, INC.: KEY STRATEGIC MOVES AND DEVELOPMENTS
    TABLE 208. ARAMEX: KEY EXECUTIVES
    TABLE 209. ARAMEX: COMPANY SNAPSHOT
    TABLE 210. ARAMEX: OPERATING SEGMENTS
    TABLE 211. ARAMEX: PRODUCT PORTFOLIO
    TABLE 212. ARAMEX: NET SALES, 2019–2021 ($MILLION)
    TABLE 213. ARAMEX: KEY STRATEGIC MOVES AND DEVELOPMENTS
    TABLE 214. BEST INC.: KEY EXECUTIVES
    TABLE 215. BEST INC.: COMPANY SNAPSHOT
    TABLE 216. BEST INC.: OPERATING SEGMENTS
    TABLE 217. BEST INC.: PRODUCT PORTFOLIO
    TABLE 218. BEST INC.: R&D EXPENDITURE, 2018–2020 ($MILLION)
    TABLE 219. BEST INC.: NET SALES, 2018–2020 ($MILLION)
    TABLE 220. BEST INC.: KEY STRATEGIC MOVES AND DEVELOPMENTS
    TABLE 221. C.H. ROBINSON WORLDWIDE, INC.: KEY EXECUTIVES
    TABLE 222. C.H. ROBINSON WORLDWIDE, INC.: COMPANY SNAPSHOT
    TABLE 223. C.H. ROBINSON WORLDWIDE, INC.: OPERATING SEGMENTS
    TABLE 224. C.H. ROBINSON WORLDWIDE, INC.: PRODUCT PORTFOLIO
    TABLE 225. C.H. ROBINSON WORLDWIDE, INC.: NET SALES, 2019–2021 ($MILLION)
    TABLE 226. C.H. ROBINSON WORLDWIDE, INC.: REVENUE SHARE BY REGION, 2021 (%)
    TABLE 227. C.H. ROBINSON WORLDWIDE, INC.: KEY STRATEGIC MOVES AND DEVELOPMENTS
    TABLE 228. DEUTSCHE POST AG (DHL GROUP): KEY EXECUTIVES
    TABLE 229. DEUTSCHE POST AG (DHL GROUP): COMPANY SNAPSHOT
    TABLE 230. DEUTSCHE POST AG (DHL GROUP): OPERATING SEGMENTS
    TABLE 231. DEUTSCHE POST AG (DHL GROUP): PRODUCT PORTFOLIO
    TABLE 232. DEUTSCHE POST AG (DHL GROUP): NET SALES, 2019–2021 ($MILLION)
    TABLE 233. DEUTSCHE POST AG (DHL GROUP): KEY STRATEGIC MOVES AND DEVELOPMENTS
    TABLE 234. DROPOFF, INC: KEY EXECUTIVES
    TABLE 235. DROPOFF, INC: COMPANY SNAPSHOT
    TABLE 236. DROPOFF, INC: PRODUCT PORTFOLIO
    TABLE 237. DROPOFF, INC: KEY STRATEGIC MOVES AND DEVELOPMENTS
    TABLE 238. DSV: KEY EXECUTIVES
    TABLE 239. DSV: COMPANY SNAPSHOT
    TABLE 240. DSV: OPERATING SEGMENTS
    TABLE 241. DSV: PRODUCT PORTFOLIO
    TABLE 242. DSV: NET SALES, 2019–2021 ($MILLION)
    TABLE 243. DSV: KEY STRATEGIC MOVES AND DEVELOPMENTS
    TABLE 244. DRONE DELIVERY CANADA: KEY EXECUTIVES
    TABLE 245. DPD GROUP: COMPANY SNAPSHOT
    TABLE 246. DPD GROUP: PRODUCT PORTFOLIO
    TABLE 247. DPD GROUP: KEY STRATEGIC MOVES AND DEVELOPMENTS
    TABLE 248. DRONE DELIVERY CANADA: KEY EXECUTIVES
    TABLE 249. DRONE DELIVERY CANADA: SNAPSHOT
    TABLE 250. DRONE DELIVERY CANADA: PRODUCT PORTFOLIO
    TABLE 251. DRONE DELIVERY CANADA: KEY STRATEGIC MOVES AND DEVELOPMENTS
    TABLE 252. FEDEX : KEY EXECUTIVES
    TABLE 253. FEDEX: COMPANY SNAPSHOT
    TABLE 254. FEDEX: OPERATING SEGMENTS
    TABLE 255. FEDEX: PRODUCT PORTFOLIO
    TABLE 256. FEDEX: NET SALES, 2019–2021 ($MILLION)
    TABLE 257. FEDEX: KEY STRATEGIC MOVES AND DEVELOPMENTS
    TABLE 258. FLIRTEY (SKYDROP): SNAPSHOT
    TABLE 259. FLIRTEY (SKYDROP): PRODUCT PORTFOLIO
    TABLE 260. FLIRTEY (SKYDROP): KEY STRATEGIC MOVES AND DEVELOPMENTS
    TABLE 261. FLYTREX INC.: COMPANY SNAPSHOT
    TABLE 262. FLYTREX INC.: PRODUCT PORTFOLIO
    TABLE 263. FLYTREX INC.: KEY STRATEGIC MOVES AND DEVELOPMENTS
    TABLE 264. GEODIS: KEY EXECUTIVES
    TABLE 265. GEODIS: COMPANY SNAPSHOT
    TABLE 266. GEODIS: PRODUCT PORTFOLIO.
    TABLE 267. GEODIS: NET SALES, 2019–2021 ($MILLION)
    TABLE 268. GEODIS: KEY STRATEGIC MOVES AND DEVELOPMENTS
    TABLE 269. JET DELIVERY, INC.: KEY EXECUTIVES
    TABLE 270. JET DELIVERY, INC.: COMPANY SNAPSHOT
    TABLE 271. JET DELIVERY, INC.: PRODUCT PORTFOLIO
    TABLE 272. KERRY LOGISTICS NETWORK LIMITED: KEY EXECUTIVES
    TABLE 273. KERRY LOGISTICS NETWORK LIMITED.: COMPANY SNAPSHOT
    TABLE 274. KERRY LOGISTICS NETWORK LIMITED.: OPERATING SEGMENTS
    TABLE 275. KERRY LOGISTICS NETWORK LIMITED.: PRODUCT PORTFOLIO
    TABLE 276. KERRY LOGISTICS NETWORK LIMITED.: NET SALES, 2019–2021 ($MILLION)
    TABLE 277. CATERPILLAR INC.: KEY EXECUTIVES
    TABLE 278. CATERPILLAR INC.: COMPANY SNAPSHOT
    TABLE 279. CATERPILLAR: OPERATING SEGMENTS
    TABLE 280. MARBLE ROBOT: PRODUCT PORTFOLIO
    TABLE 281. CATERPILLAR: R&D EXPENDITURE, 2019–2021 ($MILLION)
    TABLE 282. CATERPILLAR: NET SALES, 2019–2021 ($MILLION)
    TABLE 283. MATTERNET: COMPANY SNAPSHOT
    TABLE 284. MATTERNET: PRODUCT PORTFOLIO
    TABLE 285. MATTERNET: KEY STRATEGIC MOVES AND DEVELOPMENTS
    TABLE 286. POWER LINK EXPEDITE CORPORATION: KEY EXECUTIVES
    TABLE 287. POWER LINK EXPEDITE CORPORATION: COMPANY SNAPSHOT
    TABLE 288. POWER LINK EXPEDITE CORPORATION: PRODUCT PORTFOLIO
    TABLE 289. RELAY ROBOTICS, INC.: KEY EXECUTIVES
    TABLE 290. RELAY ROBOTICS, INC.: COMPANY SNAPSHOT
    TABLE 291. RELAY ROBOTICS, INC.: PRODUCT PORTFOLIO
    TABLE 292. SF HOLDING: KEY EXECUTIVES
    TABLE 293. SF HOLDING: COMPANY SNAPSHOT
    TABLE 294. SF HOLDING: OPERATING SEGMENTS
    TABLE 295. SF HOLDING: PRODUCT PORTFOLIO
    TABLE 296. SF HOLDING: R&D EXPENDITURE, 2019–2021 ($MILLION)
    TABLE 297. SF HOLDING: NET SALES, 2019–2021 ($MILLION)
    TABLE 298. SF HOLDING: KEY STRATEGIC MOVES AND DEVELOPMENTS
    TABLE 299. UNITED PARCEL SERVICE, INC. (UPS): KEY EXECUTIVES
    TABLE 300. UNITED PARCEL SERVICE, INC. (UPS): COMPANY SNAPSHOT
    TABLE 301. UNITED PARCEL SERVICE, INC. (UPS): OPERATING SEGMENTS
    TABLE 302. UNITED PARCEL SERVICE (UPS): PRODUCT PORTFOLIO
    TABLE 303. UNITED PARCEL SERVICE, INC. (UPS): NET SALES, 2019–2021 ($MILLION)
    TABLE 304. UNITED PARCEL SERVICE, INC. (UPS): KEY STRATEGIC MOVES AND DEVELOPMENTS
    TABLE 305. YTO EXPRESS HOLDINGS LIMITED: KEY EXECUTIVES
    TABLE 306. YTO EXPRESS HOLDINGS LIMITED: COMPANY SNAPSHOT
    TABLE 307. YTO EXPRESS HOLDINGS LIMITED: OPERATING SEGMENTS
    TABLE 308. YTO EXPRESS HOLDINGS LIMITED: PRODUCT PORTFOLIO
    TABLE 309. YTO EXPRESS HOLDINGS LIMITED: NET SALES, 2019–2021 ($MILLION)
    TABLE 310. USA COURIERS, INC: KEY EXECUTIVES
    TABLE 311. USA COURIERS, INC: COMPANY SNAPSHOT
    TABLE 312. USA COURIERS, INC: PRODUCT PORTFOLIO
    TABLE 313. USA COURIERS, INC: KEY EXECUTIVES
    TABLE 314. USA COURIERS, INC: COMPANY SNAPSHOT
    TABLE 315. XPO LOGISTICS, INC.: OPERATING SEGMENTS
    TABLE 316. XPO LOGISTICS, INC.: PRODUCT PORTFOLIO
    TABLE 317. XPO LOGISTICS, INC.: KEY STRATEGIC MOVES AND DEVELOPMENTS
    TABLE 318. CARE TO BEAUTY: KEY EXECUTIVES
    TABLE 319. CARE TO BEAUTY: COMPANY SNAPSHOT
    TABLE 320. CARE TO BEAUTY: PRODUCT PORTFOLIO
    TABLE 321. DESERTCART: KEY EXECUTIVES
    TABLE 322. DESERTCART: COMPANY SNAPSHOT
    TABLE 323. DESERTCART: PRODUCT PORTFOLIO
    TABLE 324. FETCHR: KEY EXECUTIVES
    TABLE 325. FETCHR: COMPANY SNAPSHOT
    TABLE 326. FETCHR: PRODUCT PORTFOLIO
    TABLE 327. JAZP: KEY EXECUTIVES
    TABLE 328. JAZP: COMPANY SNAPSHOT
    TABLE 329. JAZP: PRODUCT PORTFOLIO
    TABLE 330. JEEBLY LLC: KEY EXECUTIVES
    TABLE 331. JEEBLY LLC: COMPANY SNAPSHOT
    TABLE 332. JEEBLY LLC: PRODUCT PORTFOLIO
  • LIST OF FIGURES

  • FIGURE 1.LAST MILE DELIVERY MARKET SEGMENTATION
    FIGURE 2.LAST MILE DELIVERY MARKET,2021-2031
    FIGURE 3.LAST MILE DELIVERY MARKET,2021-2031
    FIGURE 4. TOP INVESTMENT POCKETS, BY REGION
    FIGURE 5.PORTER FIVE-1
    FIGURE 6.PORTER FIVE-2
    FIGURE 7.PORTER FIVE-3
    FIGURE 8.PORTER FIVE-4
    FIGURE 9.PORTER FIVE-5
    FIGURE 10.TOP PLAYER POSITIONING
    FIGURE 11.LAST MILE DELIVERY MARKET:DRIVERS, RESTRAINTS AND OPPORTUNITIES
    FIGURE 12.LAST MILE DELIVERY MARKET,BY SERVICE TYPE,2021(%)
    FIGURE 13.COMPARATIVE SHARE ANALYSIS OF BUSINESS-TO-BUSINESS (B2B) LAST MILE DELIVERY MARKET,2021-2031(%)
    FIGURE 14.COMPARATIVE SHARE ANALYSIS OF BUSINESS-TO-CONSUMER (B2C) LAST MILE DELIVERY MARKET,2021-2031(%)
    FIGURE 15.COMPARATIVE SHARE ANALYSIS OF CUSTOMER-TO-CUSTOMER (C2C) LAST MILE DELIVERY MARKET,2021-2031(%)
    FIGURE 16.LAST MILE DELIVERY MARKET,BY VEHICLE TYPE,2021(%)
    FIGURE 17.COMPARATIVE SHARE ANALYSIS OF MOTORCYCLE LAST MILE DELIVERY MARKET,2021-2031(%)
    FIGURE 18.COMPARATIVE SHARE ANALYSIS OF LCV LAST MILE DELIVERY MARKET,2021-2031(%)
    FIGURE 19.COMPARATIVE SHARE ANALYSIS OF HCV LAST MILE DELIVERY MARKET,2021-2031(%)
    FIGURE 20.COMPARATIVE SHARE ANALYSIS OF DRONES LAST MILE DELIVERY MARKET,2021-2031(%)
    FIGURE 21.LAST MILE DELIVERY MARKET,BY MODE OF OPERATION,2021(%)
    FIGURE 22.COMPARATIVE SHARE ANALYSIS OF NON-AUTONOMOUS LAST MILE DELIVERY MARKET,2021-2031(%)
    FIGURE 23.COMPARATIVE SHARE ANALYSIS OF AUTONOMOUS LAST MILE DELIVERY MARKET,2021-2031(%)
    FIGURE 24.LAST MILE DELIVERY MARKET,BY DELIVERY MODE,2021(%)
    FIGURE 25.COMPARATIVE SHARE ANALYSIS OF REGULAR DELIVERY LAST MILE DELIVERY MARKET,2021-2031(%)
    FIGURE 26.COMPARATIVE SHARE ANALYSIS OF SAME-DAY DELIVERY OR EXPRESS DELIVERY LAST MILE DELIVERY MARKET,2021-2031(%)
    FIGURE 27.LAST MILE DELIVERY MARKET,BY APPLICATION,2021(%)
    FIGURE 28.COMPARATIVE SHARE ANALYSIS OF E COMMERCE LAST MILE DELIVERY MARKET,2021-2031(%)
    FIGURE 29.COMPARATIVE SHARE ANALYSIS OF RETAIL AND FMCG LAST MILE DELIVERY MARKET,2021-2031(%)
    FIGURE 30.COMPARATIVE SHARE ANALYSIS OF HEALTHCARE LAST MILE DELIVERY MARKET,2021-2031(%)
    FIGURE 31.COMPARATIVE SHARE ANALYSIS OF MAILS AND PACKAGES LAST MILE DELIVERY MARKET,2021-2031(%)
    FIGURE 32.COMPARATIVE SHARE ANALYSIS OF OTHERS LAST MILE DELIVERY MARKET,2021-2031(%)
    FIGURE 33.LAST MILE DELIVERY MARKET,BY DESTINATION,2021(%)
    FIGURE 34.COMPARATIVE SHARE ANALYSIS OF DOMESTIC LAST MILE DELIVERY MARKET,2021-2031(%)
    FIGURE 35.COMPARATIVE SHARE ANALYSIS OF INTERNATIONAL LAST MILE DELIVERY MARKET,2021-2031(%)
    FIGURE 36.LAST MILE DELIVERY MARKET BY REGION,2021
    FIGURE 37.U.S. LAST MILE DELIVERY MARKET,2021-2031($MILLION)
    FIGURE 38.CANADA LAST MILE DELIVERY MARKET,2021-2031($MILLION)
    FIGURE 39.MEXICO LAST MILE DELIVERY MARKET,2021-2031($MILLION)
    FIGURE 40.U.K. LAST MILE DELIVERY MARKET,2021-2031($MILLION)
    FIGURE 41.GERMANY LAST MILE DELIVERY MARKET,2021-2031($MILLION)
    FIGURE 42.FRANCE LAST MILE DELIVERY MARKET,2021-2031($MILLION)
    FIGURE 43.RUSSIA LAST MILE DELIVERY MARKET,2021-2031($MILLION)
    FIGURE 44.SPAIN LAST MILE DELIVERY MARKET,2021-2031($MILLION)
    FIGURE 45.ITALY LAST MILE DELIVERY MARKET,2021-2031($MILLION)
    FIGURE 46.REST OF EUROPE LAST MILE DELIVERY MARKET,2021-2031($MILLION)
    FIGURE 47.CHINA LAST MILE DELIVERY MARKET,2021-2031($MILLION)
    FIGURE 48.JAPAN LAST MILE DELIVERY MARKET,2021-2031($MILLION)
    FIGURE 49.INDIA LAST MILE DELIVERY MARKET,2021-2031($MILLION)
    FIGURE 50.SOUTH KOREA LAST MILE DELIVERY MARKET,2021-2031($MILLION)
    FIGURE 51.AUSTRALIA LAST MILE DELIVERY MARKET,2021-2031($MILLION)
    FIGURE 52.VIETNAM LAST MILE DELIVERY MARKET,2021-2031($MILLION)
    FIGURE 53.REST OF ASIA-PACIFIC LAST MILE DELIVERY MARKET,2021-2031($MILLION)
    FIGURE 54.LATIN AMERICA LAST MILE DELIVERY MARKET,2021-2031($MILLION)
    FIGURE 55.MIDDLE EAST LAST MILE DELIVERY MARKET,2021-2031($MILLION)
    FIGURE 56.AFRICA LAST MILE DELIVERY MARKET,2021-2031($MILLION)
    FIGURE 57. TOP WINNING STRATEGIES, BY YEAR
    FIGURE 58. TOP WINNING STRATEGIES, BY DEVELOPMENT
    FIGURE 59. TOP WINNING STRATEGIES, BY COMPANY
    FIGURE 60.PRODUCT MAPPING OF TOP 10 PLAYERS
    FIGURE 61.COMPETITIVE DASHBOARD
    FIGURE 62.COMPETITIVE HEATMAP OF TOP 10 KEY PLAYERS
    FIGURE 63.A1 EXPRESS SERVICES INC..: NET SALES ,($MILLION)
    FIGURE 64.AMAZON.COM.: NET SALES ,($MILLION)
    FIGURE 65.ARAMEX.: NET SALES ,($MILLION)
    FIGURE 66.BEST INC.: NET SALES ,($MILLION)
    FIGURE 67.DB SCHENKER.: NET SALES ,($MILLION)
    FIGURE 68.DEUTSCHE POST AG (DHL GROUP).: NET SALES ,($MILLION)
    FIGURE 69.DPD.: NET SALES ,($MILLION)
    FIGURE 70.DRONE DELIVERY CANADA.: NET SALES ,($MILLION)
    FIGURE 71.DROPOFF, INC..: NET SALES ,($MILLION)
    FIGURE 72.DSV (DSV PANALPINA).: NET SALES ,($MILLION)
    FIGURE 73.FEDEX.: NET SALES ,($MILLION)
    FIGURE 74.FLIRTEY.: NET SALES ,($MILLION)
    FIGURE 75.FLYTREX.: NET SALES ,($MILLION)
    FIGURE 76.GEODIS.: NET SALES ,($MILLION)
    FIGURE 77.JET DELIVERY, INC..: NET SALES ,($MILLION)
    FIGURE 78.KERRY LOGISTICS NETWORK LIMITED.: NET SALES ,($MILLION)
    FIGURE 79.MARBLE ROBOT.: NET SALES ,($MILLION)
    FIGURE 80.MATTERNET.: NET SALES ,($MILLION)
    FIGURE 81.POWER LINK EXPEDITE.: NET SALES ,($MILLION)
    FIGURE 82.SAVIOKE.: NET SALES ,($MILLION)
    FIGURE 83.SF EXPRESS.: NET SALES ,($MILLION)
    FIGURE 84.UNITED PARCEL SERVICE, INC. (UPS).: NET SALES ,($MILLION)
    FIGURE 85.USA COURIERS.: NET SALES ,($MILLION)
    FIGURE 86.XPO LOGISTICS, INC..: NET SALES ,($MILLION)
    FIGURE 87.YTO EXPRESS GROUP CO..: NET SALES ,($MILLION)


This section provides the opinions of various top-level CXOs in the global autonomous last mile delivery market. According to the insights of the CXOs of leading companies, the current market trend & advancement in e-commerce industry to a much higher level and the use of better & more efficient product delivery service has increased across the globe. Furthermore, the last mile delivery service has gained prominence in the U.S., Canada, and China, owing to increase in inclination toward online shopping. For instance, e-commerce and last mile logistics tenants established a massive industrial space expansion in the U.S. in May 2019, with 272 million square feet of construction completed across 46 markets. The companies are also launching robot delivery services to more cities as demand for contactless last mile delivery has risen post-COVID-19 outbreak. Also, the adoption of autonomous delivery solutions such as drones & unmanned ground vehicles is growing at a faster pace and will lead to a rapid growth in the last mile delivery service in the near future. As per the industry experts, a growth of 20% is projected in online retail share by 2023 followed by a 10% growth in the delivery processes, which is expected to supplement the use of autonomous means to deliver the packages; thus, boosting the last mile delivery market in the near future.

The introduction of different techniques such as aerial delivery drones, ground delivery bots, and self-driving trucks and vans through which products and services can be delivered to the customers boost the growth of the last mile delivery market. Various companies operating in the delivery service have made several innovations to deliver the products to the customers in a shorter time. For instance, in November 2019, DPD France, a subsidiary of DPD Group expanded its business in the form of drone-based parcel delivery on a second regular commercial line in Isère (South-East of France). The drones included in this delivery process involves a mobile terminal installed directly in a delivery vehicle guaranteeing safe drone take-off and landing.

In the current scenario, the regional governments have played a vital role in driving the last mile delivery market by considering last mile delivery system to be the efficient means to deliver products in distant areas. For instance, Zipline along with the African government support has started the drone delivery service in Ghana & Rwanda in the field of healthcare & pharmacy for delivering blood and medicines on demand. Various other innovations have been carried out by companies such as Amazon to provide better & more efficient product delivery service.

The market growth is supplemented by development of e-commerce industry, increase in trading activities due to globalization, technological advancements in delivery vehicles, and increase in demand for fast delivery of packages. However, poor infrastructure & higher logistics costs, lack of control of manufacturers and retailers on logistics service, and imprecise postal address system is expected to hamper the growth of the market. Further, the adoption autonomous delivery to reinforce the demand, cost cutting & lead time reduction due to adoption of multi-modal system, and growing e-commerce industry coupled with rise in B2C deliveries is expected to create numerous opportunities for the growth and expansion of the last mile delivery market.

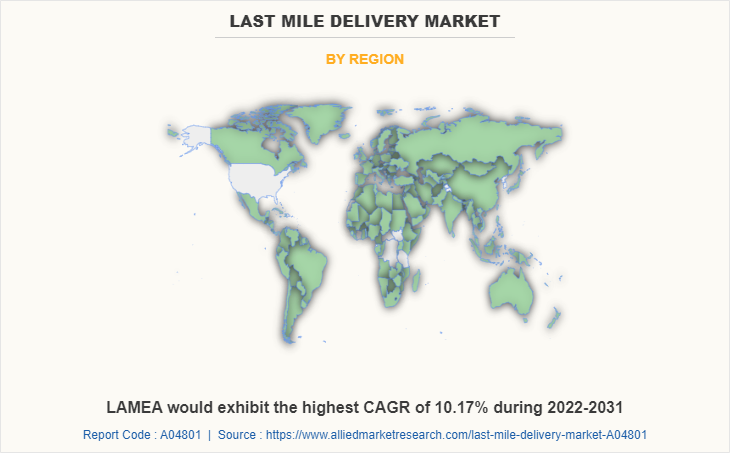
Among the analyzed regions, Asia-Pacific is the highest revenue contributor, followed by Europe, LAMEA and North America. On the basis of forecast analysis, LAMEA is expected to lead during the forecast period, due to increase in demand for last mile delivery services in developing countries across the LAMEA.

PURCHASE OPTIONS

Call or Email us

U.S.-Canada Toll-free: +1-800-792-5285
Int'l : +1-503-894-6022
Europe : +44-845-528-1300
Email : help@alliedmarketresearch.com
 
FREQUENTLY ASKED QUESTIONS?

A. Introduction of autonomous last mile delivery services & autonomous delivery mode are the upcoming trends of Last Mile Delivery Market.

A. Application in B2C & C2C services are the leading application of Last Mile Delivery Market

A. Asia-Pacific is the largest regional market for Last Mile Delivery

A. The global Last Mile Delivery Market was valued at $131.52 billion in 2021, and is projected to reach $288.87 billion by 2031, registering a CAGR of 8.13%.

A. Top companies operating in the industry are A1 Express Services Inc., Amazon.com, Aramex, BEST Inc., DB Schenker, Deutsche Post AG (DHL GROUP), DPD, Drone Delivery Canada and others

Looking for Customization?

 Customization Request

Have a Question?

 Speak with Analyst

Any Confusion?

 Inquire Before Buying

Have a glance of the Report

  Request Sample
RELATED TAGS

Purchase Full Report of
Last Mile Delivery Market

Start reading instantly.
This Report and over 67,112+ more Reports, Available with Avenue Library. T&C*.

  • Online Only
  • $3,456
  • Online cloud access only
  • Restricted print, copy, paste & download
  • Read only
  • Free industry update
    (Within 180 days)
  • Free report update in next update cycle
    (Jun 2023 - Jun 2024)
  • Data Pack
  • $3,840
  • Restricted to one authorized user
  • One print only
  • Available in
    Excel
  • Free industry update
    (Within 180 days)
  •   Free report update in next update cycle
    (Jun 2023 - Jun 2024)
  • Single User
  • $5,769
  • Restricted to one authorized user
  • One print only
  • Available in
    PDF
  • Free industry update
    (Within 180 days)
  •   Free report update in next update cycle
    (Jun 2023 - Jun 2024)
  • Five Users
  • $6,450
  • Limited to five authorized users
  • Print upto five copies
  • Available in
    PDF
  • Free industry update
    (Within 180 days)
  •   Free report update in next update cycle
    (Jun 2023 - Jun 2024)
  • Enterprise
    License/PDF

  • $10,995
  • Unlimited
    within
    company/enterprise
  • Available in Excel & PDF
  • Free industry update
    (Within 180 days)
  •   Free report update in next update cycle
    (Jun 2023 - Jun 2024)
  • Library
    Membership

  • $999 $ 1,175
    Per User/ Per month/ Billed annually
  • Published Content
    E-access
  • Company Profiles
    E-access
  • Newly Added Content Access
  • 10 PDF
    Downloads
  • 5 Excel Data
    Pack Downloads
  • 250 Company Profiles PDF Downloads
  • Buy Now

*Taxes/Fees, if applicable will be added during checkout. All prices in USD

RELATED REPORTS
 

Why Allied Market Research?


Infallible Methodology

To ensure high-level data integrity, accurate analysis, and impeccable forecasts

Analyst Support

For complete satisfaction

Customization

On-demand customization of scope of the report to exactly meet your needs

TARGETED MARKET VIEW

Targeted market view to provide pertinent information and save time of readers

Get fresh content delivered

Get insights on topics that are crucial for your business. Stay abreast of your interest areas.

Get Industry Data Alerts

Why Allied Market Research?

Infallible Methodology

To ensure high-level data integrity, accurate analysis, and impeccable forecasts

Analyst Support

For complete satisfaction

Customization

On-demand customization of scope of the report to exactly meet your needs

TARGETED MARKET VIEW

Targeted market view to provide pertinent information and save time of readers