
Lifeboat Market Research, 2033
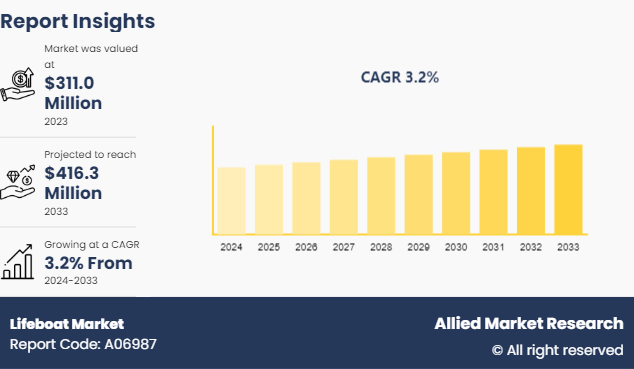
The global lifeboat market size was valued at $311.0 million in 2023, and is projected to reach $416.3 million by 2033, growing at a CAGR of 3.2% from 2024 to 2033.
Market Introduction and Definition
Lifeboats are intended to give a way of escape and survival in emergency scenarios such as fires, floods, or ship sinkings. Lifeboats are small, rigid, or inflatable vessels. They give sanctuary from open water conditions, increasing the chances of survival for passengers and crew after abandoning an unseaworthy vessel. The expanding offshore and maritime industries drive market expansion. Lifeboat technology advancements, such as the use of IoT (Internet of Things) devices for real-time monitoring, predictive maintenance systems, and data analytics to optimise lifeboat operation and maintain compliance with safety requirements, are driving the lifeboat industry.
According to government laws, every ship that goes on a voyage must carry lifeboats. The most recent trend in the lifeboat market is the use of novel technologies such as remote-controlled lifeboats and self-inflating lifeboats. The market is also expanding its product and service offerings by providing personalised lifeboat solutions to meet the unique demands of each customer. Furthermore, the rising demand for marine safety and security measures, the expansion of the offshore oil and gas sector, and the expanding need for search and rescue operations are all driving revenue growth in the lifeboat market share.
Key Takeaways
The lifeboat market study covers 20 countries. The research includes a segment analysis of each country in terms of value ($Million) for the projected period 2023-2032.
More than 1,500 product literatures, industry releases, annual reports, and other such documents of major lifeboat industry participants along with authentic industry journals, trade associations releases, and government websites have been reviewed for generating high-value industry insights.
The study integrated high-quality data, professional opinions and analysis, and critical independent perspectives. The research approach is intended to provide a balanced view of global markets and to assist stakeholders in making educated decisions in order to achieve their most ambitious growth objectives.
???Key Market Dynamics
The global lifeboat market is witnessing growth due to several factors such as increase in maritime safety regulations and growth in shipping and offshore industries. However, lack of awareness and training restrains the growth of the market. In addition, the growing demand for increased maritime defense power will provide lucrative growth opportunities for the market's development during the forecast period.
Governments and international organisations are increasingly implementing strict safety requirements to protect the safety of maritime operations. Compliance with these requirements mandates the deployment of improved lifeboats, which boosts market growth. The global expansion of the shipping sector, driven by international trade, demands more safety measures, such as lifeboats.

Market Segmentation
The lifeboat market is segmented into material type, type, and region. On the basis of material type, the market is divided into wooden, aluminum, steel, and FRP. On the basis of type, the market is segregated into partially enclosed, totally enclosed, and open lifeboat. Region wise, the market is analyzed across North America, Europe, Asia-Pacific, and LAMEA.
Regional/Country Market Outlook
North America is anticipated to have the largest share of the global lifeboat market size during the forecast period. North America is expected to lead the market due to strict safety requirements and a well-established maritime infrastructure. The U.S. is also a major contributor to the lifeboat market, owing to increased marine safety-related research and development initiatives. In the U.S., the sector is primarily driven by rising offshore oil and gas activities. The significant presence of prominent lifeboat manufacturers fuels lifeboat market growth.
The rise of new countries such as India, China, and others offers enormous opportunities for the lifeboat market. Countries around the globe are witnessing rising industrialization, infrastructural expansion, and offshore operations. As these regions' marine and offshore sectors grow, there is a greater demand for lifeboats and other safety equipment.?The incorporation of new technologies into lifeboat systems creates possibilities for innovation and market expansion. This involves the development of more efficient launching and recovery systems, innovative materials for increased durability, automation and remote monitoring capabilities, and improved safety features such as?self-righting and stability in harsh situations. The ongoing emphasis on safety requirements, as well as the necessity for dependable life-saving equipment, make the lifeboat market an appealing area for growth and innovation.
Competitive Landscape
The major players operating in the lifeboat market include Balden Marine, Hatecke GmbH, Nishi-F Co., Ltd., HLB ENG, Wartsila, Viking Life-Saving, Survitec Group Limited, Palfinger Marine, Vanguard, and Fassmer.
Other players in lifeboat market include Survival Systems International, Shigi, Jiangsu Jiaoyan, and so on.
Industry Trends
In April 2023, the Naval Air Warfare Centre Weapons granted $206.71 million contract to DynCorp International LLC for aircraft maintenance, SAR equipment, and support for the P-3 Orion, C-130 Hercules, E2D Hawkeye, F/A-18 Hornet, E/A-18 Growler, AV-8B Harrier II, and H-60 Sea Hawk aircraft supporting the Naval Test Wing Atlantic.
In 2022, there were?163 major floods worldwide, accounting for more than 50% of the total number of major natural disasters of the year.
According to Global Terrorism Index, the number of attacks increased by 17%, from 4, 458 in 2020 to 5, 226 in 2021, primarily owing to conflict in the Sahel region and instability in Afghanistan.
Regulatory Analysis of Global Lifeboat Market
International Maritime Organization (IMO) and SOLAS-
- SOLAS Convention
- The SOLAS Convention is a key international treaty governing the safety of merchant ships.
- Chapter III of SOLAS focuses on life-saving appliances and arrangements, such as lifeboats.
Lifeboat Requirements-
- Construction and Design: Lifeboats must be constructed to withstand harsh maritime conditions and must be capable of being launched rapidly.
- Capacity: Lifeboats must be able to accommodate all persons onboard, with additional capacity for a certain percentage.
- Equipment: Lifeboats must be equipped with a range of safety equipment, including distress signals, emergency rations, water, first-aid kits, and navigation tools.
- Maintenance: Regular maintenance and inspections are mandatory to ensure that lifeboats remain in operational condition. This includes checks on the hull integrity, engine functionality, and the condition of safety equipment.
- Launching and Retrieval Systems:
- Lifeboats must have reliable launching mechanisms that can be operated under adverse conditions.
- Davits (the systems used to lower and retrieve lifeboats) must be tested regularly to ensure they function correctly.
Drills and Training:
- Regular lifeboat drills are required to ensure that crew members are familiar with evacuation procedures.
- Crew training must cover the operation of lifeboats, including launching, navigation, and the use of onboard equipment.
- United States Coast Guard (USCG) - The USCG enforces lifeboat safety requirements for vessels operating in the U.S. seas. U.S.?standards frequently accord with SOLAS but may include extra obligations unique to U.S. maritime law.
- SOLAS Convention
European Union (EU) - The EU has established a number of directives and rules to ensure that marine safety standards are consistent throughout member states, frequently adopting or supplementing IMO norms.
In India, the Bureau of Energy Efficiency has introduced a rating system for electric vacuum pumps, mandating manufacturers to label their products with energy efficiency ratings and estimated annual energy costs.
China has adopted a mandatory three-level labeling system for electric vacuum pumps sold within its borders, providing consumers with details on product performance and estimated annual energy costs.
The Japan Automobile Manufacturers Association (JAMA) has implemented standards for electric vacuum pumps used in vehicles, requiring manufacturers to include information on product labels regarding energy efficiency ratings and estimated annual energy costs.
Key Sources Referred
National Ocean Industries Association
Occupational Safety and Health Administration
ANSI Organization
U.S. Department of Transportation
National Aeronautics and Space Administration
International Transport Forum
Maryland Department of Natural Resources
Key Benefits For Stakeholders
This report provides a quantitative analysis of the market segments, current trends, estimations, and dynamics of the market analysis from 2022 to 2032 to identify the prevailing lifeboat market opportunity.
The market research is offered along with information related to key drivers, restraints, and opportunities.
Porter's five forces analysis highlights the potency of buyers and suppliers to enable stakeholders make profit-oriented business decisions and strengthen their supplier-buyer network.
In-depth analysis of the lmarket segmentation assists to determine the prevailing market opportunities.
Major countries in each region are mapped according to their revenue contribution to the global lifeboat market forecast statistics.
Market player positioning facilitates benchmarking and provides a clear understanding of the present position of the market players.
The report includes the analysis of the regional as well as global lifeboat market trends, key players, market segments, application areas, and market growth strategies.
Lifeboat Market Report Highlights
| Aspects | Details |
| Market Size By 2033 | USD 416.3 Million |
| Growth Rate | CAGR of 3.2% |
| Forecast period | 2024 - 2033 |
| Report Pages | 324 |
| By Material Type |
|
| By Type |
|
| By Region |
|
| Key Market Players | Viking Life-Saving, Hatecke GmbH, Fassmer, Vanguard, Balden Marine, HLB ENG, Nishi-F Co., Ltd., Survitec Group Limited., Palfinger Marine, Wartsila |
The partially enclosed is the leading type of Lifeboat Market.
The upcoming trends of lifeboat market include increase in maritime safety regulations and growth in shipping and offshore industries.
North America is the largest regional market for lifeboat.
Balden Marine, Hatecke GmbH, Nishi-F Co., Ltd., HLB ENG, and Wartsila are the top companies to hold the market share in Lifeboat.
The lifeboat market was valued at $312 million in 2023.
Loading Table Of Content...

