
Liquid Fertilizers Market Summary
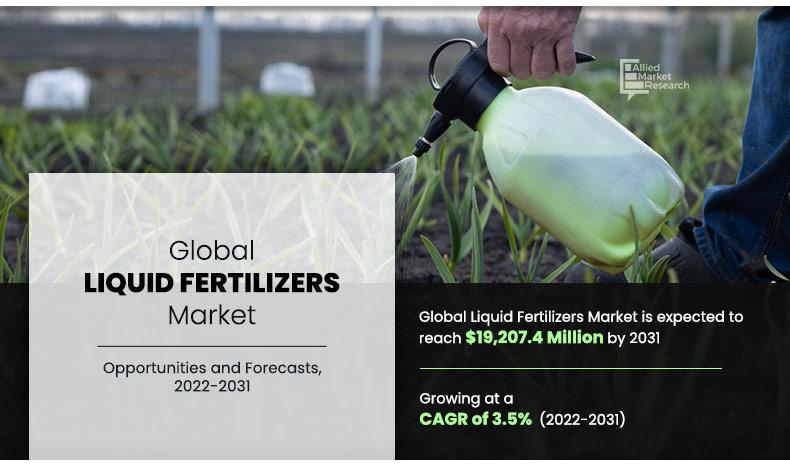
The global liquid fertilizers market size was valued at $12,569.5 million in 2020, and is projected to reach $19,207.4 million by 2031, registering a CAGR of 3.5% from 2022 to 2031.
Key Market Trends and Insights
Region wise, Asia-Pacific generated the highest revenue in 2020.
The global liquid fertilizers market share was dominated by the nitrogen segment in 2020 and is expected to maintain its dominance in the upcoming years
The organic segment is expected to witness the highest growth during the forecast
Market Size & Forecast
- 2020 Market Size: USD 12,569.5 Million
- 2031 Projected Market Size: USD 19,207.4 Million
- Compound Annual Growth Rate (CAGR) (2022-2031): 3.5%
- Asia-Pacific: Generated the highest revenue in 2020
Liquid fertilizers provide the required nutrients for plants at a specific time and in varied conditions. These fertilizers are expected to be absorbed by plants through leaf pores and roots. They are rich in growth hormones and micronutrients, hence, are widely used to grow crops, such as maize. They appear to act in the form of a catalyst, increasing a plant’s nutrient intake. Liquid fertilizers help in the rapid establishment of seedlings and an early growth in plants. Moreover, in the coming years, more food may be required to feed the growing human population; this highlights the importance of agriculture as it is the only means of mass food production for humans. Land is limited and the scope of bringing new lands under agriculture is less. On the contrary, available land for agriculture has decreased due to urbanization, soil erosion, and pollution. The only possible means to produce enough food for everyone is by increasing the yield per area of land. This is possible only by the judicious use of fertilizers coupled with other progressive farming techniques.
The emerging markets of Asia-Pacific, Latin America, and Africa provide immense growth opportunities for the liquid fertilizers industry. Countries such as India, China, Brazil, and Argentina have become ideal destinations for global fertilizer companies to establish manufacturing plants. Low labor costs and flexible government regulations are the main reasons for the emergence of these regions on the world fertilizer map. Many of these developing countries, such as India, are still agro-based economies i.e., the significant amount of share in the GDP is from the agriculture sector. Hence, it is becoming a highly investment opportunity for international fertilizer companies. Technological advancements due to this demand is expected to further increase the application scope of liquid fertilizers in the food industry. However, excessive use of fertilizers causes soil pollution and water pollution; the chemicals can even easily seep down into the water table. This polluted water eventually mixes with natural streams and lakes. Pollutants include high levels of NPK, heavy metals, and other micronutrients which are required by plants. One of the visible effects of such pollution is eutrophication, which is caused due to high levels of phosphates and nitrates. The growth in concern for the environment and increased awareness among farmers to adopt sustainable farming practices may limit the liquid fertilizers market growth.
Segment Overview
The global liquid fertilizers market is segmented based on type, production process, mode of application, crop, and geography. Based on type, it is divided into potassium, micronutrients, phosphate, and nitrogen. Based on production process, it is bifurcated into organic and synthetic. Based on application, the market is categorized into soil, fertigation, foliar, and others (aerial & starter solutions). Based on crop, it is classified into oil seeds & pulses, fruits & vegetables, grains & cereals, and others. By region, the market is analyzed across North America, Europe, Asia-Pacific, and LAMEA.
By Type
Nitrogen segment dominates the global market and is expected to retain its dominance throughout the forecast period.
By Type
Based on type, the liquid fertilizers market is categorized into potassium, micronutrients, phosphate, and nitrogen. Nitrogen segment constitutes a major market share; however, the micronutrients segment is projected to experience growth at the highest CAGR during the market forecast period. Nitrogen plays a crucial role in promoting rapid vegetative growth and enhancing chlorophyll production, which has made it essential for crop development. Farmers across regions prefer nitrogen-based liquid fertilizers for their ease of application, quick absorption, and immediate impact on plant growth. Widespread use in cereals, oilseeds, and vegetables has contributed to an increase in market size in recent years. High demand for precision farming and fertigation practices further strengthens this segment in the global market.
By Production Process
Synthetic segment is expected to grow at a highest CAGR of 4.3% during the forecast period.
By Production Process
Based on production process, the liquid fertilizers market is divided into organic and synthetic. Organic segment leads in terms of market share and is expected to continue to grow with robust CAGR during the forecast period. Organic fertilizers are derived from animal matter, animal excreta, and vegetable matter (like crop residue). These fertilizers not only supply nutrients to the plant however also help in building & maintaining a rich soil ecosystem of earthworms and other micro organisms; they have very little environmental effects, unlike synthetic fertilizers.
By Mode Of Application
Fertigation segment is expected to grow at a highest CAGR of 4.9% during the forecast period.
By Application
On the basis of application, the liquid fertilizers market is categorized into soil, fertigation, foliar, and others. The fertigation segment held the major share in the market, and is projected to remain dominant during the forecast period. Fertigation allows direct and efficient nutrient delivery to plant roots via irrigation systems, improving nutrient absorption and minimizing losses. It ensures uniform application, supports crop-specific nutrient scheduling, and suits a variety of crops such as fruits, vegetables, and cereals. The rising adoption of drip and sprinkler systems, especially in water-scarce regions, has driven demand for this segment. The method aligns with precision agriculture trends and sustainable practices, encouraging its continued use across both large-scale commercial farms and smaller agricultural operations.
By Crop
Oilseeds And Pulses segment is expected to grow at a highest CAGR of 5.7% during the forecast period.
By Crop
Based on crop, it is classified into oil seeds & pulses, fruits & vegetables, grains & cereals, and others. Grains & cereals segment constitute a major market share; however, the fruits & vegetables segment is projected to experience growth at the highest CAGR during the liquid fertilizers market forecast period. Grains and cereals, including wheat, rice, and corn, are staple crops with extensive global cultivation, driving high fertilizer demand. These crops require substantial nitrogen, phosphorus, and potassium inputs throughout their growth cycle, making liquid fertilizers a preferred option for fast and uniform nutrient delivery. The segment benefits from large-scale farming practices and increasing adoption of mechanized and precision agriculture. Government subsidies and food security policies further support fertilizer use in this segment, driving its leading position in the market.
By Region
Asia-Pacific dominates the market and is expected to grow with a CAGR of 2.3% during the forecast period
By Region
Region wise, the Asia-Pacific dominated the liquid fertilizer market in 2020 and is anticipated to maintain its dominance during the forecast period. The continued regional dominance reflects a growth in preference for efficient nutrient delivery systems aimed at improving crop productivity on limited farmland. Increased adoption of liquid fertilizers in China, India, and Southeast Asian countries is supported by modern irrigation practices, government subsidies for sustainable agriculture, and the need for fast nutrient absorption in high-demand crops. Furthermore, rising awareness among farmers also supports consistent market expansion in Asia-Pacific region in recent years.
Competition Analysis
Key market players in this liquid fertilizers market are Agrium Incorporated, AgroLiquid, Haifa Chemicals Ltd., Israel Chemical Ltd. (ICL), Kugler Company, Rural Liquid Fertilizers (RLF), Yara International ASA, Compo Expert GmbH, and K+S Aktiengesellschaft. Rural Liquid Fertilizers (RLF), Yara International ASA, Compo Expert GmbH, and K+S Aktiengesellschaft are investing in product innovation and expanding production capacity to meet rising global demand. Companies are developing crop-specific and environmentally friendly formulations to support sustainable agriculture. Strategic collaborations with agri-tech firms, digital agriculture platforms, and distribution partners are enhancing market penetration. Many are also focusing on research and development to improve nutrient efficiency and reduce application costs. Expansion into emerging markets through regional partnerships and localized production is also a key strategy to strengthen global presence and boost market growth.
Key Benefits for Stakeholders
This report provides a quantitative analysis of the market segments, current trends, estimations, and dynamics of the liquid fertilizers market analysis from 2020 to 2031 to identify the prevailing market opportunities.
The market research is offered along with information related to key drivers, restraints, and liquid fertilizers market opportunities.
Porter’s five forces analysis highlights the potency of buyers and suppliers to enable stakeholders make profit-oriented business decisions and strengthen their supplier–buyer network.
In-depth analysis of the liquid fertilizers market segmentation assists to determine the prevailing market opportunities.
Major countries in each region are mapped according to their revenue contribution to the global market industry.
Market player positioning facilitates benchmarking and provides a clear understanding of the present position of the market players.
The report includes the analysis of the regional as well as global liquid fertilizers market trends, key players, market segments, application areas, and market growth strategies.
Liquid Fertilizers Market Report Highlights
| Aspects | Details |
| By Type |
|
| By Production Process |
|
| By Mode of Application |
|
| By Crop |
|
| By Region |
|
Analyst Review
Liquid fertilizers are preferred over conventional fertilizers as they possess the ability to mix rapidly with the soil, thereby increasing crop yields. Moreover, the nitrogen segment accounted for the highest market share in 2020, due to the degradation of soil quality, which causes micronutrient deficiency in crops.
Liquid fertilizers have gained popularity in the recent years, owing to surge in application, leading to three to four fold increase in crop production. In addition, rise in hydroponic system field areas and easy availability of fertilizers at lower & subsidized rates encourage the farmers to effectively use liquid fertilizer sprayers. Moreover, globalization drives the mergers and acquisitions of the world’s leading producers, as they have increasingly focused their efforts on selling their products to fast-growing developing countries. Collaborations and acquisitions are the key strategies followed by market players to sustain in the intense competitive industry.
The Asia-Pacific liquid fertilizers market offers lucrative opportunities for key manufacturers, owing to growth of agriculture industry to cater to the growth in food demands. In addition, the fruits & vegetables crop segment is expected to exhibit high potential due to continuous technological advancements and raised demands. Furthermore, investment initiatives by the government and private manufacturers surge development activities and new product developments, thus boosting the market growth.
The global liquid fertilizers market size was valued at $12,569.5 million in 2020, and is projected to reach $19,207.4 million by 2031
The global Liquid Fertilizers market is projected to grow at a compound annual growth rate of 3.5% from 2022 to 2031 $19,207.4 million by 2031
Key market players in this liquid fertilizers market are Agrium Incorporated, AgroLiquid, Haifa Chemicals Ltd., Israel Chemical Ltd. (ICL), Kugler Company, Rural Liquid Fertilizers (RLF), Yara International ASA, Compo Expert GmbH, and K+S Aktiengesellschaft
Based on region, the market across Asia-Pacific held the lion’s share in 2020
Significant growth in investment in the agriculture sector, availability of low labor costs, flexible government regulations, and rise in importance of agriculture as the only mean of mass production for the growing population are expected to drive the growth of the global liquid fertilizers market
Loading Table Of Content...

