
Load Balancer Market Overview
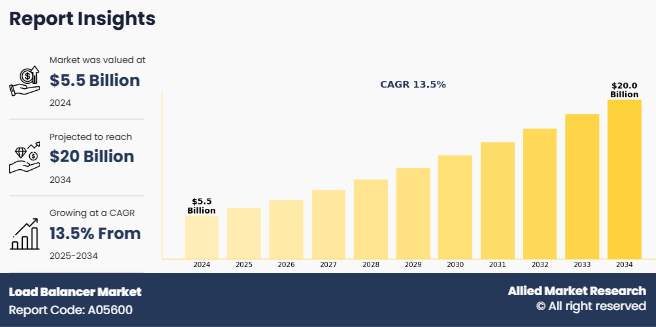
The load balancer market was valued at USD 5.5 billion in 2024 and is estimated to reach USD 20 billion by 2034, exhibiting a CAGR of 13.5% from 2025 to 2034.
An increase in cloud adoption across industries is driving load balancer market growth. As businesses move their applications and data to cloud platforms, they need reliable solutions to manage heavy and unpredictable traffic. Load balancers help distribute workloads across multiple cloud servers, ensuring better performance, security, and uptime. Industries like banking, healthcare, retail, and education are increasingly using cloud services, boosting the demand for efficient load balancing solutions.
Key Market Insights
By component, the software segment held the largest share in the load balancer market for 2024.
By type, the local load balancer segment held the largest share in the load balancer market for 2024.
By deployment, the cloud segment held the largest share in the load balancer market for 2024.
By enterprise size, the large enterprises segment held the largest share in the load balancer market for 2024.
By Industry Vertical, the BFSI segment held the largest share in the load balancer market for 2024.
Region-wise, Asia-Pacific is expected to witness the highest CAGR during the forecast period.
Market Size & Forecast
- 2034 Projected Market Size: USD 20 Billion
- 2024 Market Size: USD 5.5 Billion
- Compound Annual Growth Rate (CAGR) (2025-2034): 13.5%
How to Describe Load Balancer
A load balancer is a device, software, or service that evenly distributes incoming network traffic across multiple servers, systems, or resources. Its main purpose is to prevent any single server from being overwhelmed, ensuring high availability, better performance, and reliability of applications. Load balancers monitor the health of servers continuously and can automatically reroute traffic if a server becomes unavailable or slow. They can work at different levels, such as the network layer (Layer 4) or the application layer (Layer 7), directing traffic based on various factors like IP address, content type, or session information. Commonly used in cloud environments, enterprise networks, and data centers, load balancers help optimize resource use, minimize response times, and provide seamless service to users.
The global load balancer market is growing due to the increase in internet traffic and connected devices. More people are using smartphones, laptops, tablets, and smart home devices, all of which require a stable and fast internet connection. Businesses also depend on online platforms for shopping, banking, entertainment, and communication. As more users go online and more devices connect to the internet, servers face challenges in managing the heavy traffic, which fuels overall load balancer market growth.
In this context, a load balancer device plays a crucial role by distributing traffic across multiple servers to prevent any single server from becoming overloaded. This ensures websites and applications run efficiently and without interruptions. Companies deploy load balancer devices to maintain high availability, speed, and reliability of their digital services, allowing them to handle millions of users simultaneously. These devices help avoid crashes and downtime during peak usage. However, concerns over security in cloud-based load balancers are hampering market growth, as organizations remain wary of potential data breaches, unauthorized access, and limited control over sensitive information in virtual environments.
Load Balancer Market Segment Review
The load balancer market is segmented on the basis of component, type, application, deployment, enterprise size, industry vertical and region. By component, it is divided into hardware, software and services. By type, it is classified into local load balancer and global load balancer. By deployment, it is bifurcated into on-premises and cloud. By enterprise size, it is segmented into large enterprise and small and medium enterprise. By industry vertical, it is segmented into BFSI, IT & Telecom, Retail, Government, Manufacturing, Media & Entertainment, Healthcare and others. By region, it is classified into North America, Europe, Asia-Pacific and LAMEA.
On the basis of component, it is segmented into hardware, software and services. The global load balancer market share was dominated by the hardware segment in 2024, This is attributed to the growing adoption of virtualized and cloud environments, where software-based load balancers offer greater flexibility, scalability, and cost-efficiency. Businesses prefer software solutions due to easy integration with cloud platforms, simplified deployment, and advanced features like traffic analytics, automation, and centralized control, which support modern IT infrastructure needs.

However, the services segment is expected to register the highest CAGR during the forecast period. This is attributed to the rising need for expert guidance in implementing and managing load balancing systems. As networks become more complex, companies rely on services for setup, maintenance, and troubleshooting, driving growth in professional and managed service offerings across industries.
On the basis of deployment, it is classified into on-premises and cloud. The cloud segment dominated the market share in 2024, owing to the widespread adoption of cloud services, growing need for scalable infrastructure, and rising use of remote applications. Cloud load balancers offer flexibility, fast deployment, and cost-effectiveness, making them ideal for businesses operating in dynamic, high-traffic digital environments.

However, the services segment is expected to register the highest CAGR during the forecast period. This growth is driven by the rising need for expert support in traffic management, low-latency performance, and compliance with security standards—particularly in highly regulated sectors such as healthcare, finance, and manufacturing.
What are the Top Impacting Factors in Market
Market Driver
Growth in E-Commerce and Online Banking Services
The increase in e-commerce and online banking services is significantly boosting load balancer market demand. As more people shop online and use banking apps, businesses must ensure their websites and services remain fast, secure, and highly available. Customers expect quick loading times and smooth transactions, whether purchasing products or managing finances. If a website or app slows down or crashes, it can result in lost sales and damaged trust. Load balancers address this issue by distributing internet traffic across multiple servers, preventing any single server from becoming overloaded. This ensures smooth service even during peak shopping periods or high banking traffic.
Moreover, load balancers enhance security by protecting sensitive information during online transactions. With the rapid rise in mobile shopping, digital payments, and internet-based financial services, the load balancer market size is expanding as companies invest in smarter traffic management solutions to meet evolving customer expectations. Even minor issues with website speed or safety can harm a brand’s reputation, making robust load balancing solutions essential. As digital transactions grow across sectors, the load balancer market size is projected to increase further, driven by the need for speed, reliability, and data protection.
Restraints
High Costs Associated with Advanced Load Balancing Solutions
High costs associated with advanced load balancing solutions are hampering the growth of the load balancer market share. While load balancers are very important for managing internet traffic and keeping services reliable, the most advanced solutions can be very expensive. Many businesses, especially small and medium-sized ones, find it difficult to afford these high-end systems. The cost is not just for buying the load balancer hardware or software but also includes installation, maintenance, regular updates, and training staff to manage the systems properly. Large companies may be able to afford top-level load balancers with advanced features like intelligent traffic management, automatic scaling, and strong security.
However, for small and medium sized companies, the high initial and ongoing costs are a major barrier. This pricing challenge is slowing down the wider adoption of load balancers, particularly among startups and businesses in emerging markets. Even though the need for load balancers is growing, the high costs is creating a gap in the load balancer industry and hampering its growth.
Opportunity
Growing Demand for AI And Machine Learning-Based Intelligent Load Balancing
The growing demand for AI and machine learning-based intelligent load balancing presents a strong load balancer market opportunity. As businesses handle increasing volumes of online traffic and more complex networks, traditional load balancing methods often fall short. Companies are now seeking smarter solutions that can adapt automatically to shifting traffic patterns, detect issues early, and optimize server performance in real time. According to recent load balancer market insights, AI and machine learning technologies are transforming load balancers into intelligent systems that learn from past traffic behavior and predict future needs without manual intervention.
These advanced platforms can quickly detect anomalies, prevent server overloads, and enhance security by identifying potential threats, thereby improving application performance and minimizing downtime. Industries such as e-commerce, finance, healthcare, and entertainment where fast, reliable digital services are critical are particularly drawn to these AI-driven solutions. With digital infrastructures becoming increasingly complex, the load balancer market forecast indicates a strong upward trend as businesses continue to adopt intelligent traffic management tools. This evolving landscape offers substantial growth potential for vendors developing innovative, AI-enhanced load balancing systems tailored to modern enterprise demands.
Which are the Leading Companies in Load Balancer
The following are the leading companies in the market. These players have adopted various strategies to increase their market penetration and strengthen their position in the load balancer industry.
Amazon Web Services, Inc.
Google LLC
Microsoft Corporation
F5, Inc.
Imperva Inc.
VMware
Fastly, Inc
Juniper Networks, Inc.
IBM Corporation
Oracle Corporation
Edgenexus Limited
Loadbalancer.org Inc.
HAProxy Technologies, LLC.
Netris, Inc.
Total Uptime Technologies, LLC.
Kemp Technologies, Inc
A10 Networks, Inc.
Array Networks, Inc.
Peplink Pepwave Limited
Huawei Cloud Computing Technologies Co., Ltd.
What Recent Key Developments have Emerged in the Load Balancer Market
In July 2024, Hewlett Packard Enterprise's Ezmeral division partnered with Loadbalancer.org to enhance the performance and reliability of HPE Ezmeral Data Fabric Software. This collaboration aims to optimize storage capabilities and improve user experience by integrating robust load balancing solutions.
In Februrary 2024, IBM introduced the NS1 Connect Global Server Load Balancer, aiming to revolutionize traditional load balancing by offering improved traffic distribution and application performance across global networks.
What are Key Benefits for Stakeholders
This report provides a quantitative analysis of the market segments, current trends, estimations, and dynamics of the load balancer market analysis from 2024 to 2034 to identify the prevailing load balancer market opportunities.
The market research is offered along with information related to key drivers, restraints, and opportunities.
Porter's five forces analysis highlights the potency of buyers and suppliers to enable stakeholders make profit-oriented business decisions and strengthen their supplier-buyer network.
In-depth analysis of the load balancer market segmentation assists to determine the prevailing market opportunities.
Major countries in each region are mapped according to their revenue contribution to the global market.
Market player positioning facilitates benchmarking and provides a clear understanding of the present position of the market players.
The report includes the analysis of the regional as well as global load balancer market trends, key players, market segments, application areas, and market growth strategies.
Load Balancer Market Report Highlights
| Aspects | Details |
| Market Size By 2034 | USD 20 billion |
| Growth Rate | CAGR of 13.5% |
| Forecast period | 2024 - 2034 |
| Report Pages | 344 |
| By Deployment |
|
| By Enterprise Size |
|
| By Industry Vertical |
|
| By Component |
|
| By Type |
|
| By Region |
|
| Key Market Players | Peplink Pepwave Limited, F5, Inc., Oracle Corporation, Google LLC, A10 NETWORKS, INC., KEMP TECHNOLOGIES, INC, Juniper Networks, Inc., IBM Corporation, Fastly, Inc, Amazon Web Services, Inc., Loadbalancer.org, Inc., HAProxy Technologies, LLC., Netris, Inc., VMware, Total Uptime Technologies, LLC. , ARRAY NETWORKS, INC., Microsoft Corporation, Edgenexus Limited, Imperva Inc., Huawei Cloud Computing Technologies Co., Ltd. |
Analyst Review
As the load balancer market continues to evolve, CXOs are evaluating the opportunities and challenges regarding this emerging technology. The load balancer market is experiencing significant growth, driven by the expansion of data centers worldwide. As businesses and governments invest more in building and upgrading data centers, the need for efficient traffic management solutions has increased. Load balancers are essential in data centers because they help distribute large amounts of network traffic across multiple servers, ensuring that applications and services run smoothly without interruptions. With more people using online services, streaming, and cloud applications, data centers must handle heavier workloads, making load balancers even more important. Companies are also focusing on making their data centers more reliable and faster, and load balancers play a key role in achieving this. In addition, the growing use of cloud services and the need for high availability are pushing data center operators to invest in advanced load balancing solutions, driving strong market growth.
Furthermore, the growing use of video streaming, gaming, and online services is also contributing to load balancer market growth. With more people spending time on platforms like Netflix, YouTube, and online games, the demand for fast and reliable connections is rising. Load balancers help manage the heavy internet traffic, ensuring smooth performance and minimal downtime. As online entertainment continues to grow, the need for strong load balancing solutions becomes even greater.
Moreover, the need for disaster recovery and business continuity solutions is driving the growth of the load balancer market. Businesses rely heavily on their digital systems to serve customers and run operations. Any downtime caused by server failures, cyberattacks, or network issues can lead to huge losses. Load balancers help by distributing traffic across multiple servers and automatically redirecting it if a server fails, keeping services running smoothly. This ensures that businesses can recover quickly from unexpected problems and continue operating without major interruptions. However, managing complex traffic patterns and ensuring seamless failover in large, distributed networks is a challenge for load balancer and hampering market growth. Despite these challenges, the load balancer market is expected to grow as businesses prioritise disaster recovery and reliable service delivery.
AI-driven traffic management, cloud-native load balancing, edge computing integration, and enhanced security features are the upcoming trends of the load balancer market in the globe.
Software is the leading component of the load balancer market.
North America is the largest regional market for the load balancer market.
$20 billion is the estimated industry size of the load balancer market.
Amazon Web Services, Inc., Google LLC, Microsoft Corporation, F5, Inc., Imperva Inc., VMware, Fastly, Inc, Juniper Networks, Inc., IBM Corporation, Oracle Corporation, Edgenexus Limited, Loadbalancer.org Inc., HAProxy Technologies, LLC., Netris, Inc., Total Uptime Technologies, LLC., Kemp Technologies, Inc, A10 Networks, Inc., Array Networks, Inc., Peplink Pepwave Limited, Huawei Cloud Computing Technologies Co., Ltd. are the top companies to hold the market share in Load Balancer.
Loading Table Of Content...
Loading Research Methodology...

