
Low-E Glass Market Research, 2032
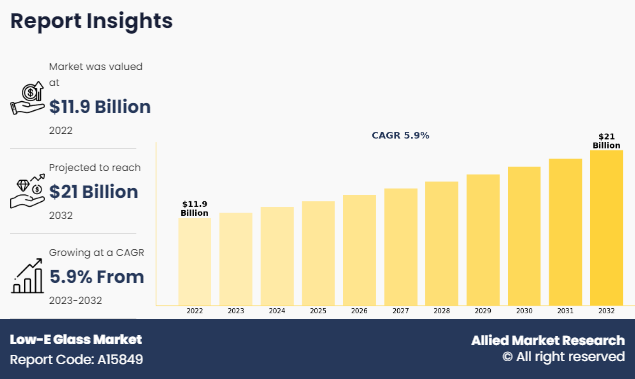
The global low-e glass market size was valued at $11.9 billion in 2022, and is projected to reach $21.0 billion by 2032, growing at a CAGR of 5.9% from 2023 to 2032. The growing emphasis on energy efficiency and sustainability has led to stringent regulations mandating the use of energy-efficient building materials, including low-E glass. Governments worldwide have implemented building codes and standards that require the incorporation of energy-saving technologies in construction projects. For instance, initiatives such as the Energy Performance of Buildings Directive (EPBD) in Europe and Energy Conservation Building Codes (ECBC) in India have propelled the adoption of low-E glass in commercial and residential buildings.
Low-E glass, or low emissivity glass, is an energy-efficient glazing material with a thin, transparent coating that minimizes heat transfer through windows. This coating reflects infrared light while allowing visible light to pass through, reducing heat loss in colder months and limiting heat gain in warmer weather. Used extensively in sustainable architecture, Low-E glass enhances energy efficiency by maintaining a stable indoor temperature. By optimizing insulation, it lowers heating and cooling costs, making it a popular choice for environmentally conscious building designs.
Market Dynamics:
One of the primary drivers of the low-e glass market growth is the rise in awareness of energy efficiency in buildings. Governments and organizations worldwide are increasingly promoting sustainable building practices to reduce energy consumption and combat climate change. According to a report published by the U.S Green Building Council in 2022, the rate of construction of green buildings in the U.S. rose from 11.5% in 2021 to 17% in 2022. Low-e glass plays a crucial role in this by minimizing heat transfer, thus reducing the need for heating and cooling systems.
In addition, governments and regulatory bodies have imposed stricter building codes and energy efficiency standards. For instance, the International Energy Conservation Code (IECC) has issued specific provisions regarding the use of low-e glass to enhance energy efficiency. These regulations often require the use of energy-efficient materials, including low-e glass, in new construction and renovation projects. Compliance with these standards has become a significant driver for the adoption of low-e glass in the construction industry.
Furthermore, the global construction industry has experienced significant growth, driven by urbanization, population growth, and infrastructure development. For instance, according to a report published by National Promotion and Facilitation Agency of India in 2023, the total foreign direct investment (FDI) inflow in the construction industry was $32 billion from April 2000 to September 2023. As construction activities increase, so does the demand for materials that enhance energy efficiency. Low-e glass, with its ability to improve insulation and reduce energy costs, has become a preferred choice for architects, builders, and developers.
However, one of the primary restraints for the widespread adoption of low-E glass is its high initial costs. Low-E glass is produced using advanced coating technologies that enhance its thermal performance. The manufacturing process involves applying thin layers of metallic oxides to the glass surface, making it more expensive than traditional glass. This cost deters some consumers and businesses from choosing low-E glass, especially in regions with budget constraints or where the upfront investment is a significant concern.
On the contrary, consumer awareness and environmental consciousness drive demand for eco-friendly products, including low-E glass. End-users are increasingly conscious of the environmental impact of their choices and are willing to invest in sustainable solutions. The market leverages this growing awareness by promoting the energy-saving benefits of low-E glass and positioning it as a responsible choice for both residential and commercial applications.
Industry Expert Opinion:
According to a report published by Nora Wintour, a former International Trade Union official and independent researcher, the glass manufacturing sector is highly dependent on sectors such as building & construction, car manufacturing, and food & beverage. Furthermore, the glass manufacturing industry is highly concentrated. Considering flat glass production alone, four companies, Nippon Sheet Glass (NSG) Group, Asahi Glass Company (AGC), Saint-Gobain, and the Guardian Group accounted for over 50% of global capacity. Moreover, the European Union is the world’s largest glass market, both in terms of production and consumption. The glass industry in Europe is highly concentrated, with over 80% glass produced by fewer than a dozen multinationals.
Segmental Overview:
The low-e glass market is segmented on the basis of type, coating type, end-user industry, and region. On the basis of type, the market is categorized into single low-e glass, double low-e glass, and triple low-e glass. By coating type, the market is classified into soft coating and hard coating. By end-user industry, the market is divided into building & construction, automotive, aerospace, and others. Region-wise, the market is studied across North America, Europe, Asia-Pacific, and LAMEA.

In 2022, the double low e-glass segment was the largest revenue generator, and is anticipated to grow at a CAGR of 6.1% during the forecast period. Double low-e glass provides even greater energy efficiency compared to single low-e glass. By having two layers of low-e coatings, it further reduces the amount of heat transfer through the glass, both in terms of heat gain during summer and heat loss during winter. This results in reduced energy consumption for heating and cooling, making buildings more environmentally friendly and cost-effective to operate. Furthermore, double low-e glass helps maintain more consistent indoor temperatures by minimizing heat transfer through windows. This can lead to increased occupant comfort, as there are fewer temperature fluctuations near windows, which can be particularly noticeable in climates with extreme temperatures.

In 2022, the soft coating segment was the largest revenue generator, and is anticipated to grow at a CAGR of xx% during the forecast period. Soft-coat low-e glass typically offers higher energy efficiency compared to hard-coat low-e glass. Soft-coat low-e glass has a more advanced coating applied after the glass has been formed, allowing for better control over the coating's properties. This results in greater reductions in heat transfer through windows, leading to improved energy efficiency and lower heating and cooling costs for buildings. Furthermore, soft-coat low-e glass is often more effective at blocking solar heat gain while still allowing visible light to pass through. This means that buildings with soft-coat low-e glass can remain cooler in hot weather, reducing the need for air conditioning and improving occupant comfort.

By end-user industry, the building & construction segment dominated the global market in 2022, and is anticipated to grow at a CAGR of 6.0% during forecast period. Low-e glass helps improve the energy efficiency of buildings by reducing heat transfer through windows. This means that during hot weather, low-e glass helps keep the interior cooler by reflecting solar heat away from the building, thus reducing the need for air conditioning. In colder weather, it helps retain heat inside the building by reflecting radiant heat back into the interior, reducing heating costs. Moreover, with growing concerns about climate change and environmental sustainability, there is increasing pressure on the construction industry to reduce energy consumption and greenhouse gas emissions. Low-e glass is considered a sustainable building material because it helps reduce energy usage, which aligns with sustainability goals and regulatory requirements in many regions.

The Asia-Pacific low-e glass market share is projected to grow at the highest CAGR of 6.0% during the forecast period. The Asia-Pacific region is experiencing rapid urbanization and significant construction activity, driven by population growth, economic development, and urban migration. With the construction of new residential, commercial, and institutional buildings, there is a growing demand for energy-efficient building materials like low-e glass to meet sustainability goals, comply with building codes, and enhance occupant comfort. Moreover, many countries in the Asia-Pacific region have diverse climates, including hot and humid tropical climates, as well as colder climates in some areas. Low-e glass is particularly beneficial in these climates because it helps reduce solar heat gain during hot weather and retains heat during colder periods, contributing to energy savings and maintaining comfortable indoor temperatures year-round.‐¯‐¯
Competitive Analysis:
The global low-e glass market profiles leading players that include CENTRAL GLASS CO., LTD., Taiwan Glass Ind. Corp., TAIWAN GLASS IND. CORP., Beijing Northglass Technologies Co. Ltd, Nippon Sheet Glass Co., Ltd, Arcon Flachglas-Veredlung GmbH & Co. KG, Guardian Glass, Asahi Glass, Saint Gobain, and AGC Inc.
Other key players involved in the manufacturing of low-e glass includes Beijing North Tech Group Ltd, Shenzhen Sun Global Glass, Qingdao Migo Glass Co., Ltd., Metro Performance Glass, Qingdao Tsing Glass Co. Limited, ROMAG., SCHOTT Inc., and others. The global low-e glass market report provides in-depth competitive analysis as well as profiles of these major players.
Key Benefits For Stakeholders
- This report provides a quantitative analysis of the market segments, current trends, estimations, and dynamics of the low-e glass market analysis from 2022 to 2032 to identify the prevailing low-e glass market opportunities.
- The market research is offered along with information related to key drivers, restraints, and opportunities.
- Porter's five forces analysis highlights the potency of buyers and suppliers to enable stakeholders make profit-oriented business decisions and strengthen their supplier-buyer network.
- In-depth analysis of the low-e glass market segmentation assists to determine the prevailing market opportunities.
- Major countries in each region are mapped according to their revenue contribution to the global market.
- Market player positioning facilitates benchmarking and provides a clear understanding of the present position of the market players.
- The report includes the analysis of the regional as well as global low-e glass market trends, key players, market segments, application areas, and market growth strategies.
Low-E Glass Market Report Highlights
| Aspects | Details |
| Market Size By 2032 | USD 21 billion |
| Growth Rate | CAGR of 5.9% |
| Forecast period | 2022 - 2032 |
| Report Pages | 620 |
| By Type |
|
| By Coating Type |
|
| By End-User Industry |
|
| By Region |
|
| Key Market Players | Asahi Glass, Arcon Flachglas-Veredlung GmbH & Co. KG, Guardian Glass, Taiwan Glass Ind. Corp., Beijing Northglass Technologies Co. Ltd, Saint Gobain, AGC Inc., TAIWAN GLASS IND. CORP., CENTRAL GLASS CO., LTD., Nippon Sheet Glass Co., Ltd |
Analyst Review
According to the CXOs of leading company, the low-E glass market is propelled by a confluence of factors ranging from technological advancements and regulatory policies to environmental concerns and economic benefits. As the global focus on sustainability intensifies and energy efficiency becomes paramount, the demand for low-E glass is expected to soar. Manufacturers, architects, builders, and policymakers must collaborate to harness the full potential of low-E glass in mitigating climate change, reducing energy consumption, and creating healthier built environments. By addressing the drivers outlined in this paper, stakeholders can foster a sustainable future while unlocking new opportunities for innovation and growth in the low-E glass market.
Technological Advancements, energy efficiency regulations, environmental concerns, and cost savings and economic benefits are the upcoming trends of Low-E Glass Market in the world.
Building and construction is the leading application of Low-E Glass Market.
Europe is the largest regional market for Low-E Glass
The global low-e glass market was valued at $11.9 billion in 2022 and is estimated to reach $21.0 billion by 2032, exhibiting a CAGR of 5.9% from 2023 to 2032.
CENTRAL GLASS CO., LTD., Taiwan Glass Ind. Corp., TAIWAN GLASS IND. CORP., Beijing Northglass Technologies Co. Ltd, Nippon Sheet Glass Co., Ltd, Arcon Flachglas-Veredlung GmbH & Co. KG, Guardian Glass, Asahi Glass, Saint Gobain, and AGC Inc are the top companies to hold the market share in Low-E Glass.
Loading Table Of Content...
Loading Research Methodology...

