0
2022
Lubricant And Grease Market

Lubricant And Grease Market

by Type (Heavy Duty Engine Oils (HDEO), Hydraulic fluids, Passenger Car Motor Oil (PCMO), Turbine oils, Gear Oil, Greases, Compressor oil, Others), by Application (Power Generation, Automotive, Heavy Equipment, Food and Beverage, Chemical Manufacturing, Others): Global Opportunity Analysis and Industry Forecast, 2021-2031

Report Code: A16467
Oct 2022 | Pages: 350
Tables: 243
Charts: 68
  • Formats*:

  • pdf

    Single User License, Five User
    License & Enterprise User License

  • xls

    Data Pack Excel License

  • ppt

    It comes with the additional cost
    of $2500.00 contact sales.


Lubricant And Grease Market Research, 2031

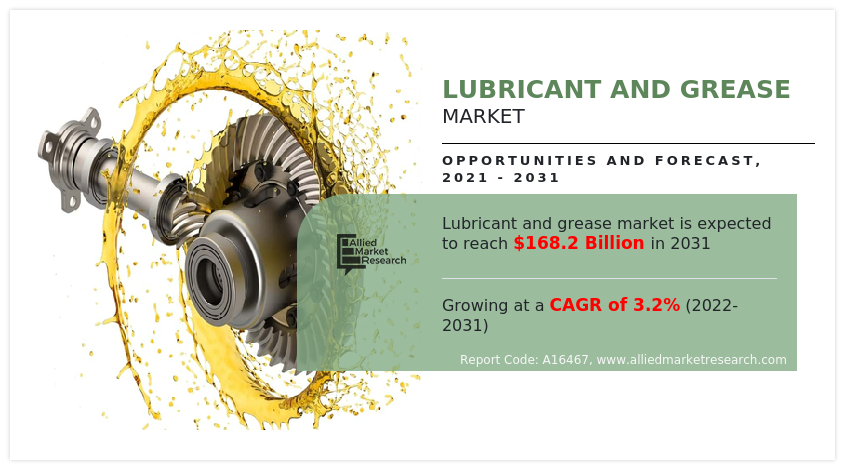
The global lubricant and grease market size was valued at $123.8 billion in 2021, and is projected to reach $168.2 billion by 2031, growing at a CAGR of 3.2% from 2022 to 2031.

The demand for bio-based lubricant increased owing to their significantly low environmental footprint, zero toxicity, and low operation and maintenance costs during product life-cycle. Bio-based lubricants have been gaining significant importance in a number of industries as they are highly biodegradable, has less toxic effect on environment, low skin problems on personnel and as compared to mineral oil or petroleum lubricants.

Lubricant & grease is a friction-reducing film between moving objects and helps in reducing the heat generated. Lubricants perform functions such as transmitting forces, transporting foreign particles, and heating & cooling surfaces. Depending on the nature of lubricants, they are used to eliminate heat and wear debris, supply additives into the contact, transmit power, protect, and seal.
Lubricant And Grease Market

Growth in demand for lubricants made from bio-based materials has left in shift in terms of raw materials. The demand for automotive oils and greases is expected to increase as the trade in automobiles and their replacement parts expands. The consumer cars segment is anticipated to grow, which is good for the automotive industry as a result of the significant economic recovery in North America and Europe. During the forecast period, rising auto sales are anticipated to boost worldwide lubricant and grease market industry growth. Countries like India, China, the U.S., and Brazil are principally responsible for increase in global vehicle sales. Furthermore, rapid expansion in specialized manufacturing industries such as 3D printing & medical devices is anticipated to support industrial growth in these areas. Hence, rapid industrialization in Brazil, Russia, India, China & South Africa (BRICS) is expected to drive industrial fluids demand, which, in turn, is expected to complement the global lubricants and grease market growth.

Key industries driving the rise in need for lubricant and grease include automotive, manufacturing, foods & beverages, and construction. The automotive industry utilizes grease in several car parts, such as CV joints, gear assemblies, and electrically operated windows, sunroofs, and seats. Numerous varieties of grease are used depending on component and temperature setting. Some of the most common ones are white grease, high-temperature wheel bearing grease, electronic grease, and chassis grease. Chassis grease, the most popular type of grease is used on suspension and steering joints of cars, high-temperature wheel bearing grease is used in hot, frictional places such as disc brakes and wheel bearings, electronic grease is used on electronic connections where heat cannot build up for safety and white grease, which is waterproof and non-toxic, is used on white-colored surfaces.

Rise of the automobile industry ultimately leads to increase in demand for lubricant and grease, owing to rising per capita income, expanding need for customized transportation, and rising aspiration to own a vehicle. For instance, ExxonMobil Lubricants Pvt. Ltd. announced introduction of next-generation passenger car lubricants on July 1, 2022, in New Delhi. These lubricants feature higher technology and adhere to the BS-VI guideline by the government of India. Through its Mobil Super All-In-One Protection series and Mobil Super Friction Fighter Series, lubricants offer benefits for fuel economy as well as increased wear protection and engine cleanliness. Packaging of new lubricants incorporates QR codes to stop sales of fake goods. Users should experience improved fuel economy, owing to new synthetic lubricants and packaging changes, which will also make it easier for customers to handle the products.

The chemical industry uses lubricant and grease a lot. Usage of lubricant and grease can help chemical manufacturing facilities maintain a consistently high output. In addition, entire production process is more efficient and operational costs are reduced. Paper and packing industries make substantial use of various lubricants and grease. Paper and packaging business requires continuous operation of production lines to consistently create goods of a high caliber. Large stress levels must be able to be absorbed by rotating equipment such as pulpers, drum barkers, and rotary kilns. These factors have caused the grease market to grow dramatically.

Demand for increased renewable energy has positively affected the lubricant and grease market 

The equipment required for generation of renewable energy must be lubricated so that they function properly. For instance, wind turbines are very expensive types of machinery and require proper lubrication for smooth functioning. The gearbox, which can be positioned at a height of up to 300 feet, is the specific component of a wind turbine that is exposed to the greatest winds. A lubricant is used to increase viscosity of gearbox as it is subjected to particularly harsh environmental conditions, such as extreme temperatures and potential corrosion from saltwater exposure. As a result, gearboxes withstand any effects that cold weather conditions may have on it. In addition, lubricants with higher heat capacities than hydrocarbon oils enable the gearbox to transport and release more heat as required. Gearbox of a wind turbine must be regularly lubricated to maintain its lifespan. When wind turbines are situated in isolated areas, such as desert, where the entry of airborne dust and other types of abrasive particles might ultimately lead to failure of the entire system, such greasing systems provide excellent oil purity, which can be crucial. Owing to these factors, demand for the lubricant and grease market have increased tremendously.

The lubricant and grease market is segmented on the basis of type, application, and region. On the basis of type, the market is classified into heavy-duty engine oils (HDEO), passenger car motor oil (PCMO), gear oil, hydraulic fluids, turbine oils, greases, compressor oil, and others. On the basis of application, it is categorized into power generation, automotive, heavy equipment, foods & beverages, chemical manufacturing, and others. Region-wise, the market is analyzed across North America, Europe, Asia-Pacific, Latin America, and Middle East.

Major players operating in the lubricant and grease market industry include, Armor Lubricants, Total, Petromin, Aljomaih And Shell Lubricating Oil Company Limited, Behran Oil Co., FUCHS, Exxon Mobil Corporation, GULF OIL Middle East Limited (GULF OIL International), Emarat, and Idemitsu Kosan Co., Ltd. These players have adopted product launch, acquisition, and business expansion as their key strategies to increase their lubricant and grease market shares.
Lubricant And Grease Market

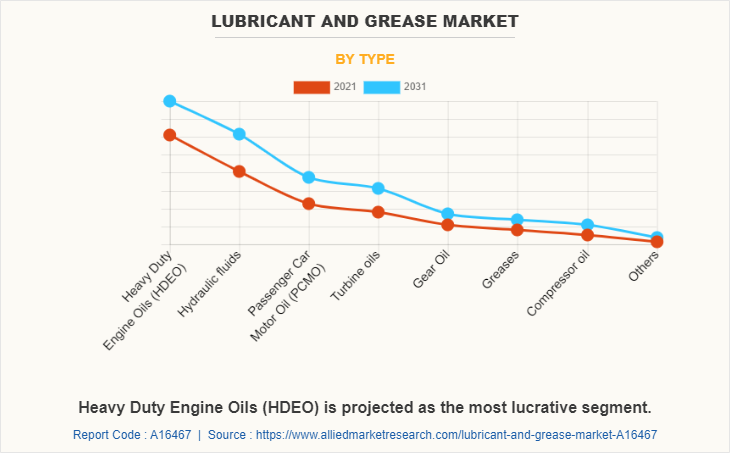
By type, the heavy duty engine oils (HDEO) segment is expected to lead the global lubricant and grease market during the forecast period. Dominance of engine oil is mainly attributed to its wide usability in the transportation sector as compared to other types and its demand from the construction industry, especially from the construction vehicles. Engine oil lubricates engine parts for its efficient movement, thereby reducing the extent of metal contact, friction, and heat generation within the engine. In addition, cleaning & cooling the engine parts, sealing gaps, and rust prevention are other functions carried out by engine oil. 
Lubricant And Grease Market

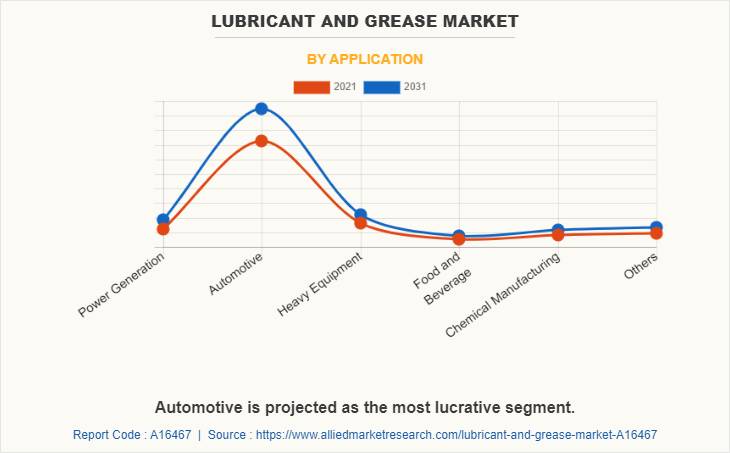
By application, the automotive segment accounted for around 72.6% of the global lubricant and grease market share in 2021. The demand for lubricants is high in the automotive segment, owing to rise in number of vehicles on the road in China and rise in transportation demands in India and ASEAN. For instance, in August 27, 2020, the FUCHS Group, launched new product named FUCHS BluEV. It operates globally in the lubricants industry. The FUCHS BluEV product line will initially comprise three product categories: FUCHS BluEV DriveFluid-transmission oils in electric and hybrid drives, FUCHS BluEV MotorGrease-grease products for electric motors designed especially for e-mobility applications, and FUCHS BluEV ThermalFluid-dielectric heat transfer media for automotive applications. This way, FUCHS offers an efficient and optimally aligned 360-degree solution for lubrication, thermal management, and protection of the components for all areas of e-mobility from a single source. This product launch has reinforced the company’s product portfolio.
Lubricant And Grease Market

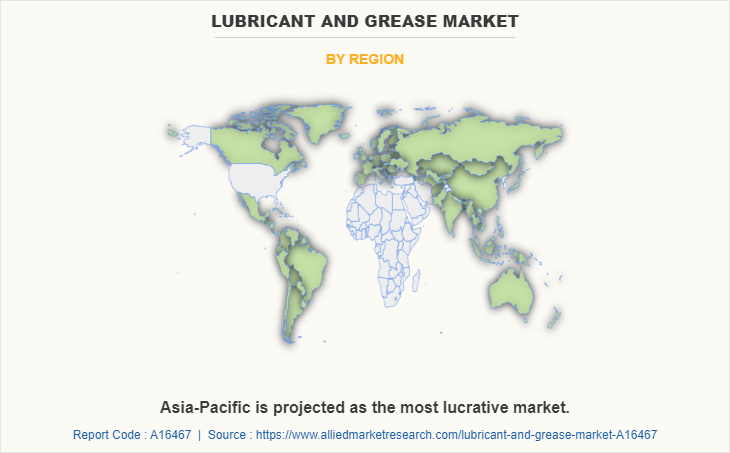
By region, Asia-Pacific is expected to account for the largest share in the global lubricants and grease industry during the forecast period, in terms of both volume and value. Rise in population in the region, accompanied by rising spending in the industrial sector and infrastructural developments in developing markets of China, India, and Indonesia is projected to make this region an ideal destination for the lubricants industry. For instance, in April 28, 2022, BASF SE and China Petroleum & Chemical Corporation (Sinopec Corporation) on March 19 submitted the technical and commercial feasibility study for the approval of the planned $900 million expansion of their joint chemical Verbund site in Nanjing to the government of China. The site is operated by the joint venture BASF-YPC Company Ltd. (BYC). Expansion includes new capacities of several downstream chemical plants and a new tert-butyl acrylate plant to serve growing demand from various industries in China.

Latest Advancement - Graphene-based lubricant

There is an increase in the latest advancements in lubricant market i.e., the use of graphene-based lubricant. Graphene being two-dimensional material, offers unique friction and wear properties that is not typically seen in conventional materials. The extreme mechanical strength of graphene suppresses material wear. Secondly, graphene has been shown to be impermeable to liquids and gases, such as water or oxygen, thus slowing down the corrosive and oxidative processes that usually cause more damage to rubbing surfaces. Also, graphene is an atomically smooth two-dimensional material with low surface energy and is, therefore, able to replace the thin solid films usually used for reducing adhesion and friction of various surfaces.

Key players operating in the industry include Graphite Central (Processes and supplies graphite in all grades and types for a variety of manufacturing industries), Grolltex, Inc. (Manufacturer of advanced materials. Products include large area, single layer CVD graphene sheets. Applications include flexible transparent conductive electrodes, OPV and OLED barrier materials, sensors and membranes), Graphene One LLC (Manufacturer of graphene available in continuous filament, staple fiber, and yarn forms. Products are bacteriostatic, deodorizing, and UV absorbant. Suitable for textile applications), Graphenea Inc. (Manufacturer of graphene materials for research and industrial markets. Products include CVD films, substrates, graphene oxide, and monolayer graphene), Global Graphene Group (Manufacturer & dist. of nano materials technologies & products to various industries. Products include nano-graphene solutions including nano-graphene platelets (NGPs)), First Graphene (Manufacturer and distributor of graphene materials. Types of graphene materials include graphene oxide, graphene oxide flake, and graphene flake).

Italian start-up Graphene-XT has developed a new graphene-based lubricating oil for cars and motorcycles. Developed with support from the EU-funded GrapheneCore3 project, Graphene-XT’s new lubricating oils result in more compression and less wear and tear in both petrol and diesel engine parts. Sweden-based Applied Nano Surfaces (ANS) launched a new product, Tricolit GO, one of the first graphene-enhanced low-friction coatings on the market today. Tricolit is available now from ANS, in easy-to-apply spray cans or in bulk. The product can be used to reduce friction and wear. ANS claims that the use of graphene allows a tenfold increase in the coating’s mechanical strength and abrasion-resistance.

A new initiative called "The Technical Standards Development and Application Demonstration Base of Graphene-Modified Lubricants" was launched at LiuGong’s Global R&D Center in Liuzhou, China. Co-built by the China Innovation Alliance of the Graphene Industry and Guangxi Liugong Machinery (a leading China-based construction equipment manufacturer), it aims to become a major base in China that concentrates on the transformation of graphene’s scientific research into real world applications. The partnership also includes building a joint laboratory and undertaking independent test tasks from other companies in the future. The Wuxi Graphene Industry Development & Demonstration Zone (in Wuxi, China - near Shanghai) is an impressive graphene center. The center has many graphene products and materials under development or in production at the center.

COVID-19 impact analysis on the lubricant and grease market

  • The outbreak of COVID-19 in China and its spread across numerous countries globally, halted the manufacturing activities of industrial sectors, which correspondingly hampered lubricant and grease manufacturing as well. The raw material procurement was also challenged owing to the outbreak of COVID-19.
  • The grease market is significantly influenced by the variation in the crude oil market. Between 2008 and 2014, the crude oil market enjoyed a profitable run as prices hit USD 100 barrier per barrel and beyond. The Brent crude was priced at USD 140 per barrel, and WTI was priced at USD 120 per barrel. In 2015, crude prices dropped to record lows. Such volatile prices affect the margins of manufacturing companies. The majority of grease products are based on mineral oil, which is sourced from crude oil. Therefore, the prices of grease depend on crude oil prices. Price change has a huge impact on the grease market.

Key Benefits For Stakeholders

  • This report provides a quantitative analysis of the market segments, current trends, estimations, and dynamics of the lubricant and grease market analysis from 2021 to 2031 to identify the prevailing lubricant and grease market opportunities.
  • The lubricant and grease market research is offered along with information related to key drivers, restraints, and opportunities.
  • Porter's five forces analysis highlights the potency of buyers and suppliers to enable stakeholders make profit-oriented business decisions and strengthen their supplier-buyer network.
  • In-depth analysis of the lubricant and grease market segmentation assists to determine the prevailing market opportunities.
  • Major countries in each region are mapped according to their revenue contribution to the global lubricant and grease market.
  • Market player positioning facilitates benchmarking and provides a clear understanding of the present position of the lubricant and grease market players.
  • The report includes the analysis of the regional as well as global lubricant and grease market trends, key players, market segments, application areas, and market growth strategies.

Lubricant And Grease Market Report Highlights

Aspects Details
Market Size By 2031 USD 168.2 billion
Growth Rate CAGR of 3.2%
Forecast period 2021 - 2031
Report Pages 350
By Type
  • Turbine oils
  • Gear Oil
  • Greases
  • Compressor oil
  • Others
  • Heavy Duty Engine Oils (HDEO)
  • Hydraulic fluids
  • Passenger Car Motor Oil (PCMO)
By Application
  • Power Generation
  • Automotive
  • Heavy Equipment
  • Food and Beverage
  • Chemical Manufacturing
  • Others
By Region
  • North America  (U.S., Canada, Mexico)
  • Europe  (Germany, UK, France, Spain, Italy, Rest of Europe)
  • Asia-Pacific  (China, India, Japan, South Korea, Australia, Rest of Asia-Pacific)
  • Latin America  (Brazil, Argentina, Rest of Latin America)
  • Middle East  (Iran, Islamic Republic Of, Saudi Arabia, UAE, Kuwait, Bahrain, Qatar, Rest Of Middle East)
Key Market Players , Total S.A.,, aljomaih and shell lubricating oil company limited, Behran Oil Co., GULF OIL Middle East Limited (GULF OIL International), Emarat, FUCHS, petromin corporation, Idemitsu Kosan Co., Ltd., Exxon Mobil Corporation,  Armor Lubricants 
 
  • CHAPTER 1:INTRODUCTION

    • 1.1.Report description

    • 1.2.Key market segments

    • 1.3.Key benefits to the stakeholders

    • 1.4.Research Methodology

      • 1.4.1.Secondary research

      • 1.4.2.Primary research

      • 1.4.3.Analyst tools and models

  • CHAPTER 2:EXECUTIVE SUMMARY

    • 2.1.Key findings of the study

    • 2.2.CXO Perspective

  • CHAPTER 3:MARKET OVERVIEW

    • 3.1.Market definition and scope

    • 3.2.Key findings

      • 3.2.1.Top investment pockets

    • 3.3.Porter’s five forces analysis

    • 3.4.Top player positioning

    • 3.5.Market dynamics

      • 3.5.1.Drivers

      • 3.5.2.Restraints

      • 3.5.3.Opportunities

    • 3.6.COVID-19 Impact Analysis on the market

    • 3.7.Pricing Analysis

    • 3.8.Regulatory Guidelines

    • 3.9.Patent Landscape

  • CHAPTER 4: LUBRICANT AND GREASE MARKET, BY TYPE

    • 4.1 Overview

      • 4.1.1 Market size and forecast

    • 4.2 Heavy Duty Engine Oils (HDEO)

      • 4.2.1 Key market trends, growth factors and opportunities

      • 4.2.2 Market size and forecast, by region

      • 4.2.3 Market analysis by country

    • 4.3 Hydraulic fluids

      • 4.3.1 Key market trends, growth factors and opportunities

      • 4.3.2 Market size and forecast, by region

      • 4.3.3 Market analysis by country

    • 4.4 Passenger Car Motor Oil (PCMO)

      • 4.4.1 Key market trends, growth factors and opportunities

      • 4.4.2 Market size and forecast, by region

      • 4.4.3 Market analysis by country

    • 4.5 Turbine oils

      • 4.5.1 Key market trends, growth factors and opportunities

      • 4.5.2 Market size and forecast, by region

      • 4.5.3 Market analysis by country

    • 4.6 Gear Oil

      • 4.6.1 Key market trends, growth factors and opportunities

      • 4.6.2 Market size and forecast, by region

      • 4.6.3 Market analysis by country

    • 4.7 Greases

      • 4.7.1 Key market trends, growth factors and opportunities

      • 4.7.2 Market size and forecast, by region

      • 4.7.3 Market analysis by country

    • 4.8 Compressor oil

      • 4.8.1 Key market trends, growth factors and opportunities

      • 4.8.2 Market size and forecast, by region

      • 4.8.3 Market analysis by country

    • 4.9 Others

      • 4.9.1 Key market trends, growth factors and opportunities

      • 4.9.2 Market size and forecast, by region

      • 4.9.3 Market analysis by country

  • CHAPTER 5: LUBRICANT AND GREASE MARKET, BY APPLICATION

    • 5.1 Overview

      • 5.1.1 Market size and forecast

    • 5.2 Power Generation

      • 5.2.1 Key market trends, growth factors and opportunities

      • 5.2.2 Market size and forecast, by region

      • 5.2.3 Market analysis by country

    • 5.3 Automotive

      • 5.3.1 Key market trends, growth factors and opportunities

      • 5.3.2 Market size and forecast, by region

      • 5.3.3 Market analysis by country

    • 5.4 Heavy Equipment

      • 5.4.1 Key market trends, growth factors and opportunities

      • 5.4.2 Market size and forecast, by region

      • 5.4.3 Market analysis by country

    • 5.5 Food and Beverage

      • 5.5.1 Key market trends, growth factors and opportunities

      • 5.5.2 Market size and forecast, by region

      • 5.5.3 Market analysis by country

    • 5.6 Chemical Manufacturing

      • 5.6.1 Key market trends, growth factors and opportunities

      • 5.6.2 Market size and forecast, by region

      • 5.6.3 Market analysis by country

    • 5.7 Others

      • 5.7.1 Key market trends, growth factors and opportunities

      • 5.7.2 Market size and forecast, by region

      • 5.7.3 Market analysis by country

  • CHAPTER 6: LUBRICANT AND GREASE MARKET, BY REGION

    • 6.1 Overview

      • 6.1.1 Market size and forecast

    • 6.2 North America

      • 6.2.1 Key trends and opportunities

      • 6.2.2 North America Market size and forecast, by Type

      • 6.2.3 North America Market size and forecast, by Application

      • 6.2.4 North America Market size and forecast, by country

        • 6.2.4.1 U.S.
          • 6.2.4.1.1 Market size and forecast, by Type
          • 6.2.4.1.2 Market size and forecast, by Application
        • 6.2.4.2 Canada
          • 6.2.4.2.1 Market size and forecast, by Type
          • 6.2.4.2.2 Market size and forecast, by Application
        • 6.2.4.3 Mexico
          • 6.2.4.3.1 Market size and forecast, by Type
          • 6.2.4.3.2 Market size and forecast, by Application
    • 6.3 Europe

      • 6.3.1 Key trends and opportunities

      • 6.3.2 Europe Market size and forecast, by Type

      • 6.3.3 Europe Market size and forecast, by Application

      • 6.3.4 Europe Market size and forecast, by country

        • 6.3.4.1 Germany
          • 6.3.4.1.1 Market size and forecast, by Type
          • 6.3.4.1.2 Market size and forecast, by Application
        • 6.3.4.2 UK
          • 6.3.4.2.1 Market size and forecast, by Type
          • 6.3.4.2.2 Market size and forecast, by Application
        • 6.3.4.3 France
          • 6.3.4.3.1 Market size and forecast, by Type
          • 6.3.4.3.2 Market size and forecast, by Application
        • 6.3.4.4 Spain
          • 6.3.4.4.1 Market size and forecast, by Type
          • 6.3.4.4.2 Market size and forecast, by Application
        • 6.3.4.5 Italy
          • 6.3.4.5.1 Market size and forecast, by Type
          • 6.3.4.5.2 Market size and forecast, by Application
        • 6.3.4.6 Rest of Europe
          • 6.3.4.6.1 Market size and forecast, by Type
          • 6.3.4.6.2 Market size and forecast, by Application
    • 6.4 Asia-Pacific

      • 6.4.1 Key trends and opportunities

      • 6.4.2 Asia-Pacific Market size and forecast, by Type

      • 6.4.3 Asia-Pacific Market size and forecast, by Application

      • 6.4.4 Asia-Pacific Market size and forecast, by country

        • 6.4.4.1 China
          • 6.4.4.1.1 Market size and forecast, by Type
          • 6.4.4.1.2 Market size and forecast, by Application
        • 6.4.4.2 India
          • 6.4.4.2.1 Market size and forecast, by Type
          • 6.4.4.2.2 Market size and forecast, by Application
        • 6.4.4.3 Japan
          • 6.4.4.3.1 Market size and forecast, by Type
          • 6.4.4.3.2 Market size and forecast, by Application
        • 6.4.4.4 South Korea
          • 6.4.4.4.1 Market size and forecast, by Type
          • 6.4.4.4.2 Market size and forecast, by Application
        • 6.4.4.5 Australia
          • 6.4.4.5.1 Market size and forecast, by Type
          • 6.4.4.5.2 Market size and forecast, by Application
        • 6.4.4.6 Rest of Asia-Pacific
          • 6.4.4.6.1 Market size and forecast, by Type
          • 6.4.4.6.2 Market size and forecast, by Application
    • 6.5 Latin America

      • 6.5.1 Key trends and opportunities

      • 6.5.2 Latin America Market size and forecast, by Type

      • 6.5.3 Latin America Market size and forecast, by Application

      • 6.5.4 Latin America Market size and forecast, by country

        • 6.5.4.1 Brazil
          • 6.5.4.1.1 Market size and forecast, by Type
          • 6.5.4.1.2 Market size and forecast, by Application
        • 6.5.4.2 Argentina
          • 6.5.4.2.1 Market size and forecast, by Type
          • 6.5.4.2.2 Market size and forecast, by Application
        • 6.5.4.3 Rest of Latin America
          • 6.5.4.3.1 Market size and forecast, by Type
          • 6.5.4.3.2 Market size and forecast, by Application
    • 6.6 Middle East

      • 6.6.1 Key trends and opportunities

      • 6.6.2 Middle East Market size and forecast, by Type

      • 6.6.3 Middle East Market size and forecast, by Application

      • 6.6.4 Middle East Market size and forecast, by country

        • 6.6.4.1 Iran, Islamic Republic Of
          • 6.6.4.1.1 Market size and forecast, by Type
          • 6.6.4.1.2 Market size and forecast, by Application
        • 6.6.4.2 Saudi Arabia
          • 6.6.4.2.1 Market size and forecast, by Type
          • 6.6.4.2.2 Market size and forecast, by Application
        • 6.6.4.3 UAE
          • 6.6.4.3.1 Market size and forecast, by Type
          • 6.6.4.3.2 Market size and forecast, by Application
        • 6.6.4.4 Kuwait
          • 6.6.4.4.1 Market size and forecast, by Type
          • 6.6.4.4.2 Market size and forecast, by Application
        • 6.6.4.5 Bahrain
          • 6.6.4.5.1 Market size and forecast, by Type
          • 6.6.4.5.2 Market size and forecast, by Application
        • 6.6.4.6 Qatar
          • 6.6.4.6.1 Market size and forecast, by Type
          • 6.6.4.6.2 Market size and forecast, by Application
        • 6.6.4.7 Rest Of Middle East
          • 6.6.4.7.1 Market size and forecast, by Type
          • 6.6.4.7.2 Market size and forecast, by Application
  • CHAPTER 7: COMPANY LANDSCAPE

    • 7.1. Introduction

    • 7.2. Top winning strategies

    • 7.3. Product Mapping of Top 10 Player

    • 7.4. Competitive Dashboard

    • 7.5. Competitive Heatmap

    • 7.6. Key developments

  • CHAPTER 8: COMPANY PROFILES

    • 8.1  Armor Lubricants 

      • 8.1.1 Company overview

      • 8.1.2 Company snapshot

      • 8.1.3 Operating business segments

      • 8.1.4 Product portfolio

      • 8.1.5 Business performance

      • 8.1.6 Key strategic moves and developments

    • 8.2 , Total S.A.,

      • 8.2.1 Company overview

      • 8.2.2 Company snapshot

      • 8.2.3 Operating business segments

      • 8.2.4 Product portfolio

      • 8.2.5 Business performance

      • 8.2.6 Key strategic moves and developments

    • 8.3 petromin corporation

      • 8.3.1 Company overview

      • 8.3.2 Company snapshot

      • 8.3.3 Operating business segments

      • 8.3.4 Product portfolio

      • 8.3.5 Business performance

      • 8.3.6 Key strategic moves and developments

    • 8.4 aljomaih and shell lubricating oil company limited

      • 8.4.1 Company overview

      • 8.4.2 Company snapshot

      • 8.4.3 Operating business segments

      • 8.4.4 Product portfolio

      • 8.4.5 Business performance

      • 8.4.6 Key strategic moves and developments

    • 8.5 Behran Oil Co.

      • 8.5.1 Company overview

      • 8.5.2 Company snapshot

      • 8.5.3 Operating business segments

      • 8.5.4 Product portfolio

      • 8.5.5 Business performance

      • 8.5.6 Key strategic moves and developments

    • 8.6 FUCHS

      • 8.6.1 Company overview

      • 8.6.2 Company snapshot

      • 8.6.3 Operating business segments

      • 8.6.4 Product portfolio

      • 8.6.5 Business performance

      • 8.6.6 Key strategic moves and developments

    • 8.7 Exxon Mobil Corporation

      • 8.7.1 Company overview

      • 8.7.2 Company snapshot

      • 8.7.3 Operating business segments

      • 8.7.4 Product portfolio

      • 8.7.5 Business performance

      • 8.7.6 Key strategic moves and developments

    • 8.8 GULF OIL Middle East Limited (GULF OIL International)

      • 8.8.1 Company overview

      • 8.8.2 Company snapshot

      • 8.8.3 Operating business segments

      • 8.8.4 Product portfolio

      • 8.8.5 Business performance

      • 8.8.6 Key strategic moves and developments

    • 8.9 Emarat

      • 8.9.1 Company overview

      • 8.9.2 Company snapshot

      • 8.9.3 Operating business segments

      • 8.9.4 Product portfolio

      • 8.9.5 Business performance

      • 8.9.6 Key strategic moves and developments

    • 8.10 Idemitsu Kosan Co., Ltd.

      • 8.10.1 Company overview

      • 8.10.2 Company snapshot

      • 8.10.3 Operating business segments

      • 8.10.4 Product portfolio

      • 8.10.5 Business performance

      • 8.10.6 Key strategic moves and developments

  • LIST OF TABLES

  • TABLE 01. LUBRICANT AND GREASE PRICING FORECAST BY REGION,2021–2031 ($/KG)
    TABLE 02. LUBRICANT AND GREASE MARKET, BY TYPE, 2021-2031 (KILOTONS)
    TABLE 03. LUBRICANT AND GREASE MARKET, BY TYPE, 2021-2031 ($MILLION)
    TABLE 04. LUBRICANT AND GREASE MARKET FOR HEAVY DUTY ENGINE OILS (HDEO), BY REGION, 2021-2031 (KILOTONS)
    TABLE 05. LUBRICANT AND GREASE MARKET FOR HEAVY DUTY ENGINE OILS (HDEO), BY REGION, 2021–2031 ($MILLION)
    TABLE 06. LUBRICANT AND GREASE MARKET FOR HYDRAULIC FLUIDS, BY REGION, 2021-2031 (KILOTONS)
    TABLE 07. LUBRICANT AND GREASE MARKET FOR HYDRAULIC FLUIDS, BY REGION, 2021–2031 ($MILLION)
    TABLE 08. LUBRICANT AND GREASE MARKET FOR PASSENGER CAR MOTOR OIL (PCMO), BY REGION, 2021-2031 (KILOTONS)
    TABLE 09. LUBRICANT AND GREASE MARKET FOR PASSENGER CAR MOTOR OIL (PCMO), BY REGION, 2021–2031 ($MILLION)
    TABLE 10. LUBRICANT AND GREASE MARKET FOR TURBINE OILS, BY REGION, 2021-2031 (KILOTONS)
    TABLE 11. LUBRICANT AND GREASE MARKET FOR TURBINE OILS, BY REGION, 2021–2031 ($MILLION)
    TABLE 12. LUBRICANT AND GREASE MARKET FOR GEAR OIL, BY REGION, 2021-2031 (KILOTONS)
    TABLE 13. LUBRICANT AND GREASE MARKET FOR GEAR OIL, BY REGION, 2021–2031 ($MILLION)
    TABLE 14. LUBRICANT AND GREASE MARKET FOR GREASES, BY REGION, 2021-2031 (KILOTONS)
    TABLE 15. LUBRICANT AND GREASE MARKET FOR GREASES, BY REGION, 2021–2031 ($MILLION)
    TABLE 16. LUBRICANT AND GREASE MARKET FOR COMPRESSOR OIL, BY REGION, 2021-2031 (KILOTONS)
    TABLE 17. LUBRICANT AND GREASE MARKET FOR COMPRESSOR OIL, BY REGION, 2021–2031 ($MILLION)
    TABLE 18. LUBRICANT AND GREASE MARKET FOR OTHERS, BY REGION, 2021-2031 (KILOTONS)
    TABLE 19. LUBRICANT AND GREASE MARKET FOR OTHERS, BY REGION, 2021–2031 ($MILLION)
    TABLE 20. LUBRICANT AND GREASE MARKET, BY APPLICATION, 2021–2031 (KILOTONS)
    TABLE 21. LUBRICANT AND GREASE MARKET, BY APPLICATION, 2021–2031 ($MILLION)
    TABLE 22. LUBRICANT AND GREASE MARKET FOR POWER GENERATION, BY REGION, 2021–2031 (KILOTONS)
    TABLE 23. LUBRICANT AND GREASE MARKET FOR POWER GENERATION, BY REGION, 2021–2031 ($MILLION)
    TABLE 24. LUBRICANT AND GREASE MARKET FOR AUTOMOTIVE, BY REGION, 2021–2031 (KILOTONS)
    TABLE 25. LUBRICANT AND GREASE MARKET FOR AUTOMOTIVE, BY REGION, 2021–2031 ($MILLION)
    TABLE 26. LUBRICANT AND GREASE MARKET FOR HEAVY EQUIPMENT, BY REGION, 2021–2031 (KILOTONS)
    TABLE 27. LUBRICANT AND GREASE MARKET FOR HEAVY EQUIPMENT, BY REGION, 2021–2031 ($MILLION)
    TABLE 28. LUBRICANT AND GREASE MARKET FOR FOOD AND BEVERAGE, BY REGION, 2021–2031 (KILOTONS)
    TABLE 29. LUBRICANT AND GREASE MARKET FOR FOOD AND BEVERAGE, BY REGION, 2021–2031 ($MILLION)
    TABLE 30. LUBRICANT AND GREASE MARKET FOR CHEMICAL MANUFACTURING, BY REGION, 2021–2031 (KILOTONS)
    TABLE 31. LUBRICANT AND GREASE MARKET FOR CHEMICAL MANUFACTURING, BY REGION, 2021–2031 ($MILLION)
    TABLE 32. LUBRICANT AND GREASE MARKET FOR OTHERS, BY REGION, 2021–2031 (KILOTONS)
    TABLE 33. LUBRICANT AND GREASE MARKET FOR OTHERS, BY REGION, 2021–2031 ($MILLION)
    TABLE 34. LUBRICANT AND GREASE MARKET, BY REGION, 2021-2031(KILOTONS)
    TABLE 35. LUBRICANT AND GREASE MARKET, BY REGION, 2021-2031($MILLION)
    TABLE 36. NORTH AMERICA LUBRICANT AND GREASE MARKET, BY TYPE, 2021-2031(KILOTONS)
    TABLE 37. NORTH AMERICA LUBRICANT AND GREASE MARKET, TYPE, 2021-2031($MILLION)
    TABLE 38. NORTH AMERICA LUBRICANT AND GREASE MARKET, BY APPLICATION, 2021-2031(KILOTONS)
    TABLE 39. NORTH AMERICA LUBRICANT AND GREASE MARKET, BY APPLICATION, 2021-2031($MILLION)
    TABLE 40. NORTH AMERICA LUBRICANT AND GREASE MARKET, BY COUNTRY, 2021–2031 ($MILLION)
    TABLE 41. NORTH AMERICA LUBRICANT AND GREASE MARKET, BY COUNTRY, 2021–2031 (KILOTONS)
    TABLE 42. U.S. LUBRICANT AND GREASE MARKET, BY TYPE, 2021-2031(KILOTONS)
    TABLE 43. U.S. LUBRICANT AND GREASE MARKET, TYPE, 2021-2031($MILLION)
    TABLE 44. U.S. LUBRICANT AND GREASE MARKET, BY APPLICATION, 2021-2031(KILOTONS)
    TABLE 45. U.S. LUBRICANT AND GREASE MARKET, BY APPLICATION, 2021-2031($MILLION)
    TABLE 46. CANADA LUBRICANT AND GREASE MARKET, BY TYPE, 2021-2031(KILOTONS)
    TABLE 47. CANADA LUBRICANT AND GREASE MARKET, TYPE, 2021-2031($MILLION)
    TABLE 48. CANADA LUBRICANT AND GREASE MARKET, BY APPLICATION, 2021-2031(KILOTONS)
    TABLE 49. CANADA LUBRICANT AND GREASE MARKET, BY APPLICATION, 2021-2031($MILLION)
    TABLE 50. MEXICO LUBRICANT AND GREASE MARKET, BY TYPE, 2021-2031(KILOTONS)
    TABLE 51. MEXICO LUBRICANT AND GREASE MARKET, TYPE, 2021-2031($MILLION)
    TABLE 52. MEXICO LUBRICANT AND GREASE MARKET, BY APPLICATION, 2021-2031(KILOTONS)
    TABLE 53. MEXICO LUBRICANT AND GREASE MARKET, BY APPLICATION, 2021-2031($MILLION)
    TABLE 54. EUROPE LUBRICANT AND GREASE MARKET, BY TYPE, 2021-2031(KILOTONS)
    TABLE 55. EUROPE LUBRICANT AND GREASE MARKET, TYPE, 2021-2031($MILLION)
    TABLE 56. EUROPE LUBRICANT AND GREASE MARKET, BY APPLICATION, 2021-2031(KILOTONS)
    TABLE 57. EUROPE LUBRICANT AND GREASE MARKET, BY APPLICATION, 2021-2031($MILLION)
    TABLE 58. EUROPE LUBRICANT AND GREASE MARKET, BY COUNTRY, 2021–2031 ($MILLION)
    TABLE 59. EUROPE LUBRICANT AND GREASE MARKET, BY COUNTRY, 2021–2031 (KILOTONS)
    TABLE 60. GERMANY LUBRICANT AND GREASE MARKET, BY TYPE, 2021-2031(KILOTONS)
    TABLE 61. GERMANY LUBRICANT AND GREASE MARKET, TYPE, 2021-2031($MILLION)
    TABLE 62. GERMANY LUBRICANT AND GREASE MARKET, BY APPLICATION, 2021-2031(KILOTONS)
    TABLE 63. GERMANY LUBRICANT AND GREASE MARKET, BY APPLICATION, 2021-2031($MILLION)
    TABLE 64. UK LUBRICANT AND GREASE MARKET, BY TYPE, 2021-2031(KILOTONS)
    TABLE 65. UK LUBRICANT AND GREASE MARKET, TYPE, 2021-2031($MILLION)
    TABLE 66. UK LUBRICANT AND GREASE MARKET, BY APPLICATION, 2021-2031(KILOTONS)
    TABLE 67. UK LUBRICANT AND GREASE MARKET, BY APPLICATION, 2021-2031($MILLION)
    TABLE 68. FRANCE LUBRICANT AND GREASE MARKET, BY TYPE, 2021-2031(KILOTONS)
    TABLE 69. FRANCE LUBRICANT AND GREASE MARKET, TYPE, 2021-2031($MILLION)
    TABLE 70. FRANCE LUBRICANT AND GREASE MARKET, BY APPLICATION, 2021-2031(KILOTONS)
    TABLE 71. FRANCE LUBRICANT AND GREASE MARKET, BY APPLICATION, 2021-2031($MILLION)
    TABLE 72. SPAIN LUBRICANT AND GREASE MARKET, BY TYPE, 2021-2031(KILOTONS)
    TABLE 73. SPAIN LUBRICANT AND GREASE MARKET, TYPE, 2021-2031($MILLION)
    TABLE 74. SPAIN LUBRICANT AND GREASE MARKET, BY APPLICATION, 2021-2031(KILOTONS)
    TABLE 75. SPAIN LUBRICANT AND GREASE MARKET, BY APPLICATION, 2021-2031($MILLION)
    TABLE 76. ITALY LUBRICANT AND GREASE MARKET, BY TYPE, 2021-2031(KILOTONS)
    TABLE 77. ITALY LUBRICANT AND GREASE MARKET, TYPE, 2021-2031($MILLION)
    TABLE 78. ITALY LUBRICANT AND GREASE MARKET, BY APPLICATION, 2021-2031(KILOTONS)
    TABLE 79. ITALY LUBRICANT AND GREASE MARKET, BY APPLICATION, 2021-2031($MILLION)
    TABLE 80. REST OF EUROPE LUBRICANT AND GREASE MARKET, BY TYPE, 2021-2031(KILOTONS)
    TABLE 81. REST OF EUROPE LUBRICANT AND GREASE MARKET, TYPE, 2021-2031($MILLION)
    TABLE 82. REST OF EUROPE LUBRICANT AND GREASE MARKET, BY APPLICATION, 2021-2031(KILOTONS)
    TABLE 83. REST OF EUROPE LUBRICANT AND GREASE MARKET, BY APPLICATION, 2021-2031($MILLION)
    TABLE 84. ASIA-PACIFIC LUBRICANT AND GREASE MARKET, BY TYPE, 2021-2031(KILOTONS)
    TABLE 85. ASIA-PACIFIC LUBRICANT AND GREASE MARKET, TYPE, 2021-2031($MILLION)
    TABLE 86. ASIA-PACIFIC LUBRICANT AND GREASE MARKET, BY APPLICATION, 2021-2031(KILOTONS)
    TABLE 87. ASIA-PACIFIC LUBRICANT AND GREASE MARKET, BY APPLICATION, 2021-2031($MILLION)
    TABLE 88. ASIA-PACIFIC LUBRICANT AND GREASE MARKET, BY COUNTRY, 2021–2031 ($MILLION)
    TABLE 89. ASIA-PACIFIC LUBRICANT AND GREASE MARKET, BY COUNTRY, 2021–2031 (KILOTONS)
    TABLE 90. CHINA LUBRICANT AND GREASE MARKET, BY TYPE, 2021-2031(KILOTONS)
    TABLE 91. CHINA LUBRICANT AND GREASE MARKET, TYPE, 2021-2031($MILLION)
    TABLE 92. CHINA LUBRICANT AND GREASE MARKET, BY APPLICATION, 2021-2031(KILOTONS)
    TABLE 93. CHINA LUBRICANT AND GREASE MARKET, BY APPLICATION, 2021-2031($MILLION)
    TABLE 94. INDIA LUBRICANT AND GREASE MARKET, BY TYPE, 2021-2031(KILOTONS)
    TABLE 95. INDIA LUBRICANT AND GREASE MARKET, TYPE, 2021-2031($MILLION)
    TABLE 96. INDIA LUBRICANT AND GREASE MARKET, BY APPLICATION, 2021-2031(KILOTONS)
    TABLE 97. INDIA LUBRICANT AND GREASE MARKET, BY APPLICATION, 2021-2031($MILLION)
    TABLE 98. JAPAN LUBRICANT AND GREASE MARKET, BY TYPE, 2021-2031(KILOTONS)
    TABLE 99. JAPAN LUBRICANT AND GREASE MARKET, TYPE, 2021-2031($MILLION)
    TABLE 100. JAPAN LUBRICANT AND GREASE MARKET, BY APPLICATION, 2021-2031(KILOTONS)
    TABLE 101. JAPAN LUBRICANT AND GREASE MARKET, BY APPLICATION, 2021-2031($MILLION)
    TABLE 102. SOUTH KOREA LUBRICANT AND GREASE MARKET, BY TYPE, 2021-2031(KILOTONS)
    TABLE 103. SOUTH KOREA LUBRICANT AND GREASE MARKET, TYPE, 2021-2031($MILLION)
    TABLE 104. SOUTH KOREA LUBRICANT AND GREASE MARKET, BY APPLICATION, 2021-2031(KILOTONS)
    TABLE 105. SOUTH KOREA LUBRICANT AND GREASE MARKET, BY APPLICATION, 2021-2031($MILLION)
    TABLE 106. AUSTRALIA LUBRICANT AND GREASE MARKET, BY TYPE, 2021-2031(KILOTONS)
    TABLE 107. AUSTRALIA LUBRICANT AND GREASE MARKET, TYPE, 2021-2031($MILLION)
    TABLE 108. AUSTRALIA LUBRICANT AND GREASE MARKET, BY APPLICATION, 2021-2031(KILOTONS)
    TABLE 109. AUSTRALIA LUBRICANT AND GREASE MARKET, BY APPLICATION, 2021-2031($MILLION)
    TABLE 110. REST OF ASIA-PACIFIC LUBRICANT AND GREASE MARKET, BY TYPE, 2021-2031(KILOTONS)
    TABLE 111. REST OF ASIA-PACIFIC LUBRICANT AND GREASE MARKET, TYPE, 2021-2031($MILLION)
    TABLE 112. REST OF ASIA-PACIFIC LUBRICANT AND GREASE MARKET, BY APPLICATION, 2021-2031(KILOTONS)
    TABLE 113. REST OF ASIA-PACIFIC LUBRICANT AND GREASE MARKET, BY APPLICATION, 2021-2031($MILLION)
    TABLE 114. LATIN AMERICA LUBRICANT AND GREASE MARKET, BY TYPE, 2021-2031(KILOTONS)
    TABLE 115. LATIN AMERICA LUBRICANT AND GREASE MARKET, TYPE, 2021-2031($MILLION)
    TABLE 116. LATIN AMERICA LUBRICANT AND GREASE MARKET, BY APPLICATION, 2021-2031(KILOTONS)
    TABLE 117. LATIN AMERICA LUBRICANT AND GREASE MARKET, BY APPLICATION, 2021-2031($MILLION)
    TABLE 118. LATIN AMERICA LUBRICANT AND GREASE MARKET, BY COUNTRY, 2021–2031 ($MILLION)
    TABLE 119. LATIN AMERICA LUBRICANT AND GREASE MARKET, BY COUNTRY, 2021–2031 (KILOTONS)
    TABLE 120. BRAZIL LUBRICANT AND GREASE MARKET, BY TYPE, 2021-2031(KILOTONS)
    TABLE 121. BRAZIL LUBRICANT AND GREASE MARKET, TYPE, 2021-2031($MILLION)
    TABLE 122. BRAZIL LUBRICANT AND GREASE MARKET, BY APPLICATION, 2021-2031(KILOTONS)
    TABLE 123. BRAZIL LUBRICANT AND GREASE MARKET, BY APPLICATION, 2021-2031($MILLION)
    TABLE 124. ARGENTINA LUBRICANT AND GREASE MARKET, BY TYPE, 2021-2031(KILOTONS)
    TABLE 125. ARGENTINA LUBRICANT AND GREASE MARKET, TYPE, 2021-2031($MILLION)
    TABLE 126. ARGENTINA LUBRICANT AND GREASE MARKET, BY APPLICATION, 2021-2031(KILOTONS)
    TABLE 127. ARGENTINA LUBRICANT AND GREASE MARKET, BY APPLICATION, 2021-2031($MILLION)
    TABLE 128. REST OF LATIN AMERICA LUBRICANT AND GREASE MARKET, BY TYPE, 2021-2031(KILOTONS)
    TABLE 129. REST OF LATIN AMERICA LUBRICANT AND GREASE MARKET, TYPE, 2021-2031($MILLION)
    TABLE 130. REST OF LATIN AMERICA LUBRICANT AND GREASE MARKET, BY APPLICATION, 2021-2031(KILOTONS)
    TABLE 131. REST OF LATIN AMERICA LUBRICANT AND GREASE MARKET, BY APPLICATION, 2021-2031($MILLION)
    TABLE 132. MIDDLE EAST LUBRICANT AND GREASE MARKET, BY TYPE, 2021-2031(KILOTONS)
    TABLE 133. MIDDLE EAST LUBRICANT AND GREASE MARKET, TYPE, 2021-2031($MILLION)
    TABLE 134. MIDDLE EAST LUBRICANT AND GREASE MARKET, BY APPLICATION, 2021-2031(KILOTONS)
    TABLE 135. MIDDLE EAST LUBRICANT AND GREASE MARKET, BY APPLICATION, 2021-2031($MILLION)
    TABLE 136. MIDDLE EAST LUBRICANT AND GREASE MARKET, BY COUNTRY, 2021–2031 ($MILLION)
    TABLE 137. MIDDLE EAST LUBRICANT AND GREASE MARKET, BY COUNTRY, 2021–2031 (KILOTONS)
    TABLE 138. IRAN LUBRICANT AND GREASE MARKET, BY TYPE, 2021-2031(KILOTONS)
    TABLE 139. IRAN LUBRICANT AND GREASE MARKET, TYPE, 2021-2031($MILLION)
    TABLE 140. IRAN LUBRICANT AND GREASE MARKET, BY APPLICATION, 2021-2031(KILOTONS)
    TABLE 141. IRAN LUBRICANT AND GREASE MARKET, BY APPLICATION, 2021-2031($MILLION)
    TABLE 142. SAUDI ARABIA LUBRICANT AND GREASE MARKET, BY TYPE, 2021-2031(KILOTONS)
    TABLE 143. SAUDI ARABIA LUBRICANT AND GREASE MARKET, TYPE, 2021-2031($MILLION)
    TABLE 144. SAUDI ARABIA LUBRICANT AND GREASE MARKET, BY APPLICATION, 2021-2031(KILOTONS)
    TABLE 145. SAUDI ARABIA LUBRICANT AND GREASE MARKET, BY APPLICATION, 2021-2031($MILLION)
    TABLE 146. UAE LUBRICANT AND GREASE MARKET, BY TYPE, 2021-2031(KILOTONS)
    TABLE 147. UAE LUBRICANT AND GREASE MARKET, TYPE, 2021-2031($MILLION)
    TABLE 148. UAE LUBRICANT AND GREASE MARKET, BY APPLICATION, 2021-2031(KILOTONS)
    TABLE 149. UAE LUBRICANT AND GREASE MARKET, BY APPLICATION, 2021-2031($MILLION)
    TABLE 150. KUWAIT LUBRICANT AND GREASE MARKET, BY TYPE, 2021-2031(KILOTONS)
    TABLE 151. KUWAIT LUBRICANT AND GREASE MARKET, TYPE, 2021-2031($MILLION)
    TABLE 152. KUWAIT LUBRICANT AND GREASE MARKET, BY APPLICATION, 2021-2031(KILOTONS)
    TABLE 153. KUWAIT LUBRICANT AND GREASE MARKET, BY APPLICATION, 2021-2031($MILLION)
    TABLE 154. BAHRAIN LUBRICANT AND GREASE MARKET, BY TYPE, 2021-2031(KILOTONS)
    TABLE 155. BAHRAIN LUBRICANT AND GREASE MARKET, TYPE, 2021-2031($MILLION)
    TABLE 156. BAHRAIN LUBRICANT AND GREASE MARKET, BY APPLICATION, 2021-2031(KILOTONS)
    TABLE 157. BAHRAIN LUBRICANT AND GREASE MARKET, BY APPLICATION, 2021-2031($MILLION)
    TABLE 158. QATAR LUBRICANT AND GREASE MARKET, BY TYPE, 2021-2031(KILOTONS)
    TABLE 159. QATAR LUBRICANT AND GREASE MARKET, TYPE, 2021-2031($MILLION)
    TABLE 160. QATAR LUBRICANT AND GREASE MARKET, BY APPLICATION, 2021-2031(KILOTONS)
    TABLE 161. QATAR LUBRICANT AND GREASE MARKET, BY APPLICATION, 2021-2031($MILLION)
    TABLE 162. REST OF MIDDLE EAST LUBRICANT AND GREASE MARKET, BY TYPE, 2021-2031(KILOTONS)
    TABLE 163. REST OF MIDDLE EAST LUBRICANT AND GREASE MARKET, TYPE, 2021-2031($MILLION)
    TABLE 164. REST OF MIDDLE EAST LUBRICANT AND GREASE MARKET, BY APPLICATION, 2021-2031(KILOTONS)
    TABLE 165. REST OF MIDDLE EAST LUBRICANT AND GREASE MARKET, BY APPLICATION, 2021-2031($MILLION)
    TABLE 166. KEY EXPANSIONS (2018-2022)
    TABLE 167. KEY ACQUISITION (2018-2022)
    TABLE 168. ARMOR LUBRICANTS: COMPANY SNAPSHOT
    TABLE 169. ARMOR LUBRICANTS: PRODUCT PORTFOLIO
    TABLE 170. BEHRAN OIL: COMPANY SNAPSHOT
    TABLE 171. BEHRAN OIL: PRODUCT PORTFOLIO
    TABLE 172. EMARAT: COMPANY SNAPSHOT
    TABLE 173. EMARAT: PRODUCT PORTFOLIO
    TABLE 174. EXXON MOBIL: COMPANY SNAPSHOT
    TABLE 175. EXXON MOBIL: OPERATING SEGMENTS
    TABLE 176. EXXON MOBIL: PRODUCT PORTFOLIO
    TABLE 177. EXXON MOBIL: NET SALES (2019-2021) ($MILLION)
    TABLE 178. EXXON MOBIL.: KEY STRATEGIC MOVES AND DEVELOPMENTS
    TABLE 179. FUCHS: COMPANY SNAPSHOT
    TABLE 180. FUCHS: OPERATING SEGMENT
    TABLE 181. FUCHS: PRODUCT PORTFOLIO
    TABLE 182. FUCHS: NET SALES, 2019–2021 ($MILLION)
    TABLE 183. GULF OIL INTERNATIONAL: COMPANY SNAPSHOT
    TABLE 184. GULF OIL INTERNATIONAL: PRODUCT PORTFOLIO
    TABLE 185. GULF OIL INTERNATIONAL: NET SALES, 2018–2020 ($MILLION)
    TABLE 186. IDEMITSU KOSAN: COMPANY SNAPSHOT
    TABLE 187. IDEMITSU KOSAN: PRODUCT PORTFOLIO
    TABLE 188. IDEMITSU KOSAN: NET SALES, 2018–2020 ($MILLION)
    TABLE 189. PETROMIN: COMPANY SNAPSHOT
    TABLE 190. PETROMIN: PRODUCT PORTFOLIO
    TABLE 191. SHELL: COMPANY SNAPSHOT
    TABLE 192. SHELL: OPERATING SEGMENT
    TABLE 193. SHELL: PRODUCT PORTFOLIO
    TABLE 194. SHELL: NET SALES, 2019–2021 ($MILLION)
    TABLE 195. SHELL: KEY STRATEGIC MOVES AND DEVELOPMENTS
    TABLE 196. TOTALENERGIES: COMPANY SNAPSHOT
    TABLE 197. TOTALENERGIES: OPERATING SEGMENTS
    TABLE 198. TOTALENERGIES: PRODUCT PORTFOLIO
    TABLE 199. OVERALL FINANCIAL STATUS ($MILLION)
  • LIST OF FIGURES

  • FIGURE 01. LUBRICANT AND GREASE MARKET, BY SEGMENT, 2021-2031
    FIGURE 02. LUBRICANT AND GREASE MARKET, BY COUNTRY, 2021-2031
    FIGURE 03. TOP INVESTMENT POCKETS
    FIGURE 04. MODERATE- HIGH BARGAINING POWER OF SUPPLIERS
    FIGURE 05. HIGH BARGAINING POWER OF BUYERS
    FIGURE 06. MODERATE THREAT OF SUBSTITUTES
    FIGURE 07. MODERATE THREAT OF NEW ENTRANTS
    FIGURE 08. MODERATE COMPETITIVE RIVALRY
    FIGURE 09. MARKET DYNAMICS: MIDDLE EAST LUBRICANT AND GREASE MARKET
    FIGURE 10. LUBRICANT AND GREASE MARKET, BY TYPE, 2021-2031 ($MILLION)
    FIGURE 11. COMPARATIVE ANALYSIS OF LUBRICANT AND GREASE MARKET FOR HEAVY DUTY ENGINE OILS (HDEO), BY COUNTRY, 2021 & 2031 ($MILLION)
    FIGURE 12. COMPARATIVE ANALYSIS OF LUBRICANT AND GREASE MARKET FOR HYDRAULIC FLUIDS, BY COUNTRY, 2021 & 2031 ($MILLION)

    FIGURE 13. COMPARATIVE ANALYSIS OF LUBRICANT AND GREASE MARKET FOR PASSENGER CAR MOTOR OIL (PCMO), BY COUNTRY, 2021 & 2031 ($MILLION)
    FIGURE 14. COMPARATIVE ANALYSIS OF LUBRICANT AND GREASE MARKET FOR TURBINE OILS, BY COUNTRY, 2021 & 2031 ($MILLION)
    FIGURE 15. COMPARATIVE ANALYSIS OF LUBRICANT AND GREASE MARKET FOR GEAR OIL, BY COUNTRY, 2021 & 2031 ($MILLION)
    FIGURE 16. COMPARATIVE ANALYSIS OF LUBRICANT AND GREASE MARKET FOR GREASES, BY COUNTRY,2021 & 2031 ($MILLION)
    FIGURE 17. COMPARATIVE ANALYSIS OF LUBRICANT AND GREASE MARKET FOR COMPRESSOR OIL, BY COUNTRY, 2021 & 2031 ($MILLION)
    FIGURE 18. COMPARATIVE ANALYSIS OF LUBRICANT AND GREASE MARKET FOR OTHERS, BY COUNTRY, 2021 & 2031 ($MILLION)
    FIGURE 19. LUBRICANT AND GREASE MARKET, BY APPLICATION, 2021-2031 ($MILLION)
    FIGURE 20. COMPARATIVE ANALYSIS OF LUBRICANT AND GREASE MARKET, FOR POWER GENERATION, BY COUNTRY, 2021 & 2031 ($MILLION)
    FIGURE 21. COMPARATIVE ANALYSIS OF LUBRICANT AND GREASE MARKET, FOR AUTOMOTIVE, BY COUNTRY, 2021 & 2031 ($MILLION)
    FIGURE 22. COMPARATIVE ANALYSIS OF LUBRICANT AND GREASE MARKET, FOR HEAVY EQUIPMENT, BY COUNTRY, 2021 & 2031 ($MILLION)
    FIGURE 23. COMPARATIVE ANALYSIS OF LUBRICANT AND GREASE MARKET, FOR FOOD AND BEVERAGE, BY COUNTRY, 2021 & 2031 ($MILLION)
    FIGURE 24. COMPARATIVE ANALYSIS OF LUBRICANT AND GREASE MARKET, FOR CHEMICAL MANUFACTURING, BY COUNTRY, 2021 & 2031 ($MILLION)
    FIGURE 25. COMPARATIVE ANALYSIS OF LUBRICANT AND GREASE MARKET, FOR OTHERS, BY COUNTRY, 2021 & 2031 ($MILLION)
    FIGURE 26. LUBRICANT AND GREASE MARKET, BY REGION, 2022–2031 ($MILLION)
    FIGURE 27. U.S. LUBRICANT AND GREASE MARKET, 2021-2031($MILLION)
    FIGURE 28. CANADA LUBRICANT AND GREASE MARKET, 2021-2031($MILLION)
    FIGURE 29. MEXICO LUBRICANT AND GREASE MARKET, 2021-2031($MILLION)
    FIGURE 30. GERMANY LUBRICANT AND GREASE MARKET, 2021-2031($MILLION)
    FIGURE 31. UK LUBRICANT AND GREASE MARKET, 2021-2031($MILLION)
    FIGURE 32. FRANCE LUBRICANT AND GREASE MARKET, 2021-2031($MILLION)
    FIGURE 33. SPAIN LUBRICANT AND GREASE MARKET, 2021-2031($MILLION)
    FIGURE 34. ITALY LUBRICANT AND GREASE MARKET, 2021-2031($MILLION)
    FIGURE 35. REST OF EUROPE LUBRICANT AND GREASE MARKET, 2021-2031($MILLION)
    FIGURE 36. CHINA LUBRICANT AND GREASE MARKET, 2021-2031($MILLION)
    FIGURE 37. INDIA LUBRICANT AND GREASE MARKET, 2021-2031($MILLION)
    FIGURE 38. JAPAN LUBRICANT AND GREASE MARKET, 2021-2031($MILLION)
    FIGURE 39. SOUTH KOREA LUBRICANT AND GREASE MARKET, 2021-2031($MILLION)
    FIGURE 40. AUSTRALIA LUBRICANT AND GREASE MARKET, 2021-2031($MILLION)
    FIGURE 41. REST OF ASIA-PACIFIC LUBRICANT AND GREASE MARKET, 2021-2031($MILLION)
    FIGURE 42. BRAZIL LUBRICANT AND GREASE MARKET, 2021-2031($MILLION)
    FIGURE 43. ARGENTINA LUBRICANT AND GREASE MARKET, 2021-2031($MILLION)
    FIGURE 44. REST OF LATIN AMERICA LUBRICANT AND GREASE MARKET, 2021-2031($MILLION)
    FIGURE 45. IRAN LUBRICANT AND GREASE MARKET, 2021-2031($MILLION)
    FIGURE 46. SAUDI ARABIA LUBRICANT AND GREASE MARKET, 2021-2031($MILLION)
    FIGURE 47. UAE LUBRICANT AND GREASE MARKET, 2021-2031($MILLION)
    FIGURE 48. KUWAIT LUBRICANT AND GREASE MARKET, 2021-2031($MILLION)
    FIGURE 49. BAHRAIN LUBRICANT AND GREASE MARKET, 2021-2031($MILLION)
    FIGURE 50. QATAR LUBRICANT AND GREASE MARKET, 2021-2031($MILLION)
    FIGURE 51. REST OF LUBRICANT AND GREASE MARKET, 2021-2031($MILLION)
    FIGURE 52. MARKET PLAYER POSITIONING, 2021
    FIGURE 53. TOP WINNING STRATEGIES, BY YEAR, 2018–2022
    FIGURE 54. TOP WINNING STRATEGIES, BY DEVELOPMENT, 2018–2022 (%)
    FIGURE 55. TOP WINNING STRATEGIES, BY COMPANY, 2018–2022
    FIGURE 56. PRODUCT MAPPING OF TOP 10 PLAYERS
    FIGURE 57. COMPETITIVE HEATMAP OF KEY PLAYERS
    FIGURE 58. EXXON MOBIL: NET SALES, 2019–2021 ($MILLION)
    FIGURE 59. EXXON MOBIL: REVENUE SHARE BY SEGMENT, 2021 (%)
    FIGURE 60. EXXON MOBIL: REVENUE SHARE BY REGION, 2021 (%)
    FIGURE 61. FUCHS: NET SALES, 2019–2021 ($MILLION)
    FIGURE 62. FUCHS: REVENUE SHARE BY SEGMENT, 2021 (%)
    FIGURE 63. GULF OIL INTERNATIONAL: NET SALES, 2018–2020 ($MILLION)
    FIGURE 64. IDEMITSU KOSAN: NET SALES, 2018–2020 ($MILLION)
    FIGURE 65. SHELL: NET SALES, 2019–2021 ($MILLION)
    FIGURE 66. SHELL: REVENUE SHARE BY SEGMENT, 2021 (%)
    FIGURE 67. TOTALENERGIES: NET SALES, 2018-2020 ($MILLION)
    FIGURE 68. TOTALENERGIES: REVENUE SHARE BY SEGMENT, 2021 (%)


Major companies in the lubricant and grease market are running a consumer-centric business, which has led to a high level of innovations, in terms of distribution timeline reductions and enhanced accessibility of the products. Many manufacturers have established ground-level distribution channels with regional suppliers that enable them to focus on other aspects of the business, such as quality improvisation, product portfolio enhancement, thereby leaving distribution handling to dedicated sources with a broader reach and market knowledge.

The industry is characterized by a high number of new market entrants that are seeking to tap lucrative opportunities in the global market while existing players are entering into strategic collaborations to increase capacities & expand their reach into emerging markets. Joint venture, merger, and acquisition activities in the industry have increased significantly over the past decade. Companies constantly seek to establish long-term contract agreements with trusted partners for sustainable business operations globally.

PURCHASE OPTIONS

Call or Email us

U.S.-Canada Toll-free: +1-800-792-5285
Int'l : +1-503-894-6022
Europe : +44-845-528-1300
Email : help@alliedmarketresearch.com
 
FREQUENTLY ASKED QUESTIONS?

A. Rising demand for high-performance engines in the automotive industry and rapid innovations in lubricant manufacturing processes are key factors driving revenue growth of the global lubricants and grease market

A. The market players are adopting various growth strategies and also investing in R&D extensively to develop technically advanced unique products which are expected to drive the market size.

A. Asia-Pacific region will provide more business opportunities for lubricant and grease market in coming years

A. Armor Lubricants, Total, Petromin, Aljomaih And Shell Lubricating Oil Company Limited, Behran Oil Co., FUCHS, Exxon Mobil Corporation, GULF OIL Middle East Limited (GULF OIL International), Emarat, and Idemitsu Kosan Co., Ltd. are the top players in lubricant and grease market.

A. Power generation, automotive, heavy equipment, food & beverage, chemical manufacturing application are the potential customers of lubricant and grease industry

A. Multiple applications of lubricants and grease in the automotive sector are projected to propel the overall product demand during the forecast period.

Looking for Customization?

 Customization Request

Have a Question?

 Speak with Analyst

Any Confusion?

 Inquire Before Buying

Have a glance of the Report

  Request Sample
RELATED TAGS

Purchase Full Report of
Lubricant And Grease Market

Start reading instantly.
This Report and over 67,404+ more Reports, Available with Avenue Library. T&C*.

  • Online Only
  • $3,570
  • Online cloud access only
  • Restricted print, copy, paste & download
  • Read only
  • Free industry update
    (Within 180 days)
  • Free report update in next update cycle
    (Oct 2023 - Oct 2024)
  • Data Pack
  • $3,840
  • Restricted to one authorized user
  • One print only
  • Available in
    Excel
  • Free industry update
    (Within 180 days)
  •   Free report update in next update cycle
    (Oct 2023 - Oct 2024)
  • Single User
  • $5,730
  • Restricted to one authorized user
  • One print only
  • Available in
    PDF
  • Free industry update
    (Within 180 days)
  •   Free report update in next update cycle
    (Oct 2023 - Oct 2024)
  • Five Users
  • $6,450
  • Limited to five authorized users
  • Print upto five copies
  • Available in
    PDF
  • Free industry update
    (Within 180 days)
  •   Free report update in next update cycle
    (Oct 2023 - Oct 2024)
  • Enterprise
    License/PDF

  • $9,600
  • Unlimited
    within
    company/enterprise
  • Available in Excel & PDF
  • Free industry update
    (Within 180 days)
  •   Free report update in next update cycle
    (Oct 2023 - Oct 2024)
  • Library
    Membership

  • $999 $ 1,175
    Per User/ Per month/ Billed annually
  • Published Content
    E-access
  • Company Profiles
    E-access
  • Newly Added Content Access
  • 10 PDF
    Downloads
  • 5 Excel Data
    Pack Downloads
  • 250 Company Profiles PDF Downloads
  • Buy Now

*Taxes/Fees, if applicable will be added during checkout. All prices in USD

RELATED REPORTS
 

Why Allied Market Research?


Infallible Methodology

To ensure high-level data integrity, accurate analysis, and impeccable forecasts

Analyst Support

For complete satisfaction

Customization

On-demand customization of scope of the report to exactly meet your needs

TARGETED MARKET VIEW

Targeted market view to provide pertinent information and save time of readers

Get fresh content delivered

Get insights on topics that are crucial for your business. Stay abreast of your interest areas.

Get Industry Data Alerts

Why Allied Market Research?

Infallible Methodology

To ensure high-level data integrity, accurate analysis, and impeccable forecasts

Analyst Support

For complete satisfaction

Customization

On-demand customization of scope of the report to exactly meet your needs

TARGETED MARKET VIEW

Targeted market view to provide pertinent information and save time of readers