0
New
New
2023
Lung Monitoring Devices Market

Lung Monitoring Devices Market

by Product Type (Spirometers, Pulse Oximeters, Capnographs, Others), by End User (Hospitals, Homecare, Others): Global Opportunity Analysis and Industry Forecast, 2023-2032

Report Code: A12055
Jun 2023 | Pages: 224
Tables: 104
Charts: 69
  • Formats*:

  • pdf

    Single User License, Five User
    License & Enterprise User License

  • xls

    Data Pack Excel License

  • ppt

    It comes with the additional cost
    of $2500.00 contact sales.


Lung Monitoring Devices Market Research, 2032

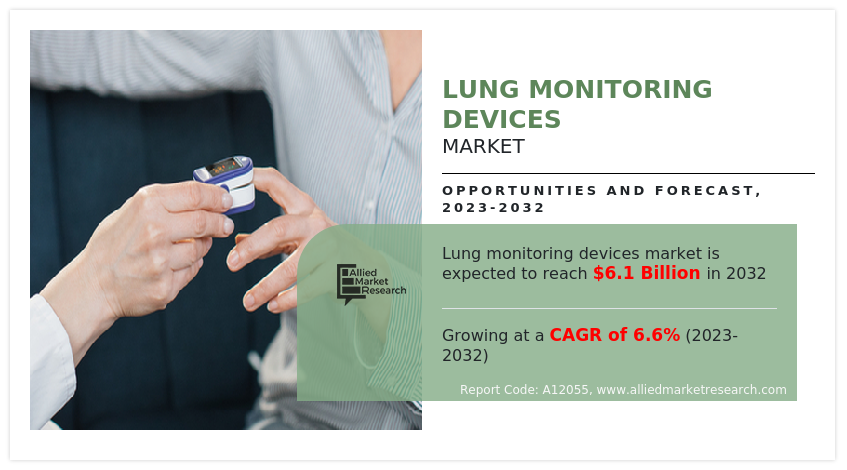
The global lung monitoring devices market was valued at $3.3 billion in 2022, and is projected to reach $6.1 billion by 2032, growing at a CAGR of 6.6% from 2023 to 2032. Lung monitoring device is used to measure, record, distribute, and display the values, which indicate the health of the lungs. It is commonly used for the diseases such as bronchitis, asthma, and chronic obstructive pulmonary disease (COPD). It uses the technique of controlled pressure to increase blood flow in the legs. Various devices such as pulse spirometers, pulse oximeters, peak flow meters, and capnography are used for the lung monitoring. A spirometer is an apparatus for measuring the volume of air inhaled and exhaled by the lungs in one respiratory cycle. A spirometer measures ventilation, i.e., the movement of air in and out of lungs. The spirogram will identify two different types of abnormal ventilation patterns, obstructive and restrictive.

The COVID-19 pandemic had a positive impact on the lung monitoring devices market. This is attributed to the fact that the COVID-19 infection mainly affects the respiratory system, hence, the demand for lung monitoring devices increased considerably. Moreover, huge incline in the hospitalization of people boosted the demand for lung monitoring devices such as pulse oximeter and spirometers. Furthermore, post pandemic, many companies developed portable and cost-effective lung monitoring devices, which is contributing toward the market growth.

Lung Monitoring Devices Market

Market Dynamics

Innovations in the medical devices industry for the adoption of lung monitoring devices for lung monitoring are majorly driven by rise in prevalence of lung diseases such as asthma and COPD. Moreover, rise in number of patients suffering from respiratory diseases is expected to creates remunerative opportunities for the expansion of the Lung Monitoring Devices Market Size. In addition, key players are adopting various strategies such as product launch, product approval, agreements, partnerships, and collaborations to strengthen their foothold in the market. For instance, in April 2021, Masimo, received FDA clearance of Radius PCG for the root patient monitoring and connectivity platform. Radius PCG connects with the root patient monitoring and connectivity platform to provide seamless, tetherless mainstream capnography for patients of all ages.

The demand for lung monitoring devices is not only limited to developed countries but is also being witnessed in the developing countries, such as China, Brazil, and India, which fuels the Lung Monitoring Devices Market Growth. Factors such as rise in hospital admissions, increase in number of surgeries,  and surge in awareness toward the advantages of early diagnosis of lung diseases drive the growth of the market.

Furthermore, rise in air pollution levels due to burning fossil fuels, vehicle exhaust fumes, and emissions from agriculture and industry triggers the prevalence of respiratory diseases. Thus, increase in the prevalence of respiratory disorders drives the Lung Monitoring Devices Industrygrowth. In addition, increase in research activities by manufacturers for developing advanced lung monitoring devices is expected to fuel the growth of the industry. However, lack of awareness about lung disorders is hampering Lung Monitoring Devices Industry growth.

The lung monitoring devices market is segmented into End User and Product Type.

Segmental Overview

The global lung monitoring devices market is segmented into product type, end user, and region. By product type, the Lung Monitoring Devices Market Size is classified into spirometers, pulse oximeters, capnography, and others. Depending on end user, it is classified into hospitals, homecare and others. Region wise, the market is studied across North America (the U.S., Canada, and Mexico), Europe (Germany, France, UK, Italy, Spain, and rest of Europe), Asia-Pacific (Japan, China, Australia, India, South Korea, and rest of Asia-Pacific), and LAMEA (Brazil, South Africa, Saudi Arabia, and rest of LAMEA).

By Product Type

On the basis of the product type, the market is classified into spirometers, pulse oximeters, capnographs, and others. The spirometers devices segment dominated the global Lung Monitoring Devices Market Share in 2022 and is expected to remain dominant throughout the Lung Monitoring Devices Market Forecast period owing to an increase in the prevalence of asthma and a rise in demand for lung monitoring devices among the patient population. Moreover, surge in geriatric population is anticipated to boost the demand for lung monitoring devices. This is attributed to the fact that aged individuals are highly susceptible to respiratory diseases.

Lung Monitoring Devices Market

By End User

Based on end user, the market is divided into hospitals, homecare, and others. The hospitals segment dominated the global Lung Monitoring Devices Market Share in 2022 and is anticipated to continue this trend during the forecast period. This is attributed to increase in the adoption of lung monitoring devices in hospitals for diagnosis and monitoring. In addition, an increase in the number of surgeries in hospitals drives the growth of the market as the lung monitoring devices such as gas analyzers and capnographs used during surgery. Moreover, improvements in the healthcare infrastructure is expected to propel the growth of the market.

Lung Monitoring Devices Market

By Region

By region, the lung monitoring devices market is analyzed across North America, Europe, Asia-Pacific, and LAMEA. In 2022, North America was the dominant region and is expected to continue this trend throughout the forecast period owing to high prevalence of respiratory disorders such as asthma and bronchitis, strong presence of key players, and surge in number of devices available in the region. However, Asia-Pacific is expected to witness the highest CAGR during the analysis period, owing to the presence of high populace countries such as India and China, which, in turn, increases the prevalence of respiratory disorders and the growing number of strategies and trends adopted by the market players that include product development, product approval, partnership, collaboration, and agreement.  

Lung Monitoring Devices Market

COMPETITION ANALYSIS

Competitive analysis and profiles of the major players in the lung monitoring devices market such as GE Healthcare, Hill-Rom, Inc., Koninklijke Philips N.V., Masimo, Medtronic, Nihon Kohden Corporation, Resmed Inc., Smiths Medical, Vitalograph Ltd., and Vyaire Medical are provided in this report. These players have adopted product launch and product development as key developmental strategies to improve the product portfolio of lung monitoring devices.  

Product Approval

Masimo has announced FDA Clearance of Radius PCG for the Root Patient Monitoring and Connectivity Platform.

Medtronic plc, announced that the U.S. Food and Drug Administration (FDA) granted 510(k) clearance for the Nellcor OxySoft SpO2 sensor.

Key Benefits For Stakeholders

  • This report provides a quantitative analysis of the market segments, current trends, estimations, and dynamics of the lung monitoring devices market analysis from 2022 to 2032 to identify the prevailing Lung Monitoring Devices Market Opportunity.
  • The market research is offered along with information related to key drivers, restraints, and opportunities.
  • Porter's five forces analysis highlights the potency of buyers and suppliers to enable stakeholders make profit-oriented business decisions and strengthen their supplier-buyer network.
  • In-depth analysis of the lung monitoring devices market segmentation assists to determine the prevailing market opportunities.
  • Major countries in each region are mapped according to their revenue contribution to the global market.
  • Market player positioning facilitates benchmarking and provides a clear understanding of the present position of the market players.
  • The report includes the analysis of the regional as well as global lung monitoring devices market trends, key players, market segments, application areas, and market growth strategies.

Lung Monitoring Devices Market Report Highlights

Aspects Details
Market Size By 2032 USD 6.1 billion
Growth Rate CAGR of 6.6%
Forecast period 2022 - 2032
Report Pages 224
By End User
  • Hospitals
  • Homecare
  • Others
By Product Type
  • Pulse Oximeters
    • Type
      • Bedside Pulse Oximeter
      • Fingertip Pulse Oximeter
      • Hand held Pulse Oximeter
      • Wrist worn Pulse Oximeter
      • Pediatric Pulse Oximeter
  • Capnographs
  • Others
  • Spirometers
    • Type
      • Hand-Held
      • Table-Top
By Region
  • North America  (U.S., Canada, Mexico)
  • Europe  (Germany, France, UK, Italy, Spain, Rest of Europe)
  • Asia-Pacific  (China, Japan, India, Australia, South Korea, Rest of Asia-Pacific)
  • LAMEA  (Brazil, Saudi Arabia, South Africa, Rest of LAMEA)
Key Market Players ResMed Inc., Vyaire Medical, Inc., Becton, Dickinson and Company, Teleflex Incorporated., Medtronic plc, Nihon Kohden Corporation, Masimo Corporation, ICU Medical Inc., Koninklijke Philips N.V., Baxter International Inc.

Analyst Review

This section provides opinions of the top-level CXOs in the lung monitoring devices market. In accordance with several interviews conducted, lung monitoring devices are gaining high traction due alarming increase in air pollution owing to industrialization, burning of fossil fuels, and transportation. Furthermore, increase in the prevalence of lung diseases such as asthma and chronic obstructive pulmonary disease (COPD) contributes to the growth of market. Moreover, growing awareness for respiratory diseases, government initiatives for the early diagnosis of lung disorders, and advancements in the lung monitoring device drive the growth of market.

The CXOs further added that Asia-Pacific serve as the potential market for lung monitoring devices owing the increase in the R&D expenditure for advancements in lung monitoring devices, rise in number of surgeries, and increase in government support for spread awareness about the benefits of lung monitoring devices. However, lack of awareness regarding respiratory diseases hampers the growth of the market.

 
  • CHAPTER 1: INTRODUCTION

    • 1.1. Report description

    • 1.2. Key market segments

    • 1.3. Key benefits to the stakeholders

    • 1.4. Research Methodology

      • 1.4.1. Primary research

      • 1.4.2. Secondary research

      • 1.4.3. Analyst tools and models

  • CHAPTER 2: EXECUTIVE SUMMARY

    • 2.1. CXO Perspective

  • CHAPTER 3: MARKET OVERVIEW

    • 3.1. Market definition and scope

    • 3.2. Key findings

      • 3.2.1. Top impacting factors

      • 3.2.2. Top investment pockets

    • 3.3. Porter’s five forces analysis

      • 3.3.1. Moderate bargaining power of suppliers

      • 3.3.2. Moderate threat of new entrants

      • 3.3.3. Moderate threat of substitutes

      • 3.3.4. Moderate intensity of rivalry

      • 3.3.5. Moderate bargaining power of buyers

    • 3.4. Market dynamics

      • 3.4.1. Drivers

        • 3.4.1.1. Upsurge in geriatric population
        • 3.4.1.2. Rise in incidence of respiratory diseases
        • 3.4.1.3. Rapid technological advancements

      • 3.4.2. Restraints

        • 3.4.2.1. Lack of awareness regarding respiratory diseases

      • 3.4.3. Opportunities

        • 3.4.3.1. Rise in preference for home healthcare

    • 3.5. COVID-19 Impact Analysis on the market

  • CHAPTER 4: LUNG MONITORING DEVICES MARKET, BY PRODUCT TYPE

    • 4.1. Overview

      • 4.1.1. Market size and forecast

    • 4.2. Spirometers

      • 4.2.1. Key market trends, growth factors and opportunities

      • 4.2.2. Market size and forecast, by region

      • 4.2.3. Market share analysis by country

      • 4.2.4. Spirometers Lung Monitoring Devices Market by Type

    • 4.3. Pulse Oximeters

      • 4.3.1. Key market trends, growth factors and opportunities

      • 4.3.2. Market size and forecast, by region

      • 4.3.3. Market share analysis by country

      • 4.3.4. Pulse Oximeters Lung Monitoring Devices Market by Type

    • 4.4. Capnographs

      • 4.4.1. Key market trends, growth factors and opportunities

      • 4.4.2. Market size and forecast, by region

      • 4.4.3. Market share analysis by country

    • 4.5. Others

      • 4.5.1. Key market trends, growth factors and opportunities

      • 4.5.2. Market size and forecast, by region

      • 4.5.3. Market share analysis by country

  • CHAPTER 5: LUNG MONITORING DEVICES MARKET, BY END USER

    • 5.1. Overview

      • 5.1.1. Market size and forecast

    • 5.2. Hospitals

      • 5.2.1. Key market trends, growth factors and opportunities

      • 5.2.2. Market size and forecast, by region

      • 5.2.3. Market share analysis by country

    • 5.3. Homecare

      • 5.3.1. Key market trends, growth factors and opportunities

      • 5.3.2. Market size and forecast, by region

      • 5.3.3. Market share analysis by country

    • 5.4. Others

      • 5.4.1. Key market trends, growth factors and opportunities

      • 5.4.2. Market size and forecast, by region

      • 5.4.3. Market share analysis by country

  • CHAPTER 6: LUNG MONITORING DEVICES MARKET, BY REGION

    • 6.1. Overview

      • 6.1.1. Market size and forecast By Region

    • 6.2. North America

      • 6.2.1. Key trends and opportunities

      • 6.2.2. Market size and forecast, by Product Type

      • 6.2.3. Market size and forecast, by End User

      • 6.2.4. Market size and forecast, by country

        • 6.2.4.1. U.S.
          • 6.2.4.1.1. Key market trends, growth factors and opportunities
          • 6.2.4.1.2. Market size and forecast, by Product Type
          • 6.2.4.1.3. Market size and forecast, by End User
        • 6.2.4.2. Canada
          • 6.2.4.2.1. Key market trends, growth factors and opportunities
          • 6.2.4.2.2. Market size and forecast, by Product Type
          • 6.2.4.2.3. Market size and forecast, by End User
        • 6.2.4.3. Mexico
          • 6.2.4.3.1. Key market trends, growth factors and opportunities
          • 6.2.4.3.2. Market size and forecast, by Product Type
          • 6.2.4.3.3. Market size and forecast, by End User
    • 6.3. Europe

      • 6.3.1. Key trends and opportunities

      • 6.3.2. Market size and forecast, by Product Type

      • 6.3.3. Market size and forecast, by End User

      • 6.3.4. Market size and forecast, by country

        • 6.3.4.1. Germany
          • 6.3.4.1.1. Key market trends, growth factors and opportunities
          • 6.3.4.1.2. Market size and forecast, by Product Type
          • 6.3.4.1.3. Market size and forecast, by End User
        • 6.3.4.2. France
          • 6.3.4.2.1. Key market trends, growth factors and opportunities
          • 6.3.4.2.2. Market size and forecast, by Product Type
          • 6.3.4.2.3. Market size and forecast, by End User
        • 6.3.4.3. UK
          • 6.3.4.3.1. Key market trends, growth factors and opportunities
          • 6.3.4.3.2. Market size and forecast, by Product Type
          • 6.3.4.3.3. Market size and forecast, by End User
        • 6.3.4.4. Italy
          • 6.3.4.4.1. Key market trends, growth factors and opportunities
          • 6.3.4.4.2. Market size and forecast, by Product Type
          • 6.3.4.4.3. Market size and forecast, by End User
        • 6.3.4.5. Spain
          • 6.3.4.5.1. Key market trends, growth factors and opportunities
          • 6.3.4.5.2. Market size and forecast, by Product Type
          • 6.3.4.5.3. Market size and forecast, by End User
        • 6.3.4.6. Rest of Europe
          • 6.3.4.6.1. Key market trends, growth factors and opportunities
          • 6.3.4.6.2. Market size and forecast, by Product Type
          • 6.3.4.6.3. Market size and forecast, by End User
    • 6.4. Asia-Pacific

      • 6.4.1. Key trends and opportunities

      • 6.4.2. Market size and forecast, by Product Type

      • 6.4.3. Market size and forecast, by End User

      • 6.4.4. Market size and forecast, by country

        • 6.4.4.1. China
          • 6.4.4.1.1. Key market trends, growth factors and opportunities
          • 6.4.4.1.2. Market size and forecast, by Product Type
          • 6.4.4.1.3. Market size and forecast, by End User
        • 6.4.4.2. Japan
          • 6.4.4.2.1. Key market trends, growth factors and opportunities
          • 6.4.4.2.2. Market size and forecast, by Product Type
          • 6.4.4.2.3. Market size and forecast, by End User
        • 6.4.4.3. India
          • 6.4.4.3.1. Key market trends, growth factors and opportunities
          • 6.4.4.3.2. Market size and forecast, by Product Type
          • 6.4.4.3.3. Market size and forecast, by End User
        • 6.4.4.4. Australia
          • 6.4.4.4.1. Key market trends, growth factors and opportunities
          • 6.4.4.4.2. Market size and forecast, by Product Type
          • 6.4.4.4.3. Market size and forecast, by End User
        • 6.4.4.5. South Korea
          • 6.4.4.5.1. Key market trends, growth factors and opportunities
          • 6.4.4.5.2. Market size and forecast, by Product Type
          • 6.4.4.5.3. Market size and forecast, by End User
        • 6.4.4.6. Rest of Asia-Pacific
          • 6.4.4.6.1. Key market trends, growth factors and opportunities
          • 6.4.4.6.2. Market size and forecast, by Product Type
          • 6.4.4.6.3. Market size and forecast, by End User
    • 6.5. LAMEA

      • 6.5.1. Key trends and opportunities

      • 6.5.2. Market size and forecast, by Product Type

      • 6.5.3. Market size and forecast, by End User

      • 6.5.4. Market size and forecast, by country

        • 6.5.4.1. Brazil
          • 6.5.4.1.1. Key market trends, growth factors and opportunities
          • 6.5.4.1.2. Market size and forecast, by Product Type
          • 6.5.4.1.3. Market size and forecast, by End User
        • 6.5.4.2. Saudi Arabia
          • 6.5.4.2.1. Key market trends, growth factors and opportunities
          • 6.5.4.2.2. Market size and forecast, by Product Type
          • 6.5.4.2.3. Market size and forecast, by End User
        • 6.5.4.3. South Africa
          • 6.5.4.3.1. Key market trends, growth factors and opportunities
          • 6.5.4.3.2. Market size and forecast, by Product Type
          • 6.5.4.3.3. Market size and forecast, by End User
        • 6.5.4.4. Rest of LAMEA
          • 6.5.4.4.1. Key market trends, growth factors and opportunities
          • 6.5.4.4.2. Market size and forecast, by Product Type
          • 6.5.4.4.3. Market size and forecast, by End User
  • CHAPTER 7: COMPETITIVE LANDSCAPE

    • 7.1. Introduction

    • 7.2. Top winning strategies

    • 7.3. Product Mapping of Top 10 Player

    • 7.4. Competitive Dashboard

    • 7.5. Competitive Heatmap

    • 7.6. Top player positioning, 2022

  • CHAPTER 8: COMPANY PROFILES

    • 8.1. Koninklijke Philips N.V.

      • 8.1.1. Company overview

      • 8.1.2. Key Executives

      • 8.1.3. Company snapshot

      • 8.1.4. Operating business segments

      • 8.1.5. Product portfolio

      • 8.1.6. Business performance

    • 8.2. Masimo Corporation

      • 8.2.1. Company overview

      • 8.2.2. Key Executives

      • 8.2.3. Company snapshot

      • 8.2.4. Operating business segments

      • 8.2.5. Product portfolio

      • 8.2.6. Business performance

      • 8.2.7. Key strategic moves and developments

    • 8.3. Medtronic plc

      • 8.3.1. Company overview

      • 8.3.2. Key Executives

      • 8.3.3. Company snapshot

      • 8.3.4. Operating business segments

      • 8.3.5. Product portfolio

      • 8.3.6. Business performance

      • 8.3.7. Key strategic moves and developments

    • 8.4. Nihon Kohden Corporation

      • 8.4.1. Company overview

      • 8.4.2. Key Executives

      • 8.4.3. Company snapshot

      • 8.4.4. Operating business segments

      • 8.4.5. Product portfolio

      • 8.4.6. Business performance

    • 8.5. ResMed Inc.

      • 8.5.1. Company overview

      • 8.5.2. Key Executives

      • 8.5.3. Company snapshot

      • 8.5.4. Operating business segments

      • 8.5.5. Product portfolio

      • 8.5.6. Business performance

    • 8.6. ICU Medical Inc.

      • 8.6.1. Company overview

      • 8.6.2. Key Executives

      • 8.6.3. Company snapshot

      • 8.6.4. Operating business segments

      • 8.6.5. Product portfolio

      • 8.6.6. Business performance

    • 8.7. Vyaire Medical, Inc.

      • 8.7.1. Company overview

      • 8.7.2. Key Executives

      • 8.7.3. Company snapshot

      • 8.7.4. Operating business segments

      • 8.7.5. Product portfolio

    • 8.8. Becton, Dickinson and Company

      • 8.8.1. Company overview

      • 8.8.2. Key Executives

      • 8.8.3. Company snapshot

      • 8.8.4. Operating business segments

      • 8.8.5. Product portfolio

      • 8.8.6. Business performance

    • 8.9. Teleflex Incorporated.

      • 8.9.1. Company overview

      • 8.9.2. Key Executives

      • 8.9.3. Company snapshot

      • 8.9.4. Operating business segments

      • 8.9.5. Product portfolio

      • 8.9.6. Business performance

    • 8.10. Baxter International Inc.

      • 8.10.1. Company overview

      • 8.10.2. Key Executives

      • 8.10.3. Company snapshot

      • 8.10.4. Operating business segments

      • 8.10.5. Product portfolio

      • 8.10.6. Business performance

  • LIST OF TABLES

  • TABLE 01. GLOBAL LUNG MONITORING DEVICES MARKET, BY PRODUCT TYPE, 2022-2032 ($MILLION)
    TABLE 02. LUNG MONITORING DEVICES MARKET FOR SPIROMETERS, BY REGION, 2022-2032 ($MILLION)
    TABLE 03. GLOBAL SPIROMETERS LUNG MONITORING DEVICES MARKET, BY TYPE, 2022-2032 ($MILLION)
    TABLE 04. LUNG MONITORING DEVICES MARKET FOR PULSE OXIMETERS, BY REGION, 2022-2032 ($MILLION)
    TABLE 05. GLOBAL PULSE OXIMETERS LUNG MONITORING DEVICES MARKET, BY TYPE, 2022-2032 ($MILLION)
    TABLE 06. LUNG MONITORING DEVICES MARKET FOR CAPNOGRAPHS, BY REGION, 2022-2032 ($MILLION)
    TABLE 07. LUNG MONITORING DEVICES MARKET FOR OTHERS, BY REGION, 2022-2032 ($MILLION)
    TABLE 08. GLOBAL LUNG MONITORING DEVICES MARKET, BY END USER, 2022-2032 ($MILLION)
    TABLE 09. LUNG MONITORING DEVICES MARKET FOR HOSPITALS, BY REGION, 2022-2032 ($MILLION)
    TABLE 10. LUNG MONITORING DEVICES MARKET FOR HOMECARE, BY REGION, 2022-2032 ($MILLION)
    TABLE 11. LUNG MONITORING DEVICES MARKET FOR OTHERS, BY REGION, 2022-2032 ($MILLION)
    TABLE 12. LUNG MONITORING DEVICES MARKET, BY REGION, 2022-2032 ($MILLION)
    TABLE 13. NORTH AMERICA LUNG MONITORING DEVICES MARKET, BY PRODUCT TYPE, 2022-2032 ($MILLION)
    TABLE 14. NORTH AMERICA LUNG MONITORING DEVICES MARKET, BY END USER, 2022-2032 ($MILLION)
    TABLE 15. NORTH AMERICA LUNG MONITORING DEVICES MARKET, BY COUNTRY, 2022-2032 ($MILLION)
    TABLE 16. U.S. LUNG MONITORING DEVICES MARKET, BY PRODUCT TYPE, 2022-2032 ($MILLION)
    TABLE 17. U.S. LUNG MONITORING DEVICES MARKET, BY END USER, 2022-2032 ($MILLION)
    TABLE 18. CANADA LUNG MONITORING DEVICES MARKET, BY PRODUCT TYPE, 2022-2032 ($MILLION)
    TABLE 19. CANADA LUNG MONITORING DEVICES MARKET, BY END USER, 2022-2032 ($MILLION)
    TABLE 20. MEXICO LUNG MONITORING DEVICES MARKET, BY PRODUCT TYPE, 2022-2032 ($MILLION)
    TABLE 21. MEXICO LUNG MONITORING DEVICES MARKET, BY END USER, 2022-2032 ($MILLION)
    TABLE 22. EUROPE LUNG MONITORING DEVICES MARKET, BY PRODUCT TYPE, 2022-2032 ($MILLION)
    TABLE 23. EUROPE LUNG MONITORING DEVICES MARKET, BY END USER, 2022-2032 ($MILLION)
    TABLE 24. EUROPE LUNG MONITORING DEVICES MARKET, BY COUNTRY, 2022-2032 ($MILLION)
    TABLE 25. GERMANY LUNG MONITORING DEVICES MARKET, BY PRODUCT TYPE, 2022-2032 ($MILLION)
    TABLE 26. GERMANY LUNG MONITORING DEVICES MARKET, BY END USER, 2022-2032 ($MILLION)
    TABLE 27. FRANCE LUNG MONITORING DEVICES MARKET, BY PRODUCT TYPE, 2022-2032 ($MILLION)
    TABLE 28. FRANCE LUNG MONITORING DEVICES MARKET, BY END USER, 2022-2032 ($MILLION)
    TABLE 29. UK LUNG MONITORING DEVICES MARKET, BY PRODUCT TYPE, 2022-2032 ($MILLION)
    TABLE 30. UK LUNG MONITORING DEVICES MARKET, BY END USER, 2022-2032 ($MILLION)
    TABLE 31. ITALY LUNG MONITORING DEVICES MARKET, BY PRODUCT TYPE, 2022-2032 ($MILLION)
    TABLE 32. ITALY LUNG MONITORING DEVICES MARKET, BY END USER, 2022-2032 ($MILLION)
    TABLE 33. SPAIN LUNG MONITORING DEVICES MARKET, BY PRODUCT TYPE, 2022-2032 ($MILLION)
    TABLE 34. SPAIN LUNG MONITORING DEVICES MARKET, BY END USER, 2022-2032 ($MILLION)
    TABLE 35. REST OF EUROPE LUNG MONITORING DEVICES MARKET, BY PRODUCT TYPE, 2022-2032 ($MILLION)
    TABLE 36. REST OF EUROPE LUNG MONITORING DEVICES MARKET, BY END USER, 2022-2032 ($MILLION)
    TABLE 37. ASIA-PACIFIC LUNG MONITORING DEVICES MARKET, BY PRODUCT TYPE, 2022-2032 ($MILLION)
    TABLE 38. ASIA-PACIFIC LUNG MONITORING DEVICES MARKET, BY END USER, 2022-2032 ($MILLION)
    TABLE 39. ASIA-PACIFIC LUNG MONITORING DEVICES MARKET, BY COUNTRY, 2022-2032 ($MILLION)
    TABLE 40. CHINA LUNG MONITORING DEVICES MARKET, BY PRODUCT TYPE, 2022-2032 ($MILLION)
    TABLE 41. CHINA LUNG MONITORING DEVICES MARKET, BY END USER, 2022-2032 ($MILLION)
    TABLE 42. JAPAN LUNG MONITORING DEVICES MARKET, BY PRODUCT TYPE, 2022-2032 ($MILLION)
    TABLE 43. JAPAN LUNG MONITORING DEVICES MARKET, BY END USER, 2022-2032 ($MILLION)
    TABLE 44. INDIA LUNG MONITORING DEVICES MARKET, BY PRODUCT TYPE, 2022-2032 ($MILLION)
    TABLE 45. INDIA LUNG MONITORING DEVICES MARKET, BY END USER, 2022-2032 ($MILLION)
    TABLE 46. AUSTRALIA LUNG MONITORING DEVICES MARKET, BY PRODUCT TYPE, 2022-2032 ($MILLION)
    TABLE 47. AUSTRALIA LUNG MONITORING DEVICES MARKET, BY END USER, 2022-2032 ($MILLION)
    TABLE 48. SOUTH KOREA LUNG MONITORING DEVICES MARKET, BY PRODUCT TYPE, 2022-2032 ($MILLION)
    TABLE 49. SOUTH KOREA LUNG MONITORING DEVICES MARKET, BY END USER, 2022-2032 ($MILLION)
    TABLE 50. REST OF ASIA-PACIFIC LUNG MONITORING DEVICES MARKET, BY PRODUCT TYPE, 2022-2032 ($MILLION)
    TABLE 51. REST OF ASIA-PACIFIC LUNG MONITORING DEVICES MARKET, BY END USER, 2022-2032 ($MILLION)
    TABLE 52. LAMEA LUNG MONITORING DEVICES MARKET, BY PRODUCT TYPE, 2022-2032 ($MILLION)
    TABLE 53. LAMEA LUNG MONITORING DEVICES MARKET, BY END USER, 2022-2032 ($MILLION)
    TABLE 54. LAMEA LUNG MONITORING DEVICES MARKET, BY COUNTRY, 2022-2032 ($MILLION)
    TABLE 55. BRAZIL LUNG MONITORING DEVICES MARKET, BY PRODUCT TYPE, 2022-2032 ($MILLION)
    TABLE 56. BRAZIL LUNG MONITORING DEVICES MARKET, BY END USER, 2022-2032 ($MILLION)
    TABLE 57. SAUDI ARABIA LUNG MONITORING DEVICES MARKET, BY PRODUCT TYPE, 2022-2032 ($MILLION)
    TABLE 58. SAUDI ARABIA LUNG MONITORING DEVICES MARKET, BY END USER, 2022-2032 ($MILLION)
    TABLE 59. SOUTH AFRICA LUNG MONITORING DEVICES MARKET, BY PRODUCT TYPE, 2022-2032 ($MILLION)
    TABLE 60. SOUTH AFRICA LUNG MONITORING DEVICES MARKET, BY END USER, 2022-2032 ($MILLION)
    TABLE 61. REST OF LAMEA LUNG MONITORING DEVICES MARKET, BY PRODUCT TYPE, 2022-2032 ($MILLION)
    TABLE 62. REST OF LAMEA LUNG MONITORING DEVICES MARKET, BY END USER, 2022-2032 ($MILLION)
    TABLE 63. KONINKLIJKE PHILIPS N.V.: KEY EXECUTIVES
    TABLE 64. KONINKLIJKE PHILIPS N.V.: COMPANY SNAPSHOT
    TABLE 65. KONINKLIJKE PHILIPS N.V.: PRODUCT SEGMENTS
    TABLE 66. KONINKLIJKE PHILIPS N.V.: PRODUCT PORTFOLIO
    TABLE 67. MASIMO CORPORATION: KEY EXECUTIVES
    TABLE 68. MASIMO CORPORATION: COMPANY SNAPSHOT
    TABLE 69. MASIMO CORPORATION: PRODUCT SEGMENTS
    TABLE 70. MASIMO CORPORATION: PRODUCT PORTFOLIO
    TABLE 71. MASIMO CORPORATION: KEY STRATERGIES
    TABLE 72. MEDTRONIC PLC: KEY EXECUTIVES
    TABLE 73. MEDTRONIC PLC: COMPANY SNAPSHOT
    TABLE 74. MEDTRONIC PLC: PRODUCT SEGMENTS
    TABLE 75. MEDTRONIC PLC: PRODUCT PORTFOLIO
    TABLE 76. MEDTRONIC PLC: KEY STRATERGIES
    TABLE 77. NIHON KOHDEN CORPORATION: KEY EXECUTIVES
    TABLE 78. NIHON KOHDEN CORPORATION: COMPANY SNAPSHOT
    TABLE 79. NIHON KOHDEN CORPORATION: PRODUCT SEGMENTS
    TABLE 80. NIHON KOHDEN CORPORATION: PRODUCT PORTFOLIO
    TABLE 81. RESMED INC.: KEY EXECUTIVES
    TABLE 82. RESMED INC.: COMPANY SNAPSHOT
    TABLE 83. RESMED INC.: PRODUCT SEGMENTS
    TABLE 84. RESMED INC.: PRODUCT PORTFOLIO
    TABLE 85. ICU MEDICAL INC.: KEY EXECUTIVES
    TABLE 86. ICU MEDICAL INC.: COMPANY SNAPSHOT
    TABLE 87. ICU MEDICAL INC.: PRODUCT SEGMENTS
    TABLE 88. ICU MEDICAL INC.: PRODUCT PORTFOLIO
    TABLE 89. VYAIRE MEDICAL, INC.: KEY EXECUTIVES
    TABLE 90. VYAIRE MEDICAL, INC.: COMPANY SNAPSHOT
    TABLE 91. VYAIRE MEDICAL, INC.: PRODUCT SEGMENTS
    TABLE 92. VYAIRE MEDICAL, INC.: PRODUCT PORTFOLIO
    TABLE 93. BECTON, DICKINSON AND COMPANY: KEY EXECUTIVES
    TABLE 94. BECTON, DICKINSON AND COMPANY: COMPANY SNAPSHOT
    TABLE 95. BECTON, DICKINSON AND COMPANY: PRODUCT SEGMENTS
    TABLE 96. BECTON, DICKINSON AND COMPANY: PRODUCT PORTFOLIO
    TABLE 97. TELEFLEX INCORPORATED.: KEY EXECUTIVES
    TABLE 98. TELEFLEX INCORPORATED.: COMPANY SNAPSHOT
    TABLE 99. TELEFLEX INCORPORATED.: PRODUCT SEGMENTS
    TABLE 100. TELEFLEX INCORPORATED.: PRODUCT PORTFOLIO
    TABLE 101. BAXTER INTERNATIONAL INC.: KEY EXECUTIVES
    TABLE 102. BAXTER INTERNATIONAL INC.: COMPANY SNAPSHOT
    TABLE 103. BAXTER INTERNATIONAL INC.: PRODUCT SEGMENTS
    TABLE 104. BAXTER INTERNATIONAL INC.: PRODUCT PORTFOLIO
  • LIST OF FIGURES

  • FIGURE 01. LUNG MONITORING DEVICES MARKET, 2022-2032
    FIGURE 02. SEGMENTATION OF LUNG MONITORING DEVICES MARKET, 2022-2032
    FIGURE 03. TOP INVESTMENT POCKETS IN LUNG MONITORING DEVICES MARKET (2023-2032)
    FIGURE 04. MODERATE BARGAINING POWER OF SUPPLIERS
    FIGURE 05. MODERATE BARGAINING POWER OF BUYERS
    FIGURE 06. MODERATE THREAT OF SUBSTITUTES
    FIGURE 07. MODERATE THREAT OF NEW ENTRANTS
    FIGURE 08. MODERATE INTENSITY OF RIVALRY
    FIGURE 09. DRIVERS, RESTRAINTS AND OPPORTUNITIES: GLOBALLUNG MONITORING DEVICES MARKET
    FIGURE 09. LUNG MONITORING DEVICES MARKET, BY PRODUCT TYPE, 2022(%)
    FIGURE 10. COMPARATIVE SHARE ANALYSIS OF LUNG MONITORING DEVICES MARKET FOR SPIROMETERS, BY COUNTRY 2022 AND 2032(%)
    FIGURE 11. COMPARATIVE SHARE ANALYSIS OF LUNG MONITORING DEVICES MARKET FOR PULSE OXIMETERS, BY COUNTRY 2022 AND 2032(%)
    FIGURE 12. COMPARATIVE SHARE ANALYSIS OF LUNG MONITORING DEVICES MARKET FOR CAPNOGRAPHS, BY COUNTRY 2022 AND 2032(%)
    FIGURE 13. COMPARATIVE SHARE ANALYSIS OF LUNG MONITORING DEVICES MARKET FOR OTHERS, BY COUNTRY 2022 AND 2032(%)
    FIGURE 14. LUNG MONITORING DEVICES MARKET, BY END USER, 2022(%)
    FIGURE 15. COMPARATIVE SHARE ANALYSIS OF LUNG MONITORING DEVICES MARKET FOR HOSPITALS, BY COUNTRY 2022 AND 2032(%)
    FIGURE 16. COMPARATIVE SHARE ANALYSIS OF LUNG MONITORING DEVICES MARKET FOR HOMECARE, BY COUNTRY 2022 AND 2032(%)
    FIGURE 17. COMPARATIVE SHARE ANALYSIS OF LUNG MONITORING DEVICES MARKET FOR OTHERS, BY COUNTRY 2022 AND 2032(%)
    FIGURE 18. LUNG MONITORING DEVICES MARKET BY REGION, 2022
    FIGURE 19. U.S. LUNG MONITORING DEVICES MARKET, 2022-2032 ($MILLION)
    FIGURE 20. CANADA LUNG MONITORING DEVICES MARKET, 2022-2032 ($MILLION)
    FIGURE 21. MEXICO LUNG MONITORING DEVICES MARKET, 2022-2032 ($MILLION)
    FIGURE 22. GERMANY LUNG MONITORING DEVICES MARKET, 2022-2032 ($MILLION)
    FIGURE 23. FRANCE LUNG MONITORING DEVICES MARKET, 2022-2032 ($MILLION)
    FIGURE 24. UK LUNG MONITORING DEVICES MARKET, 2022-2032 ($MILLION)
    FIGURE 25. ITALY LUNG MONITORING DEVICES MARKET, 2022-2032 ($MILLION)
    FIGURE 26. SPAIN LUNG MONITORING DEVICES MARKET, 2022-2032 ($MILLION)
    FIGURE 27. REST OF EUROPE LUNG MONITORING DEVICES MARKET, 2022-2032 ($MILLION)
    FIGURE 28. CHINA LUNG MONITORING DEVICES MARKET, 2022-2032 ($MILLION)
    FIGURE 29. JAPAN LUNG MONITORING DEVICES MARKET, 2022-2032 ($MILLION)
    FIGURE 30. INDIA LUNG MONITORING DEVICES MARKET, 2022-2032 ($MILLION)
    FIGURE 31. AUSTRALIA LUNG MONITORING DEVICES MARKET, 2022-2032 ($MILLION)
    FIGURE 32. SOUTH KOREA LUNG MONITORING DEVICES MARKET, 2022-2032 ($MILLION)
    FIGURE 33. REST OF ASIA-PACIFIC LUNG MONITORING DEVICES MARKET, 2022-2032 ($MILLION)
    FIGURE 34. BRAZIL LUNG MONITORING DEVICES MARKET, 2022-2032 ($MILLION)
    FIGURE 35. SAUDI ARABIA LUNG MONITORING DEVICES MARKET, 2022-2032 ($MILLION)
    FIGURE 36. SOUTH AFRICA LUNG MONITORING DEVICES MARKET, 2022-2032 ($MILLION)
    FIGURE 37. REST OF LAMEA LUNG MONITORING DEVICES MARKET, 2022-2032 ($MILLION)
    FIGURE 38. TOP WINNING STRATEGIES, BY YEAR
    FIGURE 39. TOP WINNING STRATEGIES, BY DEVELOPMENT
    FIGURE 40. TOP WINNING STRATEGIES, BY COMPANY
    FIGURE 41. PRODUCT MAPPING OF TOP 10 PLAYERS
    FIGURE 42. COMPETITIVE DASHBOARD
    FIGURE 43. COMPETITIVE HEATMAP: LUNG MONITORING DEVICES MARKET
    FIGURE 44. TOP PLAYER POSITIONING, 2022
    FIGURE 45. KONINKLIJKE PHILIPS N.V.: NET SALES, 2020-2022 ($MILLION)
    FIGURE 46. KONINKLIJKE PHILIPS N.V.: REVENUE SHARE BY SEGMENT, 2022 (%)
    FIGURE 47. KONINKLIJKE PHILIPS N.V.: REVENUE SHARE BY REGION, 2022 (%)
    FIGURE 48. MASIMO CORPORATION: NET REVENUE, 2020-2022 ($MILLION)
    FIGURE 49. MEDTRONIC PLC: NET SALES, 2020-2022 ($MILLION)
    FIGURE 50. MEDTRONIC PLC: REVENUE SHARE BY SEGMENT, 2022 (%)
    FIGURE 51. MEDTRONIC PLC: REVENUE SHARE BY REGION, 2022 (%)
    FIGURE 52. NIHON KOHDEN CORPORATION: NET SALES, 2020-2022 ($MILLION)
    FIGURE 53. NIHON KOHDEN CORPORATION: REVENUE SHARE BY SEGMENT, 2022 (%)
    FIGURE 54. NIHON KOHDEN CORPORATION: REVENUE SHARE BY REGION, 2022 (%)
    FIGURE 55. RESMED INC.: NET REVENUE, 2020-2022 ($MILLION)
    FIGURE 56. RESMED INC.: REVENUE SHARE BY SEGMENT, 2022 (%)
    FIGURE 57. RESMED INC.: REVENUE SHARE BY REGION, 2022 (%)
    FIGURE 58. ICU MEDICAL INC.: NET REVENUE, 2020-2022 ($MILLION)
    FIGURE 59. ICU MEDICAL INC.: REVENUE SHARE BY SEGMENT, 2022 (%)
    FIGURE 60. ICU MEDICAL INC.: REVENUE SHARE BY REGION, 2022 (%)
    FIGURE 61. BECTON, DICKINSON AND COMPANY: NET REVENUE, 2020-2022 ($MILLION)
    FIGURE 62. BECTON, DICKINSON AND COMPANY: REVENUE SHARE BY SEGMENT, 2022 (%)
    FIGURE 63. BECTON, DICKINSON AND COMPANY: REVENUE SHARE BY REGION, 2022 (%)
    FIGURE 64. TELEFLEX INCORPORATED.: NET REVENUE, 2020-2022 ($MILLION)
    FIGURE 65. TELEFLEX INCORPORATED.: REVENUE SHARE BY SEGMENT, 2022 (%)
    FIGURE 66. TELEFLEX INCORPORATED.: REVENUE SHARE BY REGION, 2021 (%)
    FIGURE 67. BAXTER INTERNATIONAL INC.: NET SALES, 2020-2022 ($MILLION)
    FIGURE 68. BAXTER INTERNATIONAL INC.: REVENUE SHARE BY SEGMENT, 2022 (%)
    FIGURE 69. BAXTER INTERNATIONAL INC.: REVENUE SHARE BY REGION, 2022 (%)


PURCHASE OPTIONS

Call or Email us

U.S.-Canada Toll-free: +1-800-792-5285
Int'l : +1-503-894-6022
Europe : +44-845-528-1300
Email : help@alliedmarketresearch.com
 
FREQUENTLY ASKED QUESTIONS?

A. The total market value of the lung monitoring devices Market is $3,247.02 million in 2022.

A. The forecast period in the report is from 2023 to 2032.

A. North America is the largest regional market for Lung Monitoring Devices.

A. There are 10 lung monitoring devices manufacturing companies are profiled in the report.

A. The top companies that hold the market share in the GE Healthcare, Hill-Rom, Inc., Koninklijke Philips N.V., Masimo, and Medtronic

A. Yes, lung monitoring devices companies are profiled in the report

A. Yes, the competitive landscape included in the lung monitoring devices market report.

Looking for Customization?

 Customization Request

Have a Question?

 Speak with Analyst

Any Confusion?

 Inquire Before Buying

Have a glance of the Report

  Request Sample
RELATED TAGS

Purchase Full Report of
Lung Monitoring Devices Market

Start reading instantly.
This Report and over 66,905+ more Reports, Available with Avenue Library. T&C*.

  • Online Only
  • $3,570
  • Online cloud access only
  • Restricted print, copy, paste & download
  • Read only
  • Free industry update
    (Within 180 days)
  • Free report update in next update cycle
    (Jun 2024 - Jun 2025)
  • Data Pack
  • $3,840
  • Restricted to one authorized user
  • One print only
  • Available in
    Excel
  • Free industry update
    (Within 180 days)
  •   Free report update in next update cycle
    (Jun 2024 - Jun 2025)
  • Single User
  • $5,730
  • Restricted to one authorized user
  • One print only
  • Available in
    PDF
  • Free industry update
    (Within 180 days)
  •   Free report update in next update cycle
    (Jun 2024 - Jun 2025)
  • Five Users
  • $6,450
  • Limited to five authorized users
  • Print upto five copies
  • Available in
    PDF
  • Free industry update
    (Within 180 days)
  •   Free report update in next update cycle
    (Jun 2024 - Jun 2025)
  • Enterprise
    License/PDF

  • $9,600
  • Unlimited
    within
    company/enterprise
  • Available in Excel & PDF
  • Free industry update
    (Within 180 days)
  •   Free report update in next update cycle
    (Jun 2024 - Jun 2025)
  • Library
    Membership

  • $999 $ 1,175
    Per User/ Per month/ Billed annually
  • Published Content
    E-access
  • Company Profiles
    E-access
  • Newly Added Content Access
  • 10 PDF
    Downloads
  • 5 Excel Data
    Pack Downloads
  • 250 Company Profiles PDF Downloads
  • Buy Now

*Taxes/Fees, if applicable will be added during checkout. All prices in USD

RELATED REPORTS
 

Why Allied Market Research?


Infallible Methodology

To ensure high-level data integrity, accurate analysis, and impeccable forecasts

Analyst Support

For complete satisfaction

Customization

On-demand customization of scope of the report to exactly meet your needs

TARGETED MARKET VIEW

Targeted market view to provide pertinent information and save time of readers

Get fresh content delivered

Get insights on topics that are crucial for your business. Stay abreast of your interest areas.

Get Industry Data Alerts

Why Allied Market Research?

Infallible Methodology

To ensure high-level data integrity, accurate analysis, and impeccable forecasts

Analyst Support

For complete satisfaction

Customization

On-demand customization of scope of the report to exactly meet your needs

TARGETED MARKET VIEW

Targeted market view to provide pertinent information and save time of readers