0
2021
Luxury Sunglass Market

Luxury Sunglass Market

by Product Type (Polarized and Non-polarized), Frame Material (Acetate, Metal, Injected, and Others), End User (Male, Female, and Unisex), and Distribution Channel (Supermarkets/Hypermarkets, Specialty Stores, Convenience Stores, Online Stores, and Others): Global Opportunity Analysis and Industry Forecast, 2021-2030

Report Code: A12448
Jul 2021 | Pages: 380
Tables: 187
Charts: 81
  • Formats*:

  • pdf

    Single User License, Five User
    License & Enterprise User License

  • xls

    Data Pack Excel License

  • ppt

    It comes with the additional cost
    of $2500.00 contact sales.


COVID-19

Pandemic disrupted the entire world and affected many industries.

Get detailed COVID-19 impact analysis on the Luxury Sunglass Market

Request Now !

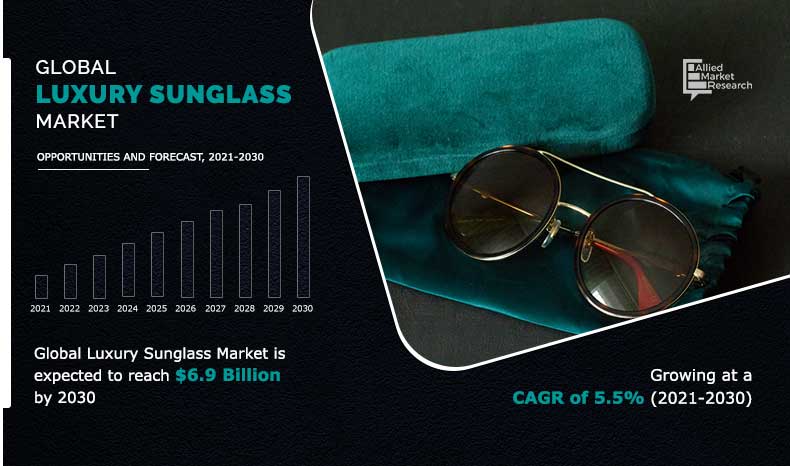
The global luxury sunglass market size was valued at $4.1 billion in 2020, and is expected to garner $6.9 billion by 2030, registering a CAGR of 5.5% from 2021 to 2030. In 2020, the non-polarized segment accounted for more than half of the total market share.         

Sunglasses are special lenses or protective eyewear designed to protect eyes from the sun’s glare and high-energy visible light. They sometimes function as a visual aid. Sunglasses feature colored, polarized/darkened lenses that protect the eyes from sunlight.

Luxury-Sunglass-Market

Factors, such as increasing life span, growing geriatric population, and changing fashion trends, have fostered the demand for eyewear. Nowadays, consumers not only wear eyewear for vision correction but also to enhance one’s overall appearance. Factors, such as changing fashion trends and transition from spectacles to contact lenses, have fostered the market growth. Numerous market players offer innovative spectacles and lenses, owing to technological advancements and availability of lightweight materials. In 2020, North America was the largest revenue-generating region in the world luxury sunglass market. 

Luxury sunglasses are very common accessories and people love to carry with them while traveling. Most of the brands target their end users through travel retail channel. Airport is the most preferable spot for travel retailers to operate as maximum tourists prefer traveling via air routes. According to UNWTO, the number of international tourists is expected to increase at 4% in the future. This rise in trend of the tourism industry is anticipated to drive the luxury sunglass market growth in the forthcoming years.

The leading players are focusing on digitization as the future is showing a promising growth opportunity through online channels. Technological advancements, such as 3D try-on, are expected to be trending among the market leaders. Moreover, social media influencing that includes celebrity endorsement on digital platforms, promotion of brands by fashion icons, and social media influencers is expected to experience growth. Online presence of luxury sunglasses brands has become as much important as their physical presence in today’s world.

Moreover, counterfeit brands are usually prevalent in developing economies where customers are highly price-sensitive. Counterfeiting tarnishes brand image, owing to low quality use of material and lower prices of products. Online distribution channel is one of the major platforms, where transaction of counterfeited products can be easily concealed. Thus, proliferation of the counterfeited industry is anticipated to hamper the growth of the luxury sunglasses market. 

Leading companies, such as Google and Microsoft, are working for the development of AR-enabled eyewear or simply smart glasses. Recently, Facebook collaborated with the eyewear manufacturing leader Essilor Luxottica to develop the first AR smart eyeglass “Facebook-Ray Ban Smart Glasses” to be launched in 2021. This technology is anticipated to enable the user to do things such as locating misplaced key, finding things quickly in shops, and navigation.

The luxury sunglass market is segmented on the basis of product type, frame material, end user, distribution channel, and region. By product type, it is bifurcated into polarized and non-polarized. On the basis of frame material, it is divided into acetate, metal, injected, and others. Based on end user, it is fragmenetd into men, women, and unisex. Based on distribution channel, it is classified into supermarkets/hypermarkets, specialty stores, convenience stores, online stores, and others. Region-wise, it is analyzed across North America (the U.S., Canada, and Mexico), Europe (the UK, France, Italy, Germany, Spain, Russia, and the rest of Europe), Asia-Pacific (China, Japan, India, South Korea, Australia, Indonesia, Sri Lanka, and the rest of Asia-Pacific), and LAMEA (Brazil, Argentina, the UAE, Nigeria, Turkey, South Africa, and the rest of LAMEA). 

On the basis of product type, the non-polarized segment accounted for maximum share in the global luxury sunglass market in 2020, and is expected to remain dominant during the luxury sunglass market forecast period. Non-polarized sunglasses consist of glass or plastic lenses and a frame holding the lenses. Non-polarized sunglasses reduce the overall intensity of the bright sunlight. A wide variety of non-polarized sunglasses is available depending upon the color of the lenses, design, materials used in frames, and on-demand customization of the glasses. 

Luxury Sunglass Market
By Product Type

Your browser does not support the canvas element.

Polarized segment would witness the fastest growth, registering a CAGR of 6.1% during the forecast period.

Get more information on this report : Request Sample Pages

On the basis of frame material, injected frame material is less expensive and its manufacturing involves less time. It is made by injecting the petroleum-based plastic liquid into a metal mold. It is popular, owing to its lightweight & comfort features and injected frames can be produced with a wide range of colors.

Luxury Sunglass Market
By Frame Material

Your browser does not support the canvas element.

Acetate Segment witnssed a major growth rate of 6.1%

Get more information on this report : Request Sample Pages

On the basis of end user, the male segment led the luxury sunglass market share in 2020. Availability of male luxury sunglasses with round & transparent lenses and tinted lenses is driving the luxury sunglass market growth rate. 

Luxury Sunglass Market
By End User

Your browser does not support the canvas element.

Men Segment held the major share of 44.9% in 2020

Get more information on this report : Request Sample Pages

On the basis of distribution channel, the specialty stores segment is a popular medium for customers to buy sunglasses. Easy availability of desired brands, designs, and colors of sunglasses drives the growth of the specialty stores segment. Online sale of sunglasses is also gaining popularity among customers, owing to proliferation of digital platforms at a global level.

Luxury Sunglass Market
By Distribution Channel

Your browser does not support the canvas element.

Specialty Stores Segment held the major share of 39.2% in 2020

Get more information on this report : Request Sample Pages

On the basis of region, North America dominated the luxury sunglass market in 2020, and accounted for maximum share in the luxury sunglass market. The key factors driving the growth of the sunglass market in the region are high purchasing capacity of majority of the population, high demand for luxury and superior quality products, and consumer awareness regarding vision care. 

Luxury Sunglass Market
By Region

2030
North America 
Europe
Asia-Pacific
LAMEA

Eurpoe held the major share of 36.6% in 2020

Get more information on this report : Request Sample Pages

The players operating in the global luxury sunglass market have adopted various developmental strategies to expand their market share and increased profitability in the market. The key players profiled in this report include Carl Zeiss AG, EssilorLuxottica SA, Giorgio Armani S.p.A., Guccio Gucci S.p.A, Loch Effects, LVMH Moët Hennessy Louis Vuitton, Marcolin S.p.A., Prada S.p.A, Randolph Engineering, Inc, and Safilo Group SpA. 

Key benefits for stakeholders  

  • The report provides quantitative analysis of the current luxury sunglass market trends, estimations, and dynamics of the market size from 2020 to 2030 to identify the prevailing luxury sunglass market opportunity. 
  • Porter’s five forces analysis highlights the potency of buyers and suppliers to enable stakeholders to make profit-oriented business decisions and strengthen their supplier–buyer network.
  • In-depth analysis and the market size & segmentation assist to determine the market potential.
  • The major countries in each region are mapped according to their revenue contribution to the market.    
  • The market player positioning segment facilitates benchmarking and provides a clear understanding of the present position of the market players in the luxury sunglass industry. 

Key market segments

By Product Type

  • Polarized
  • Non-polarized 

Frame Material 

  • Acetate
  • Metal
  • Injected
  • Others

By End User

  • Male
  • Female
  • Unisex

By Distribution Channel

  • Supermarkets/Hypermarkets
  • Specialty Stores
  • Convenience Stores
  • Online Stores
  • Others

By Region

  • North America
    • U.S.
    • Canada
    • Mexico
  • Europe
    • Germany 
    • France
    • UK
    • Italy
    • Spain 
    • Russia
    • Rest of Europe
  • Asia-Pacific
    • China
    • Japan
    • Australia
    • South Korea
    • Indonesia
    • Sri Lanka
    • Rest of Asia-Pacific  
  • LAMEA 
    • Brazil
    • Argentina
    • UAE
    • Turkey
    • Nigeria
    • South Africa 
    • Rest of LAMEA

Luxury Sunglass Market Report Highlights

Aspects Details
By Product Type
  • Polarized
  • Non-polarized
By Frame Material
  • Acetate
  • Metal
  • Injected
  • Others
By End User
  • Male
  • Female
  • Unisex
By Distribution Channel
  • Supermarkets/Hypermarkets
  • Specialty Stores
  • Convenience Stores
  • Online Stores
  • Others
By Region
  • North America  (U.S., Canada, Mexico)
  • Europe  (France, Germany, Italy, Spain, UK, Russia, Rest of Europe)
  • Asia-Pacific  (China, Japan, India, South Korea, Australia, Thailand, Malaysia, Indonesia, Rest of Asia-Pacific)
  • LAMEA  (Brazil, South Africa, Saudi Arabia, UAE, Argentina, Rest of LAMEA)
Key Market Players SAFILO GROUP S.P.A., LVMH Moët Hennessy Louis Vuitton, Giorgio Armani S.p.A., Guccio Gucci S.p.A, Marcolin S.p.A. (Marcolin Group), RANDOLPH ENGINEERING, INC., LOCH EFFECTS, ESSILORLUXOTTICA SA, Carl Zeiss AG, Prada Holding S.P.A.
 

CHAPTER 1:INTRODUCTION

1.1.Key benefits for stakeholders
1.2.Key market segments
1.3.Research methodology

1.3.1.Secondary research
1.3.2.Primary research
1.3.3.Analyst tools and models

CHAPTER 2:EXECUTIVE SUMMARY

2.1.Key findings of the study
2.2.CXO perspective

CHAPTER 3:MARKET OVERVIEW

3.1.Market definition and scope
3.2.Key findings

3.2.1.Top investment pockets

3.3.Top players positioning
3.4.Value chain analysis
3.5.Porter’s five forces analysis
3.6.Market dynamics

3.6.1.Drivers

3.6.1.1.Surge in popularity of travel retail across the globe
3.6.1.2.Exclusivity and premiumization of sunglasses will be an effective tool for boosting sales
3.6.1.3.Rising living standards and growing fashion trends
3.6.1.4.Increase in popularity of e-commerce among consumers

3.6.2.Restraints

3.6.2.1.Availability of counterfeit products
3.6.2.2.No penetration in lower tier towns and cities

3.6.3.Opportunities

3.6.3.1.Introduction of augmented reality technology in sunglasses
3.6.3.2.Sustainability along with innovation will create opportunities to grow

3.7.Market share analysis

3.7.1.By product type
3.7.2.By frame material
3.7.3.By end user
3.7.4.By distribution channel
3.7.5.By region

3.9.Case study

3.9.1.Case study on Luxottica Group S.p.A

3.10.Key regulations

3.10.1.U.S.
3.10.2.Australia
3.10.3.European Union

3.11.Impact of COVID-19 on the luxury sunglass market

CHAPTER 4:LUXURY SUNGLASS MARKET, BY PRODUCT TYPE

4.1.Overview

4.1.1.Market size and forecast

4.2.Polarized

4.2.1.Key market trends, growth factors, and opportunities
4.2.2.Market size and forecast, by region
4.2.3.Market analysis, by country

4.3.Non-polarized

4.3.1.Key market trends, growth factors, and opportunities
4.3.2.Market size and forecast, by region
4.3.3.Market analysis, by country

CHAPTER 5:LUXURY SUNGLASS MARKET, FRAME MATERIAL

5.1.Overview
5.2.Market size and forecast
5.3.Acetate

5.3.1.Key market trends, growth factors, and opportunities
5.3.2.Market size and forecast, by region
5.3.3.Market analysis, by country

5.4.Metal

5.4.1.Key market trends, growth factors, and opportunities
5.4.2.Market size and forecast, by region
5.4.3.Market analysis, by country

5.5.Injected

5.5.1.Key market trends, growth factors, and opportunities
5.5.2.Market size and forecast, by region
5.5.3.Market analysis, by country

5.6.Others

5.6.1.Key market trends, growth factors, and opportunities
5.6.2.Market size and forecast, by region
5.6.3.Market analysis, by country

CHAPTER 6:LUXURY SUNGLASS MARKET, BY END USER

6.1.Overview
6.2.Market size and forecast
6.3.Men

6.3.1.Key market trends, growth factors, and opportunities
6.3.2.Market size and forecast, by region
6.3.3.Market analysis, by country

6.4.Women

6.4.1.Key market trends, growth factors, and opportunities
6.4.2.Market size and forecast, by region
6.4.3.Market analysis, by country

6.5.Unisex

6.5.1.Key market trends, growth factors, and opportunities
6.5.2.Market size and forecast, by region
6.5.3.Market analysis, by country

CHAPTER 7:LUXURY SUNGLASS MARKET, BY DISTRIBUTION CHANNEL

7.1.Overview
7.2.Market size and forecast
7.3.Supermarkets/hypermarkets

7.3.1.Key market trends, growth factors, and opportunities
7.3.2.Market size and forecast, by region
7.3.3.Market analysis, by country

7.4.Specialty stores

7.4.1.Key market trends, growth factors, and opportunities
7.4.2.Market size and forecast, by region
7.4.3.Market analysis, by country

7.5.Convenience stores

7.5.1.Key market trends, growth factors, and opportunities
7.5.2.Market size and forecast, by region
7.5.3.Market analysis, by country

7.6.Online stores

7.6.1.Key market trends, growth factors, and opportunities
7.6.2.Market size and forecast, by region
7.6.3.Market analysis, by country

7.7.Others

7.7.1.Key market trends, growth factors, and opportunities
7.7.2.Market size and forecast, by region
7.7.3.Market analysis, by country

CHAPTER 8:LUXURY SUNGLASS MARKET, BY REGION

8.1.Overview

8.1.1.Market size and forecast, by region

8.2.North America

8.2.1.Key market trends, growth factors, and opportunities
8.2.2.Market size and forecast, by product type
8.2.3.Market size and forecast, by frame material
8.2.4.Market size and forecast, by end user
8.2.5.Market size and forecast, by distribution channel
8.2.6.Market size and forecast, by country

8.2.6.1.U.S.

8.2.6.1.1.Market size and forecast, by product type
8.2.6.1.2.Market size and forecast, by frame material
8.2.6.1.3.Market size and forecast, by end user
8.2.6.1.4.Market size and forecast, by distribution channel

8.2.6.2.Canada

8.2.6.2.1.Market size and forecast, by product type
8.2.6.2.2.Market size and forecast, by frame material
8.2.6.2.3.Market size and forecast, by end user
8.2.6.2.4.Market size and forecast, by distribution channel

8.2.6.3.Mexico

8.2.6.3.1.Market size and forecast, by product type
8.2.6.3.2.Market size and forecast, by frame material
8.2.6.3.3.Market size and forecast, by end user
8.2.6.3.4.Market size and forecast, by distribution channel

8.3.Europe

8.3.1.Key market trends, growth factors, and opportunities
8.3.2.Market size and forecast, by product type
8.3.3.Market size and forecast, by frame material
8.3.4.Market size and forecast, by end user
8.3.5.Market size and forecast, by distribution channel
8.3.6.Market size and forecast, by country

8.3.6.1.Germany

8.3.6.1.1.Market size and forecast, by product type
8.3.6.1.2.Market size and forecast, by frame material
8.3.6.1.3.Market size and forecast, by end user
8.3.6.1.4.Market size and forecast, by distribution channel

8.3.6.2.France

8.3.6.2.1.Market size and forecast, by product type
8.3.6.2.2.Market size and forecast, by frame material
8.3.6.2.3.Market size and forecast, by end user
8.3.6.2.4.Market size and forecast, by distribution channel

8.3.6.3.UK

8.3.6.3.1.Market size and forecast, by product type
8.3.6.3.2.Market size and forecast, by frame material
8.3.6.3.3.Market size and forecast, by end user
8.3.6.3.4.Market size and forecast, by distribution channel

8.3.6.4.Spain

8.3.6.4.1.Market size and forecast, by product type
8.3.6.4.2.Market size and forecast, by frame material
8.3.6.4.3.Market size and forecast, by end user
8.3.6.4.4.Market size and forecast, by distribution channel

8.3.6.5.Italy

8.3.6.5.1.Market size and forecast, by product type
8.3.6.5.2.Market size and forecast, by frame material
8.3.6.5.3.Market size and forecast, by end user
8.3.6.5.4.Market size and forecast, by distribution channel

8.3.6.6.Russia

8.3.6.6.1.Market size and forecast, by product type
8.3.6.6.2.Market size and forecast, by frame material
8.3.6.6.3.Market size and forecast, by end user
8.3.6.6.4.Market size and forecast, by distribution channel

8.3.6.7.Rest of Europe

8.3.6.7.1.Market size and forecast, by product type
8.3.6.7.2.Market size and forecast, by frame material
8.3.6.7.3.Market size and forecast, by end user
8.3.6.7.4.Market size and forecast, by distribution channel

8.4.Asia-Pacific

8.4.1.Key market trends, growth factors, and opportunities
8.4.2.Market size and forecast, by product type
8.4.3.Market size and forecast, by frame material
8.4.4.Market size and forecast, by end user
8.4.5.Market size and forecast, by distribution channel
8.4.6.Market size and forecast, by country

8.4.6.1.China

8.4.6.1.1.Market size and forecast, by product type
8.4.6.1.2.Market size and forecast, by frame material
8.4.6.1.3.Market size and forecast, by end user
8.4.6.1.4.Market size and forecast, by distribution channel

8.4.6.2.Japan

8.4.6.2.1.Market size and forecast, by product type
8.4.6.2.2.Market size and forecast, by frame material
8.4.6.2.3.Market size and forecast, by end user
8.4.6.2.4.Market size and forecast, by distribution channel

8.4.6.3.India

8.4.6.3.1.Market size and forecast, by product type
8.4.6.3.2.Market size and forecast, by frame material
8.4.6.3.3.Market size and forecast, by end user
8.4.6.3.4.Market size and forecast, by distribution channel

8.4.6.4.Australia

8.4.6.4.1.Market size and forecast, by product type
8.4.6.4.2.Market size and forecast, by frame material
8.4.6.4.3.Market size and forecast, by end user
8.4.6.4.4.Market size and forecast, by distribution channel

8.4.6.5.South Korea

8.4.6.5.1.Market size and forecast, by product type
8.4.6.5.2.Market size and forecast, by frame material
8.4.6.5.3.Market size and forecast, by end user
8.4.6.5.4.Market size and forecast, by distribution channel

8.4.6.6.Indonesia

8.4.6.6.1.Market size and forecast, by product type
8.4.6.6.2.Market size and forecast, by frame material
8.4.6.6.3.Market size and forecast, by end user
8.4.6.6.4.Market size and forecast, by distribution channel

8.4.6.7.Sri Lanka

8.4.6.7.1.Market size and forecast, by product type
8.4.6.7.2.Market size and forecast, by frame material
8.4.6.7.3.Market size and forecast, by end user
8.4.6.7.4.Market size and forecast, by distribution channel

8.4.6.8.Rest of Asia-Pacific

8.4.6.8.1.Market size and forecast, by product type
8.4.6.8.2.Market size and forecast, by frame material
8.4.6.8.3.Market size and forecast, by end user
8.4.6.8.4.Market size and forecast, by distribution channel

8.5.LAMEA

8.5.1.Key market trends, growth factors, and opportunities
8.5.2.Market size and forecast, by product type
8.5.3.Market size and forecast, by frame material
8.5.4.Market size and forecast, by end user
8.5.5.Market size and forecast, by distribution channel
8.5.6.Market size and forecast, by country

8.5.6.1.Brazil

8.5.6.1.1.Market size and forecast, by product type
8.5.6.1.2.Market size and forecast, by frame material
8.5.6.1.3.Market size and forecast, by end user
8.5.6.1.4.Market size and forecast, by distribution channel

8.5.6.2.Argentina

8.5.6.2.1.Market size and forecast, by product type
8.5.6.2.2.Market size and forecast, by frame material
8.5.6.2.3.Market size and forecast, by end user
8.5.6.2.4.Market size and forecast, by distribution channel

8.5.6.3.United Emirates Arab

8.5.6.3.1.Market size and forecast, by product type
8.5.6.3.2.Market size and forecast, by frame material
8.5.6.3.3.Market size and forecast, by end user
8.5.6.3.4.Market size and forecast, by distribution channel

8.5.6.4.Nigeria

8.5.6.4.1.Market size and forecast, by product type
8.5.6.4.2.Market size and forecast, by frame material
8.5.6.4.3.Market size and forecast, by end user
8.5.6.4.4.Market size and forecast, by distribution channel

8.5.6.5.Turkey

8.5.6.5.1.Market size and forecast, by product type
8.5.6.5.2.Market size and forecast, by frame material
8.5.6.5.3.Market size and forecast, by end user
8.5.6.5.4.Market size and forecast, by distribution channel

8.5.6.6.South Africa

8.5.6.6.1.Market size and forecast, by product type
8.5.6.6.2.Market size and forecast, by frame material
8.5.6.6.3.Market size and forecast, by end user
8.5.6.6.4.Market size and forecast, by distribution channel

8.5.6.7.Rest of LAMEA

8.5.6.7.1.Market size and forecast, by product type
8.5.6.7.2.Market size and forecast, by frame material
8.5.6.7.3.Market size and forecast, by end user
8.5.6.7.4.Market size and forecast, by distribution channel

CHAPTER 9:COMPETITION LANDSCAPE

9.1.Top winning strategies
9.2.Product mapping
9.3.Competitive dashboard
9.4.Competitive heat map
9.5.Key developments

9.5.1.Acquisition
9.5.2.Business Expansion
9.5.3.Product Launch

CHAPTER 10:COMPANY PROFILES

10.1.Carl Zeiss AG

10.1.1.Company overview
10.1.2.Key Executives
10.1.3.Company snapshot
10.1.4.Operating business segments
10.1.5.Product portfolio
10.1.6.R&D Expenditure
10.1.7.Business performance

10.2.ESSILORLUXOTTICA SA

10.2.1.Company overview
10.2.2.Key Executives
10.2.3.Company snapshot
10.2.4.Operating business segments
10.2.5.Product Portfolio
10.2.6.R&D Expenditure, 2017–2019 ($MILLION)
10.2.7.Business performance
10.2.8.Key strategic moves and developments

10.3.Giorgio Armani S.p.A.

10.3.1.Company overview
10.3.2.Key Executives
10.3.3.Company snapshot
10.3.4.Product portfolio
10.3.5.Business performance

10.4.Guccio Gucci S.p.A

10.4.1.Company overview
10.4.2.Key Executives
10.4.3.Company snapshot
10.4.4.Product portfolio
10.4.5.Business performance
10.4.6.Key strategic moves and developments

10.5.LOCH EFFECTS

10.5.1.Company overview
10.5.2.Key Executives
10.5.3.Company snapshot
10.5.4.Operating business segments
10.5.5.Product portfolio

10.6.LVMH Moët Hennessy Louis Vuitton

10.6.1.Company overview
10.6.2.Key executives
10.6.3.Company snapshot
10.6.4.Operating business segments
10.6.5.Product portfolio
10.6.6.Business performance
10.6.7.Key strategic moves and developments

10.7.Marcolin S.p.A. (Marcolin Group)

10.7.1.Company overview
10.7.2.Key Executives
10.7.3.Company snapshot
10.7.4.Operating business segments
10.7.5.Product portfolio
10.7.6.Business performance
10.7.7.Key strategic moves and developments

10.8.Prada Holding S.P.A.

10.8.1.Company overview
10.8.2.Key Executives
10.8.3.Company snapshot
10.8.4.Product portfolio
10.8.5.Business performance
10.8.6.Key strategic moves and developments

10.9.RANDOLPH ENGINEERING, INC.

10.9.1.Company overview
10.9.2.Key Executives
10.9.3.Company snapshot
10.9.4.Operating business segments
10.9.5.Product portfolio

10.10.SAFILO GROUP S.P.A.

10.10.1.Company overview
10.10.2.Key Executives
10.10.3.Company snapshot
10.10.4.Operating business segments
10.10.5.Product portfolio
10.10.6.R&D Expenditure
10.10.7.Business performance
10.10.8.Key strategic moves and developments

LIST OF TABLES

TABLE 01.GLOBAL LUXURY SUNGLASS MARKET REVENUE, BY PRODUCT TYPE, 2020–2030 ($MILLION)
TABLE 02.LUXURY SUNGLASS MARKET REVENUE FOR POLARIZED, BY REGION, 2020–2030 ($MILLION)
TABLE 03.LUXURY SUNGLASS MARKET FOR NON-POLARIZED, BY REGION 2020–2030 ($MILLION)
TABLE 04.GLOBAL LUXURY SUNGLASS MARKET REVENUE, BY FRAME MATERIAL, 2020–2030($MILLION)
TABLE 05.LUXURY SUNGLASS MARKET REVENUE FOR ACETATE, BY REGION, 2020–2030 ($MILLION)
TABLE 06.LUXURY SUNGLASS MARKET REVENUE FOR METAL, BY REGION, 2020–2030 ($MILLION)
TABLE 07.LUXURY SUNGLASS MARKET REVENUE FOR INJECTED, BY REGION, 2020–2030 ($MILLION)
TABLE 08.LUXURY SUNGLASS MARKET REVENUE FOR OTHERS, BY REGION, 2020–2030 ($MILLION)
TABLE 09.GLOBAL LUXURY SUNGLASS MARKET REVENUE, BY END USER, 2020–2030($MILLION)
TABLE 10.LUXURY SUNGLASS MARKET REVENUE FOR MEN, BY REGION, 2020–2030 ($MILLION)
TABLE 11.LUXURY SUNGLASS MARKET REVENUE FOR WOMEN, BY REGION, 2020–2030 ($MILLION )
TABLE 12.LUXURY SUNGLASS MARKET REVENUE UNISEX, BY REGION, 2020–2030 ($MILLION)
TABLE 13.GLOBAL LUXURY SUNGLASS MARKET REVENUE, BY DISTRIBUTION CHANNEL, 2021–2030($MILLION)
TABLE 14.LUXURY SUNGLASS MARKET REVENUE FOR SUPERMARKETS/HYPERMARKETS, BY REGION, 2020–2030 ($MILLION)
TABLE 15.LUXURY SUNGLASS MARKET REVENUE FOR SPECIALTY STORES, BY REGION, 2020–2030 ($MILLION )
TABLE 16.LUXURY SUNGLASS MARKET REVENUE FOR CONVENIENCE STORES, BY REGION, 2020–2030 ($MILLION )
TABLE 17.LUXURY SUNGLASS MARKET REVENUE FOR ONLINE STORES, BY REGION, 2020–2030 ($MILLION )
TABLE 18.LUXURY SUNGLASS MARKET REVENUE FOR OTHERS, BY REGION, 2020–2030 ($MILLION )
TABLE 19.LUXURY SUNGLASS MARKET, BY REGION, 2020–2030 ($MILLION)
TABLE 20.NORTH AMERICA LUXURY SUNGLASS MARKET, BY PRODUCT TYPE, 2020–2030 ($MILLION)
TABLE 21.NORTH AMERICA LUXURY SUNGLASS MARKET, BY FRAME MATERIAL, 2020–2030 ($MILLION)
TABLE 22.NORTH AMERICA LUXURY SUNGLASS MARKET, BY END USER, 2020–2030 ($MILLION)
TABLE 23.NORTH AMERICA LUXURY SUNGLASS MARKET, BY DISTRIBUTION CHANNEL, 2020–2030 ($MILLION)
TABLE 24.NORTH AMERICA LUXURY SUNGLASS MARKET, BY COUNTRY, 2020–2030 ($MILLION)
TABLE 25.U.S. LUXURY SUNGLASS MARKET, BY PRODUCT TYPE, 2020–2030 ($MILLION)
TABLE 26.U.S. LUXURY SUNGLASS MARKET, BY FRAME MATERIAL, 2020–2030 ($MILLION)
TABLE 27.U.S LUXURY SUNGLASS MARKET, BY END USER, 2020–2030 ($MILLION)
TABLE 28.U.S. LUXURY SUNGLASS MARKET, BY DISTRIBUTION CHANNEL, 2020–2030 ($MILLION)
TABLE 29.CANADA LUXURY SUNGLASS MARKET, BY PRODUCT TYPE, 2020–2030 ($MILLION)
TABLE 30.CANADA LUXURY SUNGLASS MARKET, BY FRAME MATERIAL, 2020–2030 ($MILLION)
TABLE 31.CANADA LUXURY SUNGLASS MARKET, BY END USER, 2020–2030 ($MILLION)
TABLE 32.CANADA LUXURY SUNGLASS MARKET, BY DISTRIBUTION CHANNEL, 2020–2030 ($MILLION)
TABLE 33.MEXICO LUXURY SUNGLASS MARKET, BY PRODUCT TYPE, 2020–2030 ($MILLION)
TABLE 34.MEXICO LUXURY SUNGLASS MARKET, BY FRAME MATERIAL, 2020–2030 ($MILLION)
TABLE 35.MEXICO LUXURY SUNGLASS MARKET, BY END USER, 2020–2030 ($MILLION)
TABLE 36.MEXICO LUXURY SUNGLASS MARKET, BY DISTRIBUTION CHANNEL, 2020–2030 ($MILLION)
TABLE 37.EUROPE LUXURY SUNGLASS MARKET, BY PRODUCT TYPE, 2020–2030 ($MILLION)
TABLE 38.EUROPE LUXURY SUNGLASS MARKET, BY FRAME MATERIAL, 2020–2030 ($MILLION)
TABLE 39.EUROPE LUXURY SUNGLASS MARKET, BY END USER, 2020–2030 ($MILLION)
TABLE 40.EUROPE LUXURY SUNGLASS MARKET, BY DISTRIBUTION CHANNEL, 2020–2030 ($MILLION)
TABLE 41.EUROPE LUXURY SUNGLASS MARKET, BY COUNTRY, 2020–2030 ($MILLION)
TABLE 42.GERMANY LUXURY SUNGLASS MARKET, BY PRODUCT TYPE, 2020–2030 ($MILLION)
TABLE 43.GERMANY. LUXURY SUNGLASS MARKET, BY FRAME MATERIAL, 2020–2030 ($MILLION)
TABLE 44.GERMANY LUXURY SUNGLASS MARKET, BY END USER, 2020–2030 ($MILLION)
TABLE 45.GERMANY LUXURY SUNGLASS MARKET, BY DISTRIBUTION CHANNEL, 2020–2030 ($MILLION)
TABLE 46.FRANCE LUXURY SUNGLASS MARKET, BY PRODUCT TYPE, 2020–2030 ($MILLION)
TABLE 47.FRANCE LUXURY SUNGLASS MARKET, BY FRAME MATERIAL, 2020–2030 ($MILLION)
TABLE 48.FRANCE LUXURY SUNGLASS MARKET, BY END USER, 2020–2030 ($MILLION)
TABLE 49.FRANCE LUXURY SUNGLASS MARKET, BY DISTRIBUTION CHANNEL, 2020–2030 ($MILLION)
TABLE 50.UK LUXURY SUNGLASS MARKET, BY PRODUCT TYPE, 2020–2030 ($MILLION)
TABLE 51.UK LUXURY SUNGLASS MARKET, BY FRAME MATERIAL, 2020–2030 ($MILLION)
TABLE 52.LUXURY SUNGLASS MARKET, BY END USER, 2020–2030 ($MILLION)
TABLE 53.UK LUXURY SUNGLASS MARKET, BY DISTRIBUTION CHANNEL, 2020–2030 ($MILLION)
TABLE 54.SPAIN LUXURY SUNGLASS MARKET, BY PRODUCT TYPE, 2020–2030 ($MILLION)
TABLE 55.SPAIN LUXURY SUNGLASS MARKET, BY FRAME MATERIAL, 2020–2030 ($MILLION)
TABLE 56.SPAIN LUXURY SUNGLASS MARKET, BY END USER, 2020–2030 ($MILLION)
TABLE 57.SPAIN LUXURY SUNGLASS MARKET, BY DISTRIBUTION CHANNEL, 2020–2030 ($MILLION)
TABLE 58.ITALY LUXURY SUNGLASS MARKET, BY PRODUCT TYPE, 2020–2030 ($MILLION)
TABLE 59.ITALY LUXURY SUNGLASS MARKET, BY FRAME MATERIAL, 2020–2030 ($MILLION)
TABLE 60.ITALY LUXURY SUNGLASS MARKET, BY END USER, 2020–2030 ($MILLION)
TABLE 61.ITALY LUXURY SUNGLASS MARKET, BY DISTRIBUTION CHANNEL, 2020–2030 ($MILLION)
TABLE 62.RUSSIA LUXURY SUNGLASS MARKET, BY PRODUCT TYPE, 2020–2030 ($MILLION)
TABLE 63.RUSSIA LUXURY SUNGLASS MARKET, BY FRAME MATERIAL, 2020–2030 ($MILLION)
TABLE 64.RUSSIA LUXURY SUNGLASS MARKET, BY END USER, 2020–2030 ($MILLION)
TABLE 65.RUSSIA LUXURY SUNGLASS MARKET, BY DISTRIBUTION CHANNEL, 2020–2030 ($MILLION)
TABLE 66.REST OF EUROPE LUXURY SUNGLASS MARKET, BY PRODUCT TYPE, 2020–2030 ($MILLION)
TABLE 67.REST OF EUROPE LUXURY SUNGLASS MARKET, BY FRAME MATERIAL, 2020–2030 ($MILLION)
TABLE 68.REST OF EUROPE LUXURY SUNGLASS MARKET, BY END USER, 2020–2030 ($MILLION)
TABLE 69.REST OF EUROPE LUXURY SUNGLASS MARKET, BY DISTRIBUTION CHANNEL, 2020–2030 ($MILLION)
TABLE 70.ASIA-PACIFIC LUXURY SUNGLASS MARKET, BY PRODUCT TYPE, 2020–2030 ($MILLION)
TABLE 71.ASIA-PACIFIC LUXURY SUNGLASS MARKET, BY FRAME MATERIAL, 2020–2030 ($MILLION)
TABLE 72.ASIA-PACIFIC LUXURY SUNGLASS MARKET, BY END USER, 2020–2030 ($MILLION)
TABLE 73.ASIA-PACIFIC LUXURY SUNGLASS MARKET, BY DISTRIBUTION CHANNEL, 2020–2030 ($MILLION)
TABLE 74.ASIA-PACIFIC LUXURY SUNGLASS MARKET, BY COUNTRY, 2020–2030 ($MILLION)
TABLE 75.CHINA LUXURY SUNGLASS MARKET, BY PRODUCT TYPE, 2020–2030 ($MILLION)
TABLE 76.CHINA LUXURY SUNGLASS MARKET, BY FRAME MATERIAL, 2020–2030 ($MILLION)
TABLE 77.CHINA LUXURY SUNGLASS MARKET, BY END USER, 2020–2030 ($MILLION)
TABLE 78.CHINA LUXURY SUNGLASS MARKET, BY DISTRIBUTION CHANNEL, 2020–2030 ($MILLION)
TABLE 79.JAPAN LUXURY SUNGLASS MARKET, BY PRODUCT TYPE, 2020–2030 ($MILLION)
TABLE 80.JAPAN LUXURY SUNGLASS MARKET, BY FRAME MATERIAL, 2020–2030 ($MILLION)
TABLE 81.JAPAN LUXURY SUNGLASS MARKET, BY END USER, 2020–2030 ($MILLION)
TABLE 82.JAPAN LUXURY SUNGLASS MARKET, BY DISTRIBUTION CHANNEL, 2020–2030 ($MILLION)
TABLE 83.INDIA LUXURY SUNGLASS MARKET, BY PRODUCT TYPE, 2020–2030 ($MILLION)
TABLE 84.INDIA LUXURY SUNGLASS MARKET, BY FRAME MATERIAL, 2020–2030 ($MILLION)
TABLE 85.INDIA LUXURY SUNGLASS MARKET, BY END USER, 2020–2030 ($MILLION)
TABLE 86.INDIA LUXURY SUNGLASS MARKET, BY DISTRIBUTION CHANNEL, 2020–2030 ($MILLION)
TABLE 87.AUSTRALIA LUXURY SUNGLASS MARKET, BY PRODUCT TYPE, 2020–2030 ($MILLION)
TABLE 88.AUSTRALIA LUXURY SUNGLASS MARKET, BY FRAME MATERIAL, 2020–2030 ($MILLION)
TABLE 89.AUSTRALIA LUXURY SUNGLASS MARKET, BY END USER, 2020–2030 ($MILLION)
TABLE 90.AUSTRALIA LUXURY SUNGLASS MARKET, BY DISTRIBUTION CHANNEL, 2020–2030 ($MILLION)
TABLE 91.SOUTH KOREA LUXURY SUNGLASS MARKET, BY PRODUCT TYPE, 2020–2030 ($MILLION)
TABLE 92.SOUTH KOREA LUXURY SUNGLASS MARKET, BY FRAME MATERIAL, 2020–2030 ($MILLION)
TABLE 93.SOUTH KOREA LUXURY SUNGLASS MARKET, BY END USER, 2020–2030 ($MILLION)
TABLE 94.SOUTH KOREA LUXURY SUNGLASS MARKET, BY DISTRIBUTION CHANNEL, 2020–2030 ($MILLION)
TABLE 95.INDONESIA LUXURY SUNGLASS MARKET, BY PRODUCT TYPE, 2020–2030 ($MILLION)
TABLE 96.INDONESIA LUXURY SUNGLASS MARKET, BY FRAME MATERIAL, 2020–2030 ($MILLION)
TABLE 97.INDONESIA LUXURY SUNGLASS MARKET, BY END USER, 2020–2030 ($MILLION)
TABLE 98.INDONESIA LUXURY SUNGLASS MARKET, BY DISTRIBUTION CHANNEL, 2020–2030 ($MILLION)
TABLE 99.SRILANKA LUXURY SUNGLASS MARKET, BY PRODUCT TYPE, 2020–2030 ($MILLION)
TABLE 100.SRI LANKA LUXURY SUNGLASS MARKET, BY FRAME MATERIAL, 2020–2030 ($MILLION)
TABLE 101.SRI LANKA LUXURY SUNGLASS MARKET, BY END USER, 2020–2030 ($MILLION)
TABLE 102.SRI LANKA LUXURY SUNGLASS MARKET, BY DISTRIBUTION CHANNEL, 2020–2030 ($MILLION)
TABLE 103.REST OF ASIA-PACIFIC LUXURY SUNGLASS MARKET, BY PRODUCT TYPE, 2020–2030 ($MILLION)
TABLE 104.REST OF ASIA-PACIFIC LUXURY SUNGLASS MARKET, BY FRAME MATERIAL, 2020–2030 ($MILLION)
TABLE 105.REST OF ASIA-PACIFIC LUXURY SUNGLASS MARKET, BY END USER, 2020–2030 ($MILLION)
TABLE 106.REST OF ASIA-PACIFIC LUXURY SUNGLASS MARKET, BY DISTRIBUTION CHANNEL, 2020–2030 ($MILLION)
TABLE 107.LAMEA LUXURY SUNGLASS MARKET, BY PRODUCT TYPE, 2020–2030 ($MILLION)
TABLE 108.LAMEA LUXURY SUNGLASS MARKET, BY FRAME MATERIAL, 2020–2030 ($MILLION)
TABLE 109.LAMEA LUXURY SUNGLASS MARKET, BY END USER, 2020–2030 ($MILLION)
TABLE 110.LAMEA LUXURY SUNGLASS MARKET, BY DISTRIBUTION CHANNEL, 2020–2030 ($MILLION)
TABLE 111.LAMEA LUXURY SUNGLASS MARKET, BY COUNTRY, 2020–2030 ($MILLION)
TABLE 112.BRAZIL LUXURY SUNGLASS MARKET, BY PRODUCT TYPE, 2020–2030 ($MILLION)
TABLE 113.BRAZIL LUXURY SUNGLASS MARKET, BY FRAME MATERIAL, 2020–2030 ($MILLION)
TABLE 114.BRAZIL LUXURY SUNGLASS MARKET, BY END USER, 2020–2030 ($MILLION)
TABLE 115.BRAZIL LUXURY SUNGLASS MARKET, BY DISTRIBUTION CHANNEL, 2020–2030 ($MILLION)
TABLE 116.ARGENTINA LUXURY SUNGLASS MARKET, BY PRODUCT TYPE, 2020–2030 ($MILLION)
TABLE 117.ARGENTINA LUXURY SUNGLASS MARKET, BY FRAME MATERIAL, 2020–2030 ($MILLION)
TABLE 118.ARGENTINA LUXURY SUNGLASS MARKET, BY END USER, 2020–2030 ($MILLION)
TABLE 119.ARGENTINA LUXURY SUNGLASS MARKET, BY DISTRIBUTION CHANNEL, 2020–2030 ($MILLION)
TABLE 120.UNITED EMIRATES ARAB LUXURY SUNGLASS MARKET, BY PRODUCT TYPE, 2020–2030 ($MILLION)
TABLE 121.UNITED EMIRATES ARAB LUXURY SUNGLASS MARKET, BY FRAME MATERIAL, 2020–2030 ($MILLION)
TABLE 122.UNITED EMIRATES ARAB LUXURY SUNGLASS MARKET, BY END USER, 2020–2030 ($MILLION)
TABLE 123.UNITED EMIRATES ARAB LUXURY SUNGLASS MARKET, BY DISTRIBUTION CHANNEL, 2020–2030 ($MILLION)
TABLE 124.NIGERIA LUXURY SUNGLASS MARKET, BY PRODUCT TYPE, 2020–2030 ($MILLION)
TABLE 125.NIGERIA LUXURY SUNGLASS MARKET, BY FRAME MATERIAL, 2020–2030 ($MILLION)
TABLE 126.NIGERIA LUXURY SUNGLASS MARKET, BY END USER, 2020–2030 ($MILLION)
TABLE 127.NIGERIA LUXURY SUNGLASS MARKET, BY DISTRIBUTION CHANNEL, 2020–2030 ($MILLION)
TABLE 128.TURKEY LUXURY SUNGLASS MARKET, BY PRODUCT TYPE, 2020–2030 ($MILLION)
TABLE 129.TURKEY LUXURY SUNGLASS MARKET, BY FRAME MATERIAL, 2020–2030 ($MILLION)
TABLE 130.TURKEY LUXURY SUNGLASS MARKET, BY END USER, 2020–2030 ($MILLION)
TABLE 131.TURKEY LUXURY SUNGLASS MARKET, BY DISTRIBUTION CHANNEL, 2020–2030 ($MILLION)
TABLE 132.SOUTH AFRICA LUXURY SUNGLASS MARKET, BY PRODUCT TYPE, 2020–2030 ($MILLION)
TABLE 133.SOUTH AFRICA LUXURY SUNGLASS MARKET, BY FRAME MATERIAL, 2020–2030 ($MILLION)
TABLE 134.SOUTH AFRICA LUXURY SUNGLASS MARKET, BY END USER, 2020–2030 ($MILLION)
TABLE 135.SOUTH AFRICA LUXURY SUNGLASS MARKET, BY DISTRIBUTION CHANNEL, 2020–2030 ($MILLION)
TABLE 136.REST OF LAMEA LUXURY SUNGLASS MARKET, BY PRODUCT TYPE, 2020–2030 ($MILLION)
TABLE 137.REST OF LAMEA LUXURY SUNGLASS MARKET, BY FRAME MATERIAL, 2020–2030 ($MILLION)
TABLE 138.REST OF LAMEA LUXURY SUNGLASS MARKET, BY END USER, 2020–2030 ($MILLION)
TABLE 139.REST OF LAMEA LUXURY SUNGLASS MARKET, BY DISTRIBUTION CHANNEL, 2020–2030 ($MILLION)
TABLE 140.CARL ZEISS AG: KEY EXECUTIVES
TABLE 141.CARL ZEISS AG: COMPANY SNAPSHOT
TABLE 142.CARL ZEISS AG: OPERATING SEGMENTS
TABLE 143.CARL ZEISS AG: PRODUCT PORTFOLIO
TABLE 144.CARL ZEISS AG: R&D EXPENDITURE, 2018–2020 ($MILLION)
TABLE 145.CARL ZEISS AG: NET SALES, 2018–2020 ($MILLION)
TABLE 146.ESSILORLUXOTTICA: KEY EXECUTIVES
TABLE 147.ESSILORLUXOTTICA SA: COMPANY SNAPSHOT
TABLE 148.ESSILORLUXOTTICA SA: OPERATING SEGMENTS
TABLE 149.ESSILORLUXOTTICA SA: PRODUCT PORTFOLIO
TABLE 150.ESSILORLUXOTTICA SA: R&D EXPENDITURE, 2017–2019 ($MILLION)
TABLE 151.ESSILORLUXOTTICA SA: NET SALES, 2017–2019 ($MILLION)
TABLE 152.GIORGIO ARMANI S.P.A.: KEY EXECUTIVES
TABLE 153.GIORGIO ARMANI S.P.A.: COMPANY SNAPSHOT
TABLE 154.GIORGIO ARMANI S.P.A.: PRODUCT PORTFOLIO
TABLE 155.GIORGIO ARMANI S.P.A.: NET SALES, 2017–2019 ($MILLION)
TABLE 156.GUCCIO GUCCI S.P.A: KEY EXECUTIVES
TABLE 157.GUCCIO GUCCI S.P.A: COMPANY SNAPSHOT
TABLE 158.GUCCIO GUCCI S.P.A: PRODUCT PORTFOLIO
TABLE 159.GUCCIO GUCCI S.P.A: NET SALES, 2018–2020 ($MILLION)
TABLE 160.LOCH EFFECTS: KEY EXECUTIVES
TABLE 161.LOCH EFFECTS: COMPANY SNAPSHOT
TABLE 162.LOCH EFFECTS: OPERATING SEGMENTS
TABLE 163.LOCH EFFECTS: PRODUCT PORTFOLIO
TABLE 164.LVMH MOËT HENNESSY - LOUIS VUITTON: KEY EXECUTIVES
TABLE 165.LVMH MOËT HENNESSY - LOUIS VUITTON: COMPANY SNAPSHOT
TABLE 166.LVMH MOËT HENNESSY - LOUIS VUITTON: OPERATING SEGMENTS
TABLE 167.LVMH MOËT HENNESSY - LOUIS VUITTON: PRODUCT PORTFOLIO
TABLE 168.LVMH MOËT HENNESSY - LOUIS VUITTON: NET SALES, 2018–2020 ($MILLION)
TABLE 169.MARCOLIN S.P.A.: KEY EXECUTIVES
TABLE 170.MARCOLIN S.P.A.: COMPANY SNAPSHOT
TABLE 171.MARCOLIN S.P.A.: OPERATING SEGMENTS
TABLE 172.MARCOLIN S.P.A.: PRODUCT PORTFOLIO
TABLE 173.MARCOLIN S.P.A.: NET SALES, 2017–2019 ($MILLION)
TABLE 174.PRADA HOLDING S.P.A.: KEY EXECUTIVES
TABLE 175.PRADA HOLDING S.P.A.: COMPANY SNAPSHOT
TABLE 176.PRADA HOLDING S.P.A.: PRODUCT PORTFOLIO
TABLE 177.PRADA HOLDING S.P.A.: NET SALES, 2018–2020 ($MILLION)
TABLE 178.RANDOLPH ENGINEERING INC.: KEY EXECUTIVES
TABLE 179.RANDOLPH ENGINEERING INC.: COMPANY SNAPSHOT
TABLE 180.RANDOLPH ENGINEERING, INC.: OPERATING SEGMENTS
TABLE 181.RANDOLPH ENGINEERING, INC.: PRODUCT PORTFOLIO
TABLE 182.SAFILO GROUP S.P.A.: KEY EXECUTIVES
TABLE 183.SAFILO GROUP S.P.A.: COMPANY SNAPSHOT
TABLE 184.SAFILO GROUP S.P.A.: OPERATING SEGMENTS
TABLE 185.SAFILO GROUP S.P.A.: PRODUCT PORTFOLIO
TABLE 186.SAFILO GROUP S.P.A.: R&D EXPENDITURE, 2017–2019 ($MILLION)
TABLE 187.SAFILO GROUP S.P.A.: NET SALES, 2017–2019 ($MILLION)

LIST OF FIGURES

FIGURE 01.GLOBAL LUXURY SUNGLASS MARKET SNAPSHOT
GLOBAL LUXURY SUNGLASS MARKET: SEGMENTATION
FIGURE 02.TOP INVESTMENT POCKETS
FIGURE 03.VALUE CHAIN ANALYSIS
FIGURE 04.LOW BARGAINING POWER OF SUPPLIERS
FIGURE 05.HIGH BARGAINING POWER OF BUYERS
FIGURE 06.LOW THREAT OF SUBSTITUTION
FIGURE 07.MODERATE THREAT OF NEW ENTRANTS
FIGURE 08.MODERATE INTENSITY OF COMPETITIVE RIVALRY
FIGURE 09.LUXURY SUNGLASS MARKET: DRIVERS, RESTRAINTS, AND OPPORTUNITIES
FIGURE 10.LUXURY SUNGLASS MARKET REVENUE, BY PRODUCT TYPE, 2020 ($MILLION)
FIGURE 11.COMPARATIVE SHARE ANALYSIS OF LUXURY SUNGLASS MARKET FOR POLARIZED, BY COUNTRY, 2020 & 2030(%)
FIGURE 12.COMPARATIVE SHARE ANALYSIS FOR LUXURY SUNGLASS MARKET FOR NON-POLARIZED, BY COUNTRY, 2020 & 2030(%)
FIGURE 13.LUXURY SUNGLASS MARKET, BY FRAME MATERIAL, 2020
FIGURE 14.COMPARATIVE SHARE ANALYSIS OF LUXURY SUNGLASS MARKET FOR ACETATE, BY COUNTRY, 2020 & 2030(%)
FIGURE 15.COMPARATIVE SHARE ANALYSIS OF LUXURY SUNGLASS MARKET FOR METAL, BY COUNTRY, 2020 & 2030 (%)
FIGURE 16.COMPARATIVE SHARE ANALYSIS OF LUXURY SUNGLASS MARKET FOR INJECTED, BY COUNTRY, 2020 & 2030 (%)
FIGURE 17.COMPARATIVE SHARE ANALYSIS OF LUXURY SUNGLASS MARKET FOR OTHERS, BY COUNTRY, 2020 & 2030 (%)
FIGURE 18.LUXURY SUNGLASS MARKET, BY END USER, 2020
FIGURE 19.COMPARATIVE SHARE ANALYSIS OF LUXURY SUNGLASS MARKET FOR MEN, BY COUNTRY, 2020 & 2030 (%)
FIGURE 20.COMPARATIVE SHARE ANALYSIS OF LUXURY SUNGLASS MARKET FOR WOMEN, BY COUNTRY, 2021 & 2030 (%)
FIGURE 21.COMPARATIVE SHARE ANALYSIS OF LUXURY SUNGLASS MARKET FOR UNISEX, BY COUNTRY, 2020 & 2030 (%)
FIGURE 22.LUXURY SUNGLASS MARKET, BY DISTRIBUTION CHANNEL, 2020
FIGURE 23.COMPARATIVE SHARE ANALYSIS OF LUXURY SUNGLASS MARKET FOR SUPERMARKETS/HYPERMARKETS, BY COUNTRY, 2020 & 2030 (%)
FIGURE 24.COMPARATIVE SHARE ANALYSIS OF LUXURY SUNGLASS MARKET FOR SPECIALTY STORES, BY COUNTRY, 2020 & 2030 (%)
FIGURE 25.COMPARATIVE SHARE ANALYSIS OF LUXURY SUNGLASS MARKET FOR CONVENIENCE STORES, BY COUNTRY, 2020 & 2030 (%)
FIGURE 26.COMPARATIVE SHARE ANALYSIS OF LUXURY SUNGLASS MARKET FOR ONLINE STORES, BY COUNTRY, 2020 & 2030 (%)
FIGURE 27.COMPARATIVE SHARE ANALYSIS OF LUXURY SUNGLASS MARKET FOR OTHERS, BY COUNTRY, 2020 & 2030 (%)
FIGURE 28.LUXURY SUNGLASS MARKET, BY REGION, 2020 (%)
FIGURE 29.U.S. LUXURY SUNGLASS MARKET, 2020–2030 ($MILLION)
FIGURE 30.CANADA LUXURY SUNGLASS MARKET, 2020–2030 ($MILLION)
FIGURE 31.MEXICO LUXURY SUNGLASS MARKET, 2020–2030 ($MILLION)
FIGURE 32.GERMANY LUXURY SUNGLASS MARKET, 2020–2030 ($MILLION)
FIGURE 33.FRANCE LUXURY SUNGLASS MARKET, 2020–2030 ($MILLION)
FIGURE 34.UK LUXURY SUNGLASS MARKET, 2020–2030 ($MILLION)
FIGURE 35.SPAIN LUXURY SUNGLASS MARKET, 2020–2030 ($MILLION)
FIGURE 36.ITALY LUXURY SUNGLASS MARKET, 2020–2030 ($MILLION)
FIGURE 37.RUSSIA LUXURY SUNGLASS MARKET, 2020–2030 ($MILLION)
FIGURE 38.REST OF EUROPE LUXURY SUNGLASS MARKET, 2020–2030 ($MILLION)
FIGURE 39.CHINA LUXURY SUNGLASS MARKET, 2020–2030 ($MILLION)
FIGURE 40.JAPAN LUXURY SUNGLASS MARKET, 2020–2030 ($MILLION)
FIGURE 41.INDIA LUXURY SUNGLASS MARKET, 2020–2030 ($MILLION)
FIGURE 42.AUSTRALIA LUXURY SUNGLASS MARKET, 2020–2030 ($MILLION)
FIGURE 43.SOUTH KOREA LUXURY SUNGLASS MARKET, 2020–2030 ($MILLION)
FIGURE 44.INDONESIA LUXURY SUNGLASS MARKET, 2020–2030 ($MILLION)
FIGURE 45.SRI LANKA LUXURY SUNGLASS MARKET, 2020–2030 ($MILLION)
FIGURE 46.REST OF ASIA-PACIFIC LUXURY SUNGLASS MARKET, 2020–2030 ($MILLION)
FIGURE 47.BRAZIL LUXURY SUNGLASS MARKET, 2020–2030 ($MILLION)
FIGURE 48.ARGENTINA LUXURY SUNGLASS MARKET, 2020–2030 ($MILLION)
FIGURE 49.UNITED EMIRATES ARAB LUXURY SUNGLASS MARKET, 2020–2030 ($MILLION)
FIGURE 50.NIGERIA LUXURY SUNGLASS MARKET, 2020–2030 ($MILLION)
FIGURE 51.TURKEY LUXURY SUNGLASS MARKET, 2020–2030 ($MILLION)
FIGURE 52.SOUTH AFRICA LUXURY SUNGLASS MARKET, 2020–2030 ($MILLION)
FIGURE 53.REST OF LAMEA LUXURY SUNGLASS MARKET, 2020–2030 ($MILLION)
FIGURE 54.TOP WINNING STRATEGIES, BY YEAR, 2018–2021*
FIGURE 55.TOP WINNING STRATEGIES, BY DEVELOPMENT, 2018–2021* (%)
FIGURE 56.TOP WINNING STRATEGIES, BY COMPANY, 2018–2021*
FIGURE 57.PRODUCT MAPPING OF TOP 10 KEY PLAYERS
FIGURE 58.COMPETITIVE DASHBOARD OF TOP 10 KEY PLAYERS
FIGURE 59.COMPETITIVE HEATMAP OF TOP 10 KEY PLAYERS
FIGURE 60.CARL ZEISS AG: R&D EXPENDITURE, 2018–2020 ($MILLION)
FIGURE 61.CARL ZEISS AG: NET SALES, 2018–2020 ($MILLION)
FIGURE 62.CARL ZEISS AG: REVENUE SHARE BY SEGMENT, 2020 (%)
FIGURE 63.CARL ZEISS AG: REVENUE SHARE BY REGION, 2020 (%)
FIGURE 64.R&D EXPENDITURE OF ESSILORLUXOTTICA, 2017-2019 ($MILLION)
FIGURE 65.ESSILORLUXOTTICA SA: NET SALES, 2017–2019 ($MILLION)
FIGURE 66.ESSILORLUXOTTICA SA: REVENUE SHARE BY SEGMENT, 2019 (%)
FIGURE 67.ESSILORLUXOTTICA SA: REVENUE SHARE BY GEOGRAPHY, 2019 (%)
FIGURE 68.GIORGIO ARMANI S.P.A.: NET SALES, 2017–2019 ($MILLION)
FIGURE 69.GUCCIO GUCCI S.P.A: NET SALES, 2018–2020 ($MILLION)
FIGURE 70.GUCCIO GUCCI S.P.A: REVENUE SHARE BY BRAND, 2020 (%)
FIGURE 71.LVMH MOËT HENNESSY - LOUIS VUITTON: NET SALES, 2018–2020 ($MILLION)
FIGURE 72.LVMH MOËT HENNESSY - LOUIS VUITTON: REVENUE SHARE BY SEGMENT, 2020 (%)
FIGURE 73.LVMH MOËT HENNESSY - LOUIS VUITTON: REVENUE SHARE BY REGION, 2020 (%)
FIGURE 74.MARCOLIN S.P.A.: NET SALES, 2017–2019 ($MILLION)
FIGURE 75.MARCOLIN S.P.A.: REVENUE SHARE BY REGION, 2019 (%)
FIGURE 76.PRADA HOLDING S.P.A.: NET SALES, 2018–2020 ($MILLION)
FIGURE 77.PRADA HOLDING S.P.A.: REVENUE SHARE BY REGION, 2020 (%)
FIGURE 78.SAFILO GROUP S.P.A.: R&D EXPENDITURE, 2017–2019 ($MILLION)
FIGURE 79.SAFILO GROUP S.P.A.: NET SALES, 2017–2019 ($MILLION)
FIGURE 80.SAFILO GROUP S.P.A.: REVENUE SHARE BY SEGMENT, 2019 (%)
FIGURE 81.SAFILO GROUP S.P.A.: REVENUE SHARE BY GEOGRAPHY, 2019 (%)


According to the CXOs of leading companies, innovation is the key for the growth of the global luxury sunglass market in terms of value sales. Rise in demand for various wearable devices among the target customer makes way for the manufacturers to come up with sports sunglasses comprising features such as polarized lenses, hydrophobic coating, and Bluetooth wireless connectivity.   

The online distribution and sales channel will play a crucial role in the forthcoming years for the growth of the global luxury sunglass market. The online stores has a very low market share, and is yet to witness significant growth during the forecast period. Further, technological advancements, such as 3D try-on, developed by various market players on their website are trying to compete with offline channels to provide the customer best user experience while sitting at home. Social media platforms, celebrity endorsements, and social media influencers have a major role to play in the growth of the global luxury sunglass market.

Moreover, the outbreak of COVID-19 pandemic has made it a compulsion for the market players to invest and develop their digital sales channel to compete in the market. As a result, major companies are investing substantially in digitization and various other online platforms to get off to a flying start in the post COVID-19 period.

PURCHASE OPTIONS

Call or Email us

U.S.-Canada Toll-free: +1-800-792-5285
Int'l : +1-503-894-6022
Europe : +44-845-528-1300
Email : help@alliedmarketresearch.com
 
FREQUENTLY ASKED QUESTIONS?

A. The marker value of the luxury sunglass market report is $4.1 Billion in 2020 and is expected to reach $6.9 Billion in 2030.

A. The Forecast period in the Luxury Sunglass Market report is from 2021 to 2030.

A. The base year calculated in the Luxury Sunglass Market report is 2020.

A. Carl Zeiss AG, EssilorLuxottica SA, Giorgio Armani S.p.A., Guccio Gucci S.p.A, Loch Effects, LVMH Moët Hennessy Louis Vuitton, Marcolin S.p.A., Prada S.p.A, Randolph Engineering, Inc, and Safilo Group SpA are the top companies in the market.

A. Non-polarized segment is the most influencing segment growing in the Luxury Sunglass Market report.

A. North America holds the maximum market share of the market.

A. Based on the top companies and their business performance and strategies the companies are selected.

A. The market value of the market in $4.1 Billion in 2020.

Looking for Customization?

 Customization Request

Have a Question?

 Speak with Analyst

Any Confusion?

 Inquire Before Buying

Have a glance of the Report

  Request Sample
RELATED TAGS

Purchase Full Report of
Luxury Sunglass Market

Start reading instantly.
This Report and over 67,404+ more Reports, Available with Avenue Library. T&C*.

  • Online Only
  • $3,712
  • Online cloud access only
  • Restricted print, copy, paste & download
  • Read only
  • Free industry update
    (Within 180 days)
  • Free report update in next update cycle
    (Jul 2022 - Jul 2023)
  • Data Pack
  • $4,125
  • Restricted to one authorized user
  • One print only
  • Available in
    Excel
  • Free industry update
    (Within 180 days)
  •   Free report update in next update cycle
    (Jul 2022 - Jul 2023)
  • Single User
  • $5,769
  • Restricted to one authorized user
  • One print only
  • Available in
    PDF
  • Free industry update
    (Within 180 days)
  •   Free report update in next update cycle
    (Jul 2022 - Jul 2023)
  • Five Users
  • $6,929
  • Limited to five authorized users
  • Print upto five copies
  • Available in
    PDF
  • Free industry update
    (Within 180 days)
  •   Free report update in next update cycle
    (Jul 2022 - Jul 2023)
  • Enterprise
    License/PDF

  • $10,663
  • Unlimited
    within
    company/enterprise
  • Available in Excel & PDF
  • Free industry update
    (Within 180 days)
  •   Free report update in next update cycle
    (Jul 2022 - Jul 2023)
  • Library
    Membership

  • $999 $ 1,175
    Per User/ Per month/ Billed annually
  • Published Content
    E-access
  • Company Profiles
    E-access
  • Newly Added Content Access
  • 10 PDF
    Downloads
  • 5 Excel Data
    Pack Downloads
  • 250 Company Profiles PDF Downloads
  • Buy Now

*Taxes/Fees, if applicable will be added during checkout. All prices in USD

RELATED REPORTS
 

Why Allied Market Research?


Infallible Methodology

To ensure high-level data integrity, accurate analysis, and impeccable forecasts

Analyst Support

For complete satisfaction

Customization

On-demand customization of scope of the report to exactly meet your needs

TARGETED MARKET VIEW

Targeted market view to provide pertinent information and save time of readers

Get fresh content delivered

Get insights on topics that are crucial for your business. Stay abreast of your interest areas.

Get Industry Data Alerts

Why Allied Market Research?

Infallible Methodology

To ensure high-level data integrity, accurate analysis, and impeccable forecasts

Analyst Support

For complete satisfaction

Customization

On-demand customization of scope of the report to exactly meet your needs

TARGETED MARKET VIEW

Targeted market view to provide pertinent information and save time of readers