0
2022
Magnesium Phosphate Market

Magnesium Phosphate Market

by Form (Monomagnesium Phosphate, Dimagnesium Phosphate , Trimagnesium Phosphate), by Application (Fertilizer, Animal Feed, Detergent, Food, Others): Global Opportunity Analysis and Industry Forecast, 2021-2030

Report Code: A16494
Jun 2022 | Pages: 210
Tables: 122
Charts: 64
  • Formats*:

  • pdf

    Single User License, Five User
    License & Enterprise User License

  • xls

    Data Pack Excel License

  • ppt

    It comes with the additional cost
    of $2500.00 contact sales.


Magnesium Phosphate Market Research, 2030

The global magnesium phosphate market was valued at $1.4 billion in 2021, and is projected to reach $2.0 billion by 2030, growing at a CAGR of 4.1% from 2022 to 2030. 
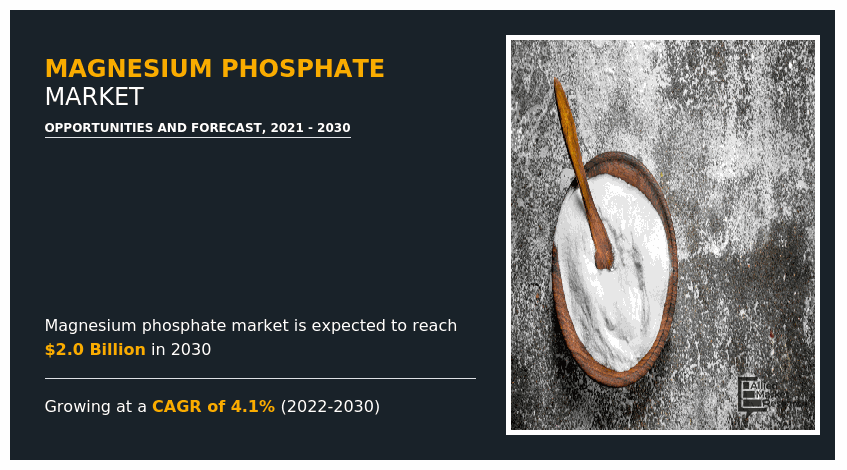
COVID-19 has negatively impacted the magnesium phosphate industry demand owing to delay in the availability of raw materials and a decline in demand from end-use industries such as fertilizers, animal feed, and food supplements.

Magnesium Phosphate Market, Magnesium Phosphate Market Size, Magnesium Phosphate Market Share, Magnesium Phosphate Market Trend, Magnesium Phosphate Market Growth, Magnesium Phosphate Market Forecast, -, -, -

The magnesium phosphate market is segmented into Form and Application.

Magnesium phosphate is a salt of magnesium and phosphate which occurs in several forms and hydrates. Magnesium phosphate is an important mineral that occurs naturally in plants, bones, and seeds such as avocado seeds. All the magnesium phosphate salts namely monomagnesium, dimagnesium, and trimagnesium are present in crystalline form and do not have any odor. Dietary sources of magnesium include whole grains, legumes, seeds, nuts, and vegetables. It is largely used in medication to support relaxation of muscles and prevent the deficiency of vitamin E. It is also used in food supplements as an emulsifier and anticaking agent. It is also used in prescribed limits in infant formula as a food stabilizer. It also helps in regulating the neuromuscular activity of the heart and helps in metabolizing calcium and vitamin C.

Magnesium phosphate has various applications in detergents, animal feed, food, fertilizer, water treatment, and construction. For instance, utilization of phosphate feed additive in animal feed, is anticipated to show excellent growth owing to increase in meat consumption, growing demand for effective replacements for antibiotics, use to combat diseases, and growing need to boost the livestock and poultry performance. The magnesium phosphate feed additive is gaining huge popularity in recent years. For instance, Yara UK Limited, a leading manufacturer of specialty chemicals, offers magnesium phosphate feed grade additive named Bolifor® MGP+ which contains magnesium phosphate and sulphur. This feed grade is widely used as concentrates and mineral supplements to prevent the deficiency of magnesium and phosphorous in poultry, horses, cattle, pigs, and other animals. This feed grade is available in the form of off-white granules which is highly soluble in diluted acids and odorless with neutral taste.   

The global magnesium phosphate market is segmented on the basis of form and application. By form, magnesium phosphate market is segmented into monomagnesium phosphate, dimagnesium phosphate, and trimagnesium phosphate. By application, the market is classified into fertilizer, animal feed, detergent, food, and others. By region, the market is analyzed across North America, Europe, Asia-Pacific, and LAMEA.

The key players profiled in this report include Jost Chemical Co, Innophos Holdings, Inc., Triveni Chemicals, Refractory Minerals, Celtic Chemicals Ltd, KRONOX Lab Sciences Ltd., Anmol Chemicals, Nikunj Chemicals, Hap Seng, and American Elements.
Magnesium Phosphate Market

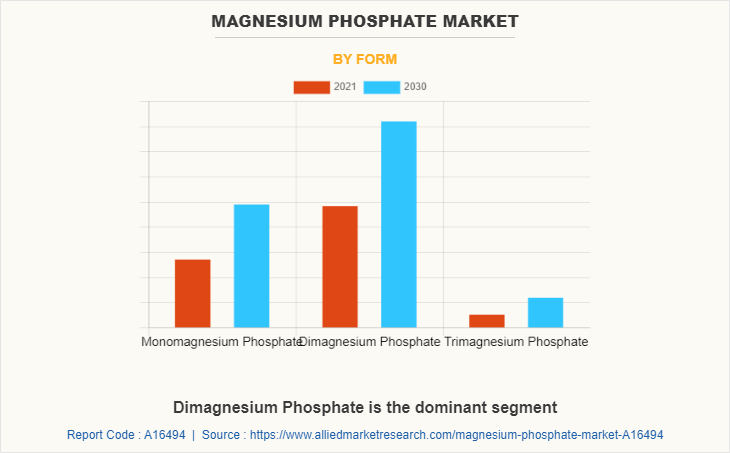
By form, the dimagnesium phosphate sub-segment dominated the global magnesium phosphate market size in 2021 and is projected to remain the fastest-growing sub-segment during the forecast period. This is majorly owing to wide range of applications of dimagnesium phosphate or magnesium phosphate dibasic across various end-use industries namely food additives, nutritional supplements, infant formula, and others. Also, it used in making muffins, cakes, doughnuts, pancakes, wafers, baking powders, refrigerated doughs, and others. Also, dimagnesium phosphate is generally recognized as safe (GRAS) by Food and Drug Administration (FDA), the federal agency headquartered in the U.S.
Magnesium Phosphate Market

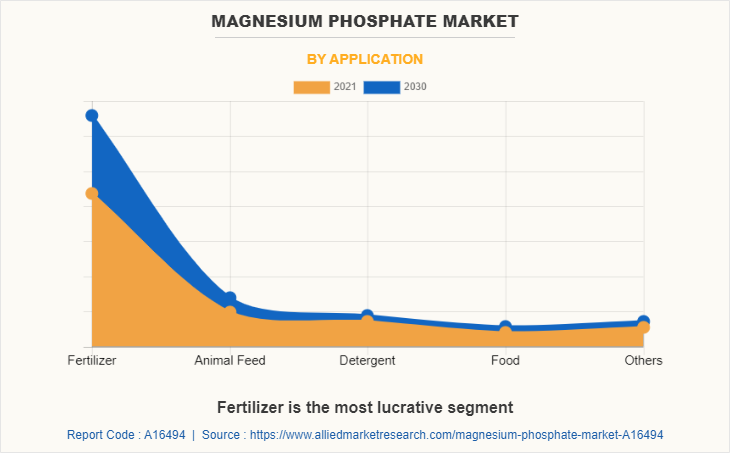
By application, the fertilizer sub-segment dominated the global magnesium phosphate market in 2021 and is projected to remain the fastest-growing sub-segment during the forecast period. This growth is majorly attributed to the benefits of phosphorous which is an essential nutrient that promotes plant growth. Also, phosphate-based fertilizers promote seed development, root development, and plant maturation. Also, magnesium phosphate fertilizers help the plants to withstand harsh environmental conditions. Phosphate-based fertilizers enhance the development of healthy, web-like root system which is necessary for the growth of plants. Also, it boosts the formation of flowers and seeds. These fertilizers also improve plant resilience against various diseases.
Magnesium Phosphate Market

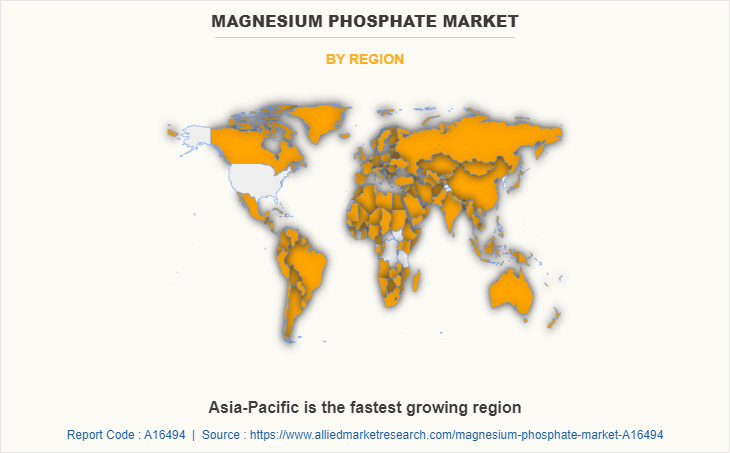
By region, Asia-Pacific dominated the global magnesium phosphate market in 2021 and is projected to remain the fastest-growing sub-segment during the forecast period. In the Asia-Pacific region, India, China, and others account for high fertilizer consumption owing to growing population and presence of large arable land. Also, growing demand for animal feed supplements in this region is anticipated to drive the magnesium phosphate market. In addition, as stated by the U.S. Geological Survey (USGS), the leading scientific agency of United States, the Asia-Pacific region is estimated to account for majority of the phosphate fertilizers consumption by 2024. Along with fertilizers, the growing demand for animal feed supplements is anticipated to boost the Asia-Pacific magnesium phosphate market growth during the forecast period.

KEY BENEFITS FOR STAKEHOLDERS

  • The report provides an in-depth analysis of the global magnesium phosphate market trends along with the current and future market forecast.
  • This report highlights the key drivers, opportunities, and restraints of the market along with the impact analyses during the forecast period.
  • Porter’s five forces analysis helps analyze the potential of the buyers & suppliers and the competitive scenario of the global magnesium phosphate market for strategy building.
  • A comprehensive global magnesium phosphate market analysis covers factors that drive and restrain the market growth.
  • The qualitative data in this report aims on market dynamics, trends, magnesium phosphate market forecast and developments.

IMPACT OF COVID-19 ON THE GLOBAL MAGNESIUM PHOSPHATE MARKET

  • Sales of magnesium phosphate are directly proportional to the demand for fertilizers, animal feed, and food supplements. However, the demand for magnesium phosphate fertilizers was greatly affected owing to import-export restrictions, closed borders, and supply chain disruptions.
  • COVID-19 has negatively impacted various industries which has led to a decline in fertilizer production due to shortage of labor and delay in the availability of raw materials. Due to this, there is a sluggish decline in the demand for magnesium phosphate due to impact of COVID-19.
  • Furthermore, China is the leading exporter of phosphoric acid and phosphate required for manufacturing of fertilizers. However, China being the epicenter of the coronavirus outbreak, its export was drastically reduced which has led to stock piling of raw materials thereby affecting the magnesium phosphate production.
  • According to World Bank Group, the leading international financial institution, in June 2020, the fertilizer prices including the price for magnesium phosphate fertilizers declined by around 8.5%. This is majorly owing to lower feedstock cost, closed borders, low seasonal demand, lockdown, and quarantines.

Magnesium Phosphate Market Report Highlights

Aspects Details
By Form
  • Monomagnesium Phosphate
  • Dimagnesium Phosphate 
  • Trimagnesium Phosphate
By Application
  • Fertilizer
  • Animal Feed
  • Detergent
  • Food
  • Others
By Region
  • North America 
  • Europe 
  • Asia-Pacific 
  • LAMEA 
Key Market Players Nikunj Chemicals, Refractory Minerals Co., Inc., Hap Seng, Jost Chemical Co., Innophos Holdings, Inc., American Elements, Triveni Chemicals, KRONOX Lab Sciences Ltd, Celtic Chemicals Ltd, Anmol Chemicals
 
  • CHAPTER 1:INTRODUCTION

    • 1.1.Report description

    • 1.2.Key market segments

    • 1.3.Key benefits to the stakeholders

    • 1.4.Research Methodology

      • 1.4.1.Secondary research

      • 1.4.2.Primary research

      • 1.4.3.Analyst tools and models

  • CHAPTER 2:EXECUTIVE SUMMARY

    • 2.1.Key findings of the study

    • 2.2.CXO Perspective

  • CHAPTER 3:MARKET OVERVIEW

    • 3.1.Market definition and scope

    • 3.2.Key findings

      • 3.2.1.Top investment pockets

    • 3.3.Porter’s five forces analysis

    • 3.4.Top player positioning

    • 3.5.Market dynamics

      • 3.5.1.Drivers

      • 3.5.2.Restraints

      • 3.5.3.Opportunities

    • 3.6.COVID-19 Impact Analysis on the market

    • 3.7.Value Chain Analysis

    • 3.8.Regulatory Guidelines

    • 3.9.Market Share Analysis

    • 3.10.Key Regulation Analysis

    • 3.11.Patent Landscape

  • CHAPTER 4: MAGNESIUM PHOSPHATE MARKET, BY FORM

    • 4.1 Overview

      • 4.1.1 Market size and forecast

    • 4.2 Monomagnesium Phosphate

      • 4.2.1 Key market trends, growth factors and opportunities

      • 4.2.2 Market size and forecast, by region

      • 4.2.3 Market analysis by country

    • 4.3 Dimagnesium Phosphate 

      • 4.3.1 Key market trends, growth factors and opportunities

      • 4.3.2 Market size and forecast, by region

      • 4.3.3 Market analysis by country

    • 4.4 Trimagnesium Phosphate

      • 4.4.1 Key market trends, growth factors and opportunities

      • 4.4.2 Market size and forecast, by region

      • 4.4.3 Market analysis by country

  • CHAPTER 5: MAGNESIUM PHOSPHATE MARKET, BY APPLICATION

    • 5.1 Overview

      • 5.1.1 Market size and forecast

    • 5.2 Fertilizer

      • 5.2.1 Key market trends, growth factors and opportunities

      • 5.2.2 Market size and forecast, by region

      • 5.2.3 Market analysis by country

    • 5.3 Animal Feed

      • 5.3.1 Key market trends, growth factors and opportunities

      • 5.3.2 Market size and forecast, by region

      • 5.3.3 Market analysis by country

    • 5.4 Detergent

      • 5.4.1 Key market trends, growth factors and opportunities

      • 5.4.2 Market size and forecast, by region

      • 5.4.3 Market analysis by country

    • 5.5 Food

      • 5.5.1 Key market trends, growth factors and opportunities

      • 5.5.2 Market size and forecast, by region

      • 5.5.3 Market analysis by country

    • 5.6 Others

      • 5.6.1 Key market trends, growth factors and opportunities

      • 5.6.2 Market size and forecast, by region

      • 5.6.3 Market analysis by country

  • CHAPTER 6: MAGNESIUM PHOSPHATE MARKET, BY REGION

    • 6.1 Overview

      • 6.1.1 Market size and forecast

    • 6.2 North America

      • 6.2.1 Key trends and opportunities

      • 6.2.2 North America Market size and forecast, by Form

      • 6.2.3 North America Market size and forecast, by Application

      • 6.2.4 North America Market size and forecast, by country

        • 6.2.4.1 U.S.
          • 6.2.4.1.1 Market size and forecast, by Form
          • 6.2.4.1.2 Market size and forecast, by Application
        • 6.2.4.2 Canada
          • 6.2.4.2.1 Market size and forecast, by Form
          • 6.2.4.2.2 Market size and forecast, by Application
        • 6.2.4.3 Mexico
          • 6.2.4.3.1 Market size and forecast, by Form
          • 6.2.4.3.2 Market size and forecast, by Application
    • 6.3 Europe

      • 6.3.1 Key trends and opportunities

      • 6.3.2 Europe Market size and forecast, by Form

      • 6.3.3 Europe Market size and forecast, by Application

      • 6.3.4 Europe Market size and forecast, by country

        • 6.3.4.1 Germany
          • 6.3.4.1.1 Market size and forecast, by Form
          • 6.3.4.1.2 Market size and forecast, by Application
        • 6.3.4.2 U.K.
          • 6.3.4.2.1 Market size and forecast, by Form
          • 6.3.4.2.2 Market size and forecast, by Application
        • 6.3.4.3 France
          • 6.3.4.3.1 Market size and forecast, by Form
          • 6.3.4.3.2 Market size and forecast, by Application
        • 6.3.4.4 Spain
          • 6.3.4.4.1 Market size and forecast, by Form
          • 6.3.4.4.2 Market size and forecast, by Application
        • 6.3.4.5 Italy
          • 6.3.4.5.1 Market size and forecast, by Form
          • 6.3.4.5.2 Market size and forecast, by Application
        • 6.3.4.6 Rest of Europe
          • 6.3.4.6.1 Market size and forecast, by Form
          • 6.3.4.6.2 Market size and forecast, by Application
    • 6.4 Asia-Pacific

      • 6.4.1 Key trends and opportunities

      • 6.4.2 Asia-Pacific Market size and forecast, by Form

      • 6.4.3 Asia-Pacific Market size and forecast, by Application

      • 6.4.4 Asia-Pacific Market size and forecast, by country

        • 6.4.4.1 China
          • 6.4.4.1.1 Market size and forecast, by Form
          • 6.4.4.1.2 Market size and forecast, by Application
        • 6.4.4.2 Japan
          • 6.4.4.2.1 Market size and forecast, by Form
          • 6.4.4.2.2 Market size and forecast, by Application
        • 6.4.4.3 India
          • 6.4.4.3.1 Market size and forecast, by Form
          • 6.4.4.3.2 Market size and forecast, by Application
        • 6.4.4.4 South Korea
          • 6.4.4.4.1 Market size and forecast, by Form
          • 6.4.4.4.2 Market size and forecast, by Application
        • 6.4.4.5 Australia
          • 6.4.4.5.1 Market size and forecast, by Form
          • 6.4.4.5.2 Market size and forecast, by Application
        • 6.4.4.6 Rest of Asia-Pacific
          • 6.4.4.6.1 Market size and forecast, by Form
          • 6.4.4.6.2 Market size and forecast, by Application
    • 6.5 LAMEA

      • 6.5.1 Key trends and opportunities

      • 6.5.2 LAMEA Market size and forecast, by Form

      • 6.5.3 LAMEA Market size and forecast, by Application

      • 6.5.4 LAMEA Market size and forecast, by country

        • 6.5.4.1 Brazil
          • 6.5.4.1.1 Market size and forecast, by Form
          • 6.5.4.1.2 Market size and forecast, by Application
        • 6.5.4.2 Saudi Arabia
          • 6.5.4.2.1 Market size and forecast, by Form
          • 6.5.4.2.2 Market size and forecast, by Application
        • 6.5.4.3 UAE
          • 6.5.4.3.1 Market size and forecast, by Form
          • 6.5.4.3.2 Market size and forecast, by Application
        • 6.5.4.4 South Africa
          • 6.5.4.4.1 Market size and forecast, by Form
          • 6.5.4.4.2 Market size and forecast, by Application
        • 6.5.4.5 Rest of LAMEA
          • 6.5.4.5.1 Market size and forecast, by Form
          • 6.5.4.5.2 Market size and forecast, by Application
  • CHAPTER 7: COMPANY LANDSCAPE

    • 7.1. Introduction

    • 7.2. Top winning strategies

    • 7.3. Product Mapping of Top 10 Player

    • 7.4. Competitive Dashboard

    • 7.5. Competitive Heatmap

    • 7.6. Key developments

  • CHAPTER 8: COMPANY PROFILES

    • 8.1 Innophos Holdings, Inc.

      • 8.1.1 Company overview

      • 8.1.2 Company snapshot

      • 8.1.3 Operating business segments

      • 8.1.4 Product portfolio

      • 8.1.5 Business performance

      • 8.1.6 Key strategic moves and developments

    • 8.2 Refractory Minerals Co., Inc.

      • 8.2.1 Company overview

      • 8.2.2 Company snapshot

      • 8.2.3 Operating business segments

      • 8.2.4 Product portfolio

      • 8.2.5 Business performance

      • 8.2.6 Key strategic moves and developments

    • 8.3 Celtic Chemicals Ltd

      • 8.3.1 Company overview

      • 8.3.2 Company snapshot

      • 8.3.3 Operating business segments

      • 8.3.4 Product portfolio

      • 8.3.5 Business performance

      • 8.3.6 Key strategic moves and developments

    • 8.4 KRONOX Lab Sciences Ltd

      • 8.4.1 Company overview

      • 8.4.2 Company snapshot

      • 8.4.3 Operating business segments

      • 8.4.4 Product portfolio

      • 8.4.5 Business performance

      • 8.4.6 Key strategic moves and developments

    • 8.5 Anmol Chemicals

      • 8.5.1 Company overview

      • 8.5.2 Company snapshot

      • 8.5.3 Operating business segments

      • 8.5.4 Product portfolio

      • 8.5.5 Business performance

      • 8.5.6 Key strategic moves and developments

    • 8.6 Nikunj Chemicals

      • 8.6.1 Company overview

      • 8.6.2 Company snapshot

      • 8.6.3 Operating business segments

      • 8.6.4 Product portfolio

      • 8.6.5 Business performance

      • 8.6.6 Key strategic moves and developments

    • 8.7 Hap Seng

      • 8.7.1 Company overview

      • 8.7.2 Company snapshot

      • 8.7.3 Operating business segments

      • 8.7.4 Product portfolio

      • 8.7.5 Business performance

      • 8.7.6 Key strategic moves and developments

    • 8.8 American Elements

      • 8.8.1 Company overview

      • 8.8.2 Company snapshot

      • 8.8.3 Operating business segments

      • 8.8.4 Product portfolio

      • 8.8.5 Business performance

      • 8.8.6 Key strategic moves and developments

    • 8.9 Jost Chemical Co.

      • 8.9.1 Company overview

      • 8.9.2 Company snapshot

      • 8.9.3 Operating business segments

      • 8.9.4 Product portfolio

      • 8.9.5 Business performance

      • 8.9.6 Key strategic moves and developments

    • 8.10 Triveni Chemicals

      • 8.10.1 Company overview

      • 8.10.2 Company snapshot

      • 8.10.3 Operating business segments

      • 8.10.4 Product portfolio

      • 8.10.5 Business performance

      • 8.10.6 Key strategic moves and developments

  • LIST OF TABLES

  • TABLE 1. GLOBAL MAGNESIUM PHOSPHATE MARKET, BY FORM, 2021-2030,($MILLION)
    TABLE 2. MAGNESIUM PHOSPHATE MARKET REVENUE, FOR MONOMAGNESIUM PHOSPHATE, BY REGION , 2021-2030,($MILLION)
    TABLE 3. MAGNESIUM PHOSPHATE MARKET MONOMAGNESIUM PHOSPHATE BY COUNTRY, 2021-2030,($MILLION)
    TABLE 4. MAGNESIUM PHOSPHATE MARKET REVENUE, FOR DIMAGNESIUM PHOSPHATE , BY REGION , 2021-2030,($MILLION)
    TABLE 5. MAGNESIUM PHOSPHATE MARKET DIMAGNESIUM PHOSPHATE  BY COUNTRY, 2021-2030,($MILLION)
    TABLE 6. MAGNESIUM PHOSPHATE MARKET REVENUE, FOR TRIMAGNESIUM PHOSPHATE, BY REGION , 2021-2030,($MILLION)
    TABLE 7. MAGNESIUM PHOSPHATE MARKET TRIMAGNESIUM PHOSPHATE BY COUNTRY, 2021-2030,($MILLION)
    TABLE 8. GLOBAL MAGNESIUM PHOSPHATE MARKET, BY APPLICATION, 2021-2030,($MILLION)
    TABLE 9. MAGNESIUM PHOSPHATE MARKET REVENUE, FOR FERTILIZER, BY REGION , 2021-2030,($MILLION)
    TABLE 10. MAGNESIUM PHOSPHATE MARKET FERTILIZER BY COUNTRY, 2021-2030,($MILLION)
    TABLE 11. MAGNESIUM PHOSPHATE MARKET REVENUE, FOR ANIMAL FEED, BY REGION , 2021-2030,($MILLION)
    TABLE 12. MAGNESIUM PHOSPHATE MARKET ANIMAL FEED BY COUNTRY, 2021-2030,($MILLION)
    TABLE 13. MAGNESIUM PHOSPHATE MARKET REVENUE, FOR DETERGENT, BY REGION , 2021-2030,($MILLION)
    TABLE 14. MAGNESIUM PHOSPHATE MARKET DETERGENT BY COUNTRY, 2021-2030,($MILLION)
    TABLE 15. MAGNESIUM PHOSPHATE MARKET REVENUE, FOR FOOD, BY REGION , 2021-2030,($MILLION)
    TABLE 16. MAGNESIUM PHOSPHATE MARKET FOOD BY COUNTRY, 2021-2030,($MILLION)
    TABLE 17. MAGNESIUM PHOSPHATE MARKET REVENUE, FOR OTHERS, BY REGION , 2021-2030,($MILLION)
    TABLE 18. MAGNESIUM PHOSPHATE MARKET OTHERS BY COUNTRY, 2021-2030,($MILLION)
    TABLE 19. MAGNESIUM PHOSPHATE MARKET, BY REGION, 2021-2030,($MILLION)
    TABLE 20. NORTH AMERICA MAGNESIUM PHOSPHATE MARKET, BY FORM, 2021-2030,($MILLION)
    TABLE 21. NORTH AMERICA MAGNESIUM PHOSPHATE MARKET, BY APPLICATION, 2021-2030,($MILLION)
    TABLE 22. NORTH AMERICA MAGNESIUM PHOSPHATE MARKET, BY COUNTRY, 2021-2030,($MILLION)
    TABLE 23. U.S. MAGNESIUM PHOSPHATE MARKET BY FORM 2021-2030,($MILLION)
    TABLE 24. U.S. MAGNESIUM PHOSPHATE MARKET BY APPLICATION 2021-2030,($MILLION)
    TABLE 25. CANADA MAGNESIUM PHOSPHATE MARKET BY FORM 2021-2030,($MILLION)
    TABLE 26. CANADA MAGNESIUM PHOSPHATE MARKET BY APPLICATION 2021-2030,($MILLION)
    TABLE 27. MEXICO MAGNESIUM PHOSPHATE MARKET BY FORM 2021-2030,($MILLION)
    TABLE 28. MEXICO MAGNESIUM PHOSPHATE MARKET BY APPLICATION 2021-2030,($MILLION)
    TABLE 29. EUROPE MAGNESIUM PHOSPHATE MARKET, BY FORM, 2021-2030,($MILLION)
    TABLE 30. EUROPE MAGNESIUM PHOSPHATE MARKET, BY APPLICATION, 2021-2030,($MILLION)
    TABLE 31. EUROPE MAGNESIUM PHOSPHATE MARKET, BY COUNTRY, 2021-2030,($MILLION)
    TABLE 32. GERMANY MAGNESIUM PHOSPHATE MARKET BY FORM 2021-2030,($MILLION)
    TABLE 33. GERMANY MAGNESIUM PHOSPHATE MARKET BY APPLICATION 2021-2030,($MILLION)
    TABLE 34. U.K. MAGNESIUM PHOSPHATE MARKET BY FORM 2021-2030,($MILLION)
    TABLE 35. U.K. MAGNESIUM PHOSPHATE MARKET BY APPLICATION 2021-2030,($MILLION)
    TABLE 36. FRANCE MAGNESIUM PHOSPHATE MARKET BY FORM 2021-2030,($MILLION)
    TABLE 37. FRANCE MAGNESIUM PHOSPHATE MARKET BY APPLICATION 2021-2030,($MILLION)
    TABLE 38. SPAIN MAGNESIUM PHOSPHATE MARKET BY FORM 2021-2030,($MILLION)
    TABLE 39. SPAIN MAGNESIUM PHOSPHATE MARKET BY APPLICATION 2021-2030,($MILLION)
    TABLE 40. ITALY MAGNESIUM PHOSPHATE MARKET BY FORM 2021-2030,($MILLION)
    TABLE 41. ITALY MAGNESIUM PHOSPHATE MARKET BY APPLICATION 2021-2030,($MILLION)
    TABLE 42. REST OF EUROPE MAGNESIUM PHOSPHATE MARKET BY FORM 2021-2030,($MILLION)
    TABLE 43. REST OF EUROPE MAGNESIUM PHOSPHATE MARKET BY APPLICATION 2021-2030,($MILLION)
    TABLE 44. ASIA-PACIFIC MAGNESIUM PHOSPHATE MARKET, BY FORM, 2021-2030,($MILLION)
    TABLE 45. ASIA-PACIFIC MAGNESIUM PHOSPHATE MARKET, BY APPLICATION, 2021-2030,($MILLION)
    TABLE 46. ASIA-PACIFIC MAGNESIUM PHOSPHATE MARKET, BY COUNTRY, 2021-2030,($MILLION)
    TABLE 47. CHINA MAGNESIUM PHOSPHATE MARKET BY FORM 2021-2030,($MILLION)
    TABLE 48. CHINA MAGNESIUM PHOSPHATE MARKET BY APPLICATION 2021-2030,($MILLION)
    TABLE 49. JAPAN MAGNESIUM PHOSPHATE MARKET BY FORM 2021-2030,($MILLION)
    TABLE 50. JAPAN MAGNESIUM PHOSPHATE MARKET BY APPLICATION 2021-2030,($MILLION)
    TABLE 51. INDIA MAGNESIUM PHOSPHATE MARKET BY FORM 2021-2030,($MILLION)
    TABLE 52. INDIA MAGNESIUM PHOSPHATE MARKET BY APPLICATION 2021-2030,($MILLION)
    TABLE 53. SOUTH KOREA MAGNESIUM PHOSPHATE MARKET BY FORM 2021-2030,($MILLION)
    TABLE 54. SOUTH KOREA MAGNESIUM PHOSPHATE MARKET BY APPLICATION 2021-2030,($MILLION)
    TABLE 55. AUSTRALIA MAGNESIUM PHOSPHATE MARKET BY FORM 2021-2030,($MILLION)
    TABLE 56. AUSTRALIA MAGNESIUM PHOSPHATE MARKET BY APPLICATION 2021-2030,($MILLION)
    TABLE 57. REST OF ASIA-PACIFIC MAGNESIUM PHOSPHATE MARKET BY FORM 2021-2030,($MILLION)
    TABLE 58. REST OF ASIA-PACIFIC MAGNESIUM PHOSPHATE MARKET BY APPLICATION 2021-2030,($MILLION)
    TABLE 59. LAMEA MAGNESIUM PHOSPHATE MARKET, BY FORM, 2021-2030,($MILLION)
    TABLE 60. LAMEA MAGNESIUM PHOSPHATE MARKET, BY APPLICATION, 2021-2030,($MILLION)
    TABLE 61. LAMEA MAGNESIUM PHOSPHATE MARKET, BY COUNTRY, 2021-2030,($MILLION)
    TABLE 62. BRAZIL MAGNESIUM PHOSPHATE MARKET BY FORM 2021-2030,($MILLION)
    TABLE 63. BRAZIL MAGNESIUM PHOSPHATE MARKET BY APPLICATION 2021-2030,($MILLION)
    TABLE 64. SAUDI ARABIA MAGNESIUM PHOSPHATE MARKET BY FORM 2021-2030,($MILLION)
    TABLE 65. SAUDI ARABIA MAGNESIUM PHOSPHATE MARKET BY APPLICATION 2021-2030,($MILLION)
    TABLE 66. UAE MAGNESIUM PHOSPHATE MARKET BY FORM 2021-2030,($MILLION)
    TABLE 67. UAE MAGNESIUM PHOSPHATE MARKET BY APPLICATION 2021-2030,($MILLION)
    TABLE 68. SOUTH AFRICA MAGNESIUM PHOSPHATE MARKET BY FORM 2021-2030,($MILLION)
    TABLE 69. SOUTH AFRICA MAGNESIUM PHOSPHATE MARKET BY APPLICATION 2021-2030,($MILLION)
    TABLE 70. REST OF LAMEA MAGNESIUM PHOSPHATE MARKET BY FORM 2021-2030,($MILLION)
    TABLE 71. REST OF LAMEA MAGNESIUM PHOSPHATE MARKET BY APPLICATION 2021-2030,($MILLION)
    TABLE 72.INNOPHOS HOLDINGS, INC.: COMPANY SNAPSHOT
    TABLE 73.INNOPHOS HOLDINGS, INC.: OPERATING SEGMENTS
    TABLE 74.INNOPHOS HOLDINGS, INC.: PRODUCT PORTFOLIO
    TABLE 75.INNOPHOS HOLDINGS, INC.: NET SALES,
    TABLE 76.INNOPHOS HOLDINGS, INC.: KEY STRATERGIES
    TABLE 77.REFRACTORY MINERALS CO., INC.: COMPANY SNAPSHOT
    TABLE 78.REFRACTORY MINERALS CO., INC.: OPERATING SEGMENTS
    TABLE 79.REFRACTORY MINERALS CO., INC.: PRODUCT PORTFOLIO
    TABLE 80.REFRACTORY MINERALS CO., INC.: NET SALES,
    TABLE 81.REFRACTORY MINERALS CO., INC.: KEY STRATERGIES
    TABLE 82.CELTIC CHEMICALS LTD: COMPANY SNAPSHOT
    TABLE 83.CELTIC CHEMICALS LTD: OPERATING SEGMENTS
    TABLE 84.CELTIC CHEMICALS LTD: PRODUCT PORTFOLIO
    TABLE 85.CELTIC CHEMICALS LTD: NET SALES,
    TABLE 86.CELTIC CHEMICALS LTD: KEY STRATERGIES
    TABLE 87.KRONOX LAB SCIENCES LTD: COMPANY SNAPSHOT
    TABLE 88.KRONOX LAB SCIENCES LTD: OPERATING SEGMENTS
    TABLE 89.KRONOX LAB SCIENCES LTD: PRODUCT PORTFOLIO
    TABLE 90.KRONOX LAB SCIENCES LTD: NET SALES,
    TABLE 91.KRONOX LAB SCIENCES LTD: KEY STRATERGIES
    TABLE 92.ANMOL CHEMICALS: COMPANY SNAPSHOT
    TABLE 93.ANMOL CHEMICALS: OPERATING SEGMENTS
    TABLE 94.ANMOL CHEMICALS: PRODUCT PORTFOLIO
    TABLE 95.ANMOL CHEMICALS: NET SALES,
    TABLE 96.ANMOL CHEMICALS: KEY STRATERGIES
    TABLE 97.NIKUNJ CHEMICALS: COMPANY SNAPSHOT
    TABLE 98.NIKUNJ CHEMICALS: OPERATING SEGMENTS
    TABLE 99.NIKUNJ CHEMICALS: PRODUCT PORTFOLIO
    TABLE 100.NIKUNJ CHEMICALS: NET SALES,
    TABLE 101.NIKUNJ CHEMICALS: KEY STRATERGIES
    TABLE 102.HAP SENG: COMPANY SNAPSHOT
    TABLE 103.HAP SENG: OPERATING SEGMENTS
    TABLE 104.HAP SENG: PRODUCT PORTFOLIO
    TABLE 105.HAP SENG: NET SALES,
    TABLE 106.HAP SENG: KEY STRATERGIES
    TABLE 107.AMERICAN ELEMENTS: COMPANY SNAPSHOT
    TABLE 108.AMERICAN ELEMENTS: OPERATING SEGMENTS
    TABLE 109.AMERICAN ELEMENTS: PRODUCT PORTFOLIO
    TABLE 110.AMERICAN ELEMENTS: NET SALES,
    TABLE 111.AMERICAN ELEMENTS: KEY STRATERGIES
    TABLE 112.JOST CHEMICAL CO.: COMPANY SNAPSHOT
    TABLE 113.JOST CHEMICAL CO.: OPERATING SEGMENTS
    TABLE 114.JOST CHEMICAL CO.: PRODUCT PORTFOLIO
    TABLE 115.JOST CHEMICAL CO.: NET SALES,
    TABLE 116.JOST CHEMICAL CO.: KEY STRATERGIES
    TABLE 117.TRIVENI CHEMICALS: COMPANY SNAPSHOT
    TABLE 118.TRIVENI CHEMICALS: OPERATING SEGMENTS
    TABLE 119.TRIVENI CHEMICALS: PRODUCT PORTFOLIO
    TABLE 120.TRIVENI CHEMICALS: NET SALES,
    TABLE 121.TRIVENI CHEMICALS: KEY STRATERGIES
  • LIST OF FIGURES

  • FIGURE 1.MAGNESIUM PHOSPHATE MARKET SEGMENTATION
    FIGURE 2.MAGNESIUM PHOSPHATE MARKET,2021-2030
    FIGURE 3.MAGNESIUM PHOSPHATE MARKET,2021-2030
    FIGURE 4. TOP INVESTMENT POCKETS, BY REGION
    FIGURE 5.PORTER FIVE-1
    FIGURE 6.PORTER FIVE-2
    FIGURE 7.PORTER FIVE-3
    FIGURE 8.PORTER FIVE-4
    FIGURE 9.PORTER FIVE-5
    FIGURE 10.TOP PLAYER POSITIONING
    FIGURE 11.MAGNESIUM PHOSPHATE MARKET:DRIVERS, RESTRAINTS AND OPPORTUNITIES
    FIGURE 12.VALUE CHAIN ANALYSIS
    FIGURE 13.REGULATORY GUIDELINES
    FIGURE 14.MARKET SHARE ANALYSIS
    FIGURE 15.KEY REGULATION ANALYSIS
    FIGURE 16.PATENT ANALYSIS BY COMPANY
    FIGURE 17.PATENT ANALYSIS BY COUNTRY
    FIGURE 18.MAGNESIUM PHOSPHATE MARKET,BY FORM,2021(%)
    FIGURE 19.COMPARATIVE SHARE ANALYSIS OF MONOMAGNESIUM PHOSPHATE MAGNESIUM PHOSPHATE MARKET,2021-2030(%)
    FIGURE 20.COMPARATIVE SHARE ANALYSIS OF DIMAGNESIUM PHOSPHATE  MAGNESIUM PHOSPHATE MARKET,2021-2030(%)
    FIGURE 21.COMPARATIVE SHARE ANALYSIS OF TRIMAGNESIUM PHOSPHATE MAGNESIUM PHOSPHATE MARKET,2021-2030(%)
    FIGURE 22.MAGNESIUM PHOSPHATE MARKET,BY APPLICATION,2021(%)
    FIGURE 23.COMPARATIVE SHARE ANALYSIS OF FERTILIZER MAGNESIUM PHOSPHATE MARKET,2021-2030(%)
    FIGURE 24.COMPARATIVE SHARE ANALYSIS OF ANIMAL FEED MAGNESIUM PHOSPHATE MARKET,2021-2030(%)
    FIGURE 25.COMPARATIVE SHARE ANALYSIS OF DETERGENT MAGNESIUM PHOSPHATE MARKET,2021-2030(%)
    FIGURE 26.COMPARATIVE SHARE ANALYSIS OF FOOD MAGNESIUM PHOSPHATE MARKET,2021-2030(%)
    FIGURE 27.COMPARATIVE SHARE ANALYSIS OF OTHERS MAGNESIUM PHOSPHATE MARKET,2021-2030(%)
    FIGURE 28.MAGNESIUM PHOSPHATE MARKET BY REGION,2021
    FIGURE 29.U.S. MAGNESIUM PHOSPHATE MARKET,2021-2030($MILLION)
    FIGURE 30.CANADA MAGNESIUM PHOSPHATE MARKET,2021-2030($MILLION)
    FIGURE 31.MEXICO MAGNESIUM PHOSPHATE MARKET,2021-2030($MILLION)
    FIGURE 32.GERMANY MAGNESIUM PHOSPHATE MARKET,2021-2030($MILLION)
    FIGURE 33.U.K. MAGNESIUM PHOSPHATE MARKET,2021-2030($MILLION)
    FIGURE 34.FRANCE MAGNESIUM PHOSPHATE MARKET,2021-2030($MILLION)
    FIGURE 35.SPAIN MAGNESIUM PHOSPHATE MARKET,2021-2030($MILLION)
    FIGURE 36.ITALY MAGNESIUM PHOSPHATE MARKET,2021-2030($MILLION)
    FIGURE 37.REST OF EUROPE MAGNESIUM PHOSPHATE MARKET,2021-2030($MILLION)
    FIGURE 38.CHINA MAGNESIUM PHOSPHATE MARKET,2021-2030($MILLION)
    FIGURE 39.JAPAN MAGNESIUM PHOSPHATE MARKET,2021-2030($MILLION)
    FIGURE 40.INDIA MAGNESIUM PHOSPHATE MARKET,2021-2030($MILLION)
    FIGURE 41.SOUTH KOREA MAGNESIUM PHOSPHATE MARKET,2021-2030($MILLION)
    FIGURE 42.AUSTRALIA MAGNESIUM PHOSPHATE MARKET,2021-2030($MILLION)
    FIGURE 43.REST OF ASIA-PACIFIC MAGNESIUM PHOSPHATE MARKET,2021-2030($MILLION)
    FIGURE 44.BRAZIL MAGNESIUM PHOSPHATE MARKET,2021-2030($MILLION)
    FIGURE 45.SAUDI ARABIA MAGNESIUM PHOSPHATE MARKET,2021-2030($MILLION)
    FIGURE 46.UAE MAGNESIUM PHOSPHATE MARKET,2021-2030($MILLION)
    FIGURE 47.SOUTH AFRICA MAGNESIUM PHOSPHATE MARKET,2021-2030($MILLION)
    FIGURE 48.REST OF LAMEA MAGNESIUM PHOSPHATE MARKET,2021-2030($MILLION)
    FIGURE 49. TOP WINNING STRATEGIES, BY YEAR
    FIGURE 50. TOP WINNING STRATEGIES, BY DEVELOPMENT
    FIGURE 51. TOP WINNING STRATEGIES, BY COMPANY
    FIGURE 52.PRODUCT MAPPING OF TOP 10 PLAYERS
    FIGURE 53.COMPETITIVE DASHBOARD
    FIGURE 54.COMPETITIVE HEATMAP OF TOP 10 KEY PLAYERS
    FIGURE 55.INNOPHOS HOLDINGS, INC..: NET SALES ,($MILLION)
    FIGURE 56.REFRACTORY MINERALS CO., INC..: NET SALES ,($MILLION)
    FIGURE 57.CELTIC CHEMICALS LTD.: NET SALES ,($MILLION)
    FIGURE 58.KRONOX LAB SCIENCES LTD.: NET SALES ,($MILLION)
    FIGURE 59.ANMOL CHEMICALS.: NET SALES ,($MILLION)
    FIGURE 60.NIKUNJ CHEMICALS.: NET SALES ,($MILLION)
    FIGURE 61.HAP SENG.: NET SALES ,($MILLION)
    FIGURE 62.AMERICAN ELEMENTS.: NET SALES ,($MILLION)
    FIGURE 63.JOST CHEMICAL CO..: NET SALES ,($MILLION)
    FIGURE 64.TRIVENI CHEMICALS.: NET SALES ,($MILLION)


According to the CXOs of the leading companies, the global magnesium phosphate market possesses a substantial scope for growth in the future. Emerging applications of magnesium phosphate in medication sector that support relaxation of muscles, prevent cramping of muscles, and prevent vitamin E deficiency is anticipated to boost the market demand during the forecast period. However, excessive intake of magnesium phosphate, especially from food, can cause low blood pressure, breathing issues, irregular heartbeats, and other health issues. There has been significant increase in demand for magnesium phosphate fertilizers especially from developing countries namely China and India. This is majorly owing to growing population, increase in arable land, and the use of magnesium phosphate as a soil conditioner. These factors are anticipated to drive excellent growth opportunities in the global magnesium phosphate market. According to the CXOs, Asia-Pacific is projected to register a more significant growth as compared to North American and European markets.

PURCHASE OPTIONS

Call or Email us

U.S.-Canada Toll-free: +1-800-792-5285
Int'l : +1-503-894-6022
Europe : +44-845-528-1300
Email : help@alliedmarketresearch.com
 
FREQUENTLY ASKED QUESTIONS?

A. Growing applications of magnesium phosphate in water treatment and in cement used for building construction is projected to influence the magnesium phosphate market in the upcoming years.

A. The major applications of magnesium phosphate include its use in fertilizer and in food additives.

A. Asia-Pacific is the largest regional market for the magnesium phosphate industry.

A. The estimated market size of magnesium phosphate is $2.0 billion by 2030.

A. Jost Chemical Co, Innophos Holdings, Inc., Triveni Chemicals, Refractory Minerals, Celtic Chemicals Ltd are the top companies to hold highest market share.

Looking for Customization?

 Customization Request

Have a Question?

 Speak with Analyst

Any Confusion?

 Inquire Before Buying

Have a glance of the Report

  Request Sample
RELATED TAGS

Purchase Full Report of
Magnesium Phosphate Market

Start reading instantly.
This Report and over 66,804+ more Reports, Available with Avenue Library. T&C*.

  • Online Only
  • $3,456
  • Online cloud access only
  • Restricted print, copy, paste & download
  • Read only
  • Free industry update
    (Within 180 days)
  • Free report update in next update cycle
    (Jun 2023 - Jun 2024)
  • Data Pack
  • $3,840
  • Restricted to one authorized user
  • One print only
  • Available in
    Excel
  • Free industry update
    (Within 180 days)
  •   Free report update in next update cycle
    (Jun 2023 - Jun 2024)
  • Single User
  • $5,769
  • Restricted to one authorized user
  • One print only
  • Available in
    PDF
  • Free industry update
    (Within 180 days)
  •   Free report update in next update cycle
    (Jun 2023 - Jun 2024)
  • Five Users
  • $6,450
  • Limited to five authorized users
  • Print upto five copies
  • Available in
    PDF
  • Free industry update
    (Within 180 days)
  •   Free report update in next update cycle
    (Jun 2023 - Jun 2024)
  • Enterprise
    License/PDF

  • $10,995
  • Unlimited
    within
    company/enterprise
  • Available in Excel & PDF
  • Free industry update
    (Within 180 days)
  •   Free report update in next update cycle
    (Jun 2023 - Jun 2024)
  • Library
    Membership

  • $999 $ 1,175
    Per User/ Per month/ Billed annually
  • Published Content
    E-access
  • Company Profiles
    E-access
  • Newly Added Content Access
  • 10 PDF
    Downloads
  • 5 Excel Data
    Pack Downloads
  • 250 Company Profiles PDF Downloads
  • Buy Now

*Taxes/Fees, if applicable will be added during checkout. All prices in USD

RELATED REPORTS
 

Why Allied Market Research?


Infallible Methodology

To ensure high-level data integrity, accurate analysis, and impeccable forecasts

Analyst Support

For complete satisfaction

Customization

On-demand customization of scope of the report to exactly meet your needs

TARGETED MARKET VIEW

Targeted market view to provide pertinent information and save time of readers

Get fresh content delivered

Get insights on topics that are crucial for your business. Stay abreast of your interest areas.

Get Industry Data Alerts

Why Allied Market Research?

Infallible Methodology

To ensure high-level data integrity, accurate analysis, and impeccable forecasts

Analyst Support

For complete satisfaction

Customization

On-demand customization of scope of the report to exactly meet your needs

TARGETED MARKET VIEW

Targeted market view to provide pertinent information and save time of readers